Large eddy simulation of water flow over series of dunes
2011-08-16JunLULinglingWANGHaiZHUHuichaoDAI
Jun LU, Ling-ling WANG* Hai ZHU Hui-chao DAI
1. College of Water Conservancy and Hydropower Engineering, Hohai University, Nanjing 210098, P. R. China
2. Zhangjiagang Water Conservancy Bureau, Zhangjiagang 215600, P. R. China
Large eddy simulation of water flow over series of dunes
Jun LU1,2, Ling-ling WANG*1, Hai ZHU1, Hui-chao DAI1
1. College of Water Conservancy and Hydropower Engineering, Hohai University, Nanjing 210098, P. R. China
2. Zhangjiagang Water Conservancy Bureau, Zhangjiagang 215600, P. R. China
Large eddy simulation was used to investigate the spatial development of open channel flow over a series of dunes. The three-dimensional filtered Navier-Stokes (N-S) equations were numerically solved with the fractional-step method in sigma coordinates. The subgrid-scale turbulent stress was modeled with a dynamic coherent eddy viscosity model proposed by the authors. The computed velocity profiles are in good agreement with the available experimental results. The mean velocity and the turbulent Reynolds stress affected by a series of dune-shaped structures were compared and analyzed. The variation of turbulence statistics along the flow direction affected by the wavy bottom roughness has been studied. The turbulent boundary layer in a complex geographic environment can be simulated well with the proposed large eddy simulation (LES) model.
large eddy simulation (LES); dunes; turbulent boundary layer; flow separation
1 Introduction
In sandy rivers, dunes and ripples are the most common river bed structures. Flow separation and recirculation are enhanced because of the presence of dunes in river beds, which alter the overall flow resistance and, consequently, affect the transport of sediment and contaminants within the river. Flow separation begins at the dune crest. On the lee side of dunes, there exists a series of recirculation eddies, and on the opposite stoss side, that is, on the upstream of the crest, the flow reattaches (Fourniostis et al. 2009).
The turbulent open channel flow over a river bottom with dunes has been experimentally and numerically studied under the assumption of a fixed bed without sediment movement. Lyn (1993) reported experimental research on the mean flow and turbulent characteristics over artificial space-periodic one-dimensional river bed structures using a laser Doppler velocimetry (LDV). Wiberg and Nelson (1992) conducted experiments under unidirectional flow over much smaller asymmetric and symmetric riverbed structures, including high-angle and low-angle ripples. Similar experiments have been carried out by many other researchers such as Nelson and Smith (1993) and Ojha and Mazumder (2008). Recently, numerical studieson the developing turbulent flow using a solution of the Reynolds-averaged Navier-Stokes equations (RANS) have been carried out by researchers (Huai et al. 2010; Peric et al. 1988). For example, Huai et al. (2010) used the realizablek-εmodel to simulate the buoyant wall jet, and Peric et al. (1988) numerically simulated theflow over a typical dune using thek-εturbulence model. The influence of sand grain roughness was taken into account with the wall function approach. Comparisons with experiments show that the computed separated and reattached flow over a dune is in good agreement with the experimental data. Similar studies were reported by Mendoza and Shen (1990), who presented an algebraic-stress model with wall functions in place of thek-εmodel. They were able to obtain quite realistic predictions of detailed pressure, velocity, and turbulence profiles. Johns et al. (1993) employed the one-equation turbulence model, with the turbulence model length scale prescribed from an empirical correlation. The comparisons show that the near-wall velocity and turbulence data, particularly the wall shear stress, are not in good agreement with experimental data. Yoon et al. (1995) simulated the flow over a fixed dune using thek-ωturbulence model of Wilcox (1993). Comparisons of model prediction results with measured velocity and turbulence fields, as well as the pressure and friction distributions along the dune, show good agreement. Lu and Wang (2009) compared three differentk-εmodels, the standardk-εmodel, the renormalization group (RNG) model, and the V2F model, for simulating the separated flow passing sills. The results show that, of the three models, the performance of the V2F model is the most encouraging. The commercial computational fluid dynamics (CFD) code FLUENT was employed by Fourniostis et al. (2009) to simulate sub-critical, turbulent, and open-channel flows over a bottom with five dunes using the free surface treatment method based on the rigid-lid approximation. They reported that the numerical prediction results of the mean velocity and turbulence are in good agreement with available experimental data.
Although the RANS model can provide satisfying prediction results of flow features over dune s, it cannot calculate the power spectrum of hydrodynamic turbulence, which is very important for turbulence research and a rather interesting parameter for some specific engineering applications and refined turbulence structures. In recent years, large eddy simulation (LES) has been used to study hydrodynamic turbulence. For example, the separated flow passing sills have been studied by Lu and Wang (2008). The computed results show that LES is very powerful and encouraging. Therefore, it is possible to use the LES technique to obtain a detailed numerical simulation of open channel flow over a series of dunes.
2 Governing equations and numerical methods
2.1 Governing equations inσcoordinates and turbul ence model
The LES approach inσcoordinates was used by Lin and Li (2002). The equatio ns for the large-scale motion can be obtained by integrating a spatial filter with the Navier-Stokes equations (indicated by an over-bar). With a top-hat filter based on the Boussinesq assumptionand the principle of chain differentiation, the governing equations for the incompressible fluid in general coordinates can be written as

wheretis time,ξkandξlare the coordinate directions in the transformed space,is the Cartesian coordinate,J-1is the Jacobin factor of the transformation,uiis the Cartesian component of the velocity field,fiis the gravitational force,ρis thewater density,pis the static pressure,νis the kinematic viscosity, andis the subgrid stress.
In natural open chan nel flow, the free surface elevation varies with time and the bottom is unev en. These cause certain difficulties when conventional Cartesian coordinates are used in the discretization of the domain in the vertical direction. To solve the uneven physical domain, the verticalσ-coordinate transformation is used as follows:

whereηis the surface elevation,zis the vertical direction in Cartesian coordinates, andhis thestatic water depth. The sub grid stresscan be decomposed into the sum of a tra ce-free factorand a diagonal tensor:

whereis absorbed in the pressure term andδijis the Kronecker sign. In this study, we modeled t he eddy viscosityνtwith the coherent eddy model (Lu and Wang 2009):

The coefficientCsis computed by a dynamic procedure. The initial dynamic constant,Cl,is calculated as follows (Germano et al. 1991; Lilly 1992):


where the test filter width, and the coefficientcan be optimized. The coefficientk′is taken to be, andαis taken to be 0.5.can exhibit long-time negative values which will generate numerical instability. To solve this problem, we first calculated the value ofwith the coherent eddy model proposed by Lu et al. (2010), and then filtered it in space with a box filter as follows:

whereG(x-ξ) is a smooth function andCl(x,t) is the dynamic constant calculated by Eq. (8). Although the smooth function can be in many forms, a box filter function was used for convenience in this study. Therefore, Eq. (11) can be written as

In fact, we can repeat the averaging procedure above to make the model coefficient smoother. In addition, the conditionνt+ν≥0 was imposed. This condition ensured that the total resolved dissipation remained positive or at zero.
2.2 Numerical methods and boundary conditions
The splitting operator approach was used to numerically solve the governing equations. The momentum equations were split into three steps in each time interval: advection, diffusion, and pressure propagation. The advection step was solved using a combination of the quadratic backward characteristic method and the Lax-Wendroff method. The central difference method was used to solve the diffusion step. The pressure propagation step was used to solve pressure and gravitational forces. In order to satisfy the divergence-free condition as imposed by the continuity equation, the projection method was employed to calculate the pressure and velocity fields to obtain the updated velocity field. The conjugate gradient stabilized (CGSTAB) method was used to solve the above equations.
The governing equations may be solved only when adequate boundary conditions are provided. Several types of boundary conditions are usually imposed in open channel flow problems. The no-slip boundary condition is imposed on the bottom wall and a zero gradient boundary condition is imposed on the two side walls. At the inflow boundary, the inflow rate with a predetermined velocity distribution with added Gaussian distribution random signals is specified and the gradient of the water surface elevation is assumed to be zero. At the outflow boundary, a convective boundary condition is imposed. A Lagrange-Euler method is used to locate the free surface elevation. Details of these boundary conditions can be found in Lin and Li (2002), Li and Ma (2003), and Lu and Wang (2009).
3 Study case
Fig. 1 is a typical domain of open channel flow over a series of twelve identical dunes. The numbers and shape of the dunes shown here correspond to those used in the experiments of Ojha and Mazumder (2008). The experimental channel has a length of 10 m, a width of 0.5 m, and a depth of 0.5 m. The dunes have a mean length ofL= 32 cm and a mean height ofHd=3cm at the crest The angles of the stoss side and lee side slopes of the dunes were 6° and 50°, respectively (Fig. 1). Velocity profiles were measured by an acoustic Doppler velocimeter (ADV). The mean flow depthhis 30 cm, the mean horizontal velocityUis 0.5 m/s, and the dischargeQis 0.04 m3/s. The corresponding Reynolds number is=1.5× 10⁵and the Froude number is.

Fig. 1 Sketch of computed domain and dune profiles of Ojha and Mazumder (2008)
The simulation domain was carefully chosen in order to properly set up the inflow and outflow boundaries. To ensure that the inlet flow fully developed, the length of the main channel upstream of the first dune was extended to 0.5 m. The length of the main channel downstream of the last dune was also extended to 0.5 m to avoid the influence caused by the downstream outflow. A non-uniform grid of 451 × 11 × 45 nodes in thex,y, andzdirections, respectively, was used to discretize the computational domain (5 m long, 0.1 m wide, and 0.3 m deep). The expansion ratio of the grid did not exceed 1.01. The time step was 0.000 2 s. The grid and time step were small enough to obtain grid-convergent results. The total computing time was 40 s.
4 Results and discussion
Fig. 2 shows the computed horizontal mean velocity profiles at the trough and crest points, respectively, of each dune. Corresponding profiles of the vertical mean velocity are shown in Fig. 3. In the figures, odd and even numbers inside circles represent the positions of velocity profiles at the trough and crest points, respectively (Fig. 1). From Fig. 2 and Fig. 3, it can be seen that the computed velocity results agree well with the experimental data. The most evident feature is that the horizontal mean velocity near the trough points is negative except at the trough of the first dune, which means that reversal flow exists at the trough points. Thecomputed results clearly show that the turbulent boundary layer is developing from the first dune to the seventh dune and it reaches a quasi-steady state after the seventh dune.

Fig. 2 Horizontal velocityUover dunes (dashed lines are whereU= 0)
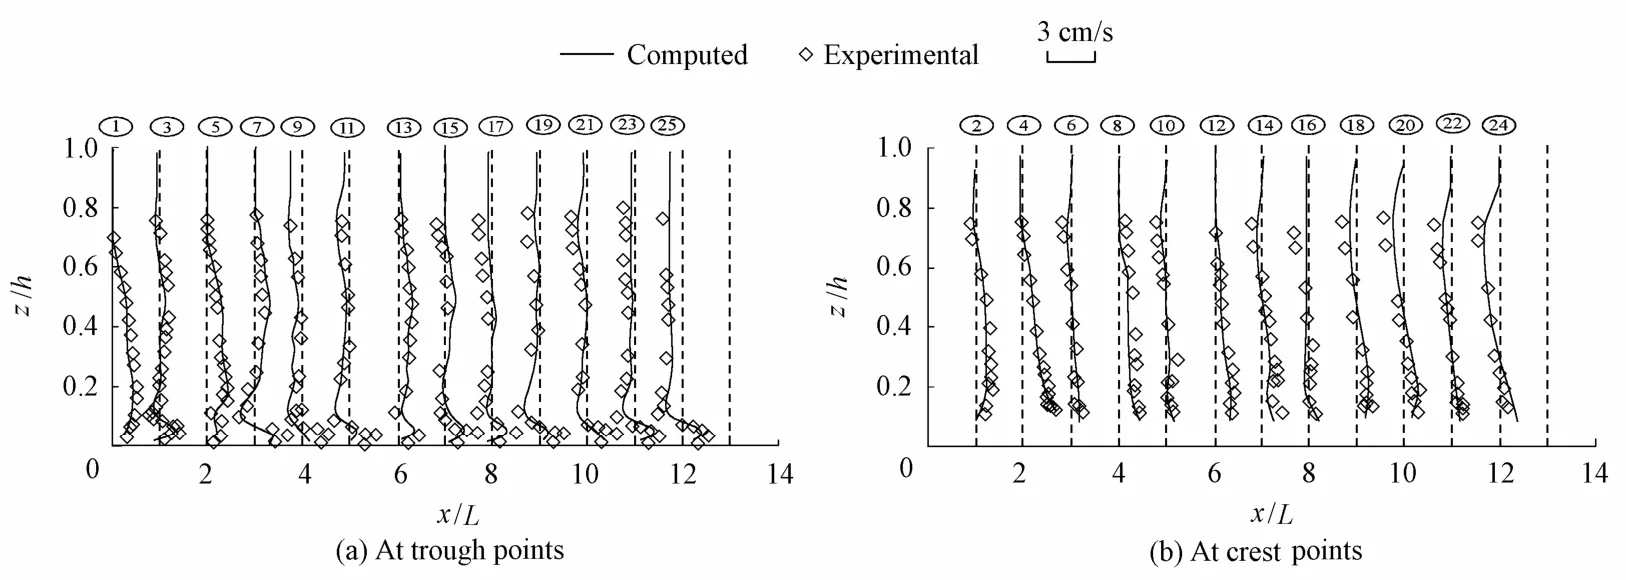
Fig. 3 Vertical velocityWover dunes (dashed lines are whereW= 0)
To keep the figure readable, the velocity field of two adjacent dunes is shown as in Fig. 4. As can be seen, the spatial development of the turbulent open channel flow over the dunes has the characteristic that the flow separates at the dune crest and reattaches on the stoss side of the next dune. A similar phenomenon was shown by Fourniostis et al. (2009) in their computed results of five dunes. In Fig. 5, a closer view of the velocity vector between the ninth and tenth dunes in the fully developed region is shown to provide a better view of the flow field over a complete trough region. The figure contains both the experimental and corresponding computational velocity vector fields. Agreement is seen to be good within the recirculation zone. According to the flow pattern, three distinct layers are observed: (1) the internal layer at, where the mean horizontal velocity always stays negative; (2) the advecting and diffusing layer at, where the mean streamwise velocity becomes positive but is still much smaller than that in turbulent channel flow without dunes at the same position; and (3) the outer flow layer at, where the mean streamwise velocity is almost the same as in turbulent channel flow with a flat bottom (Ojha and Mazumder 2008).
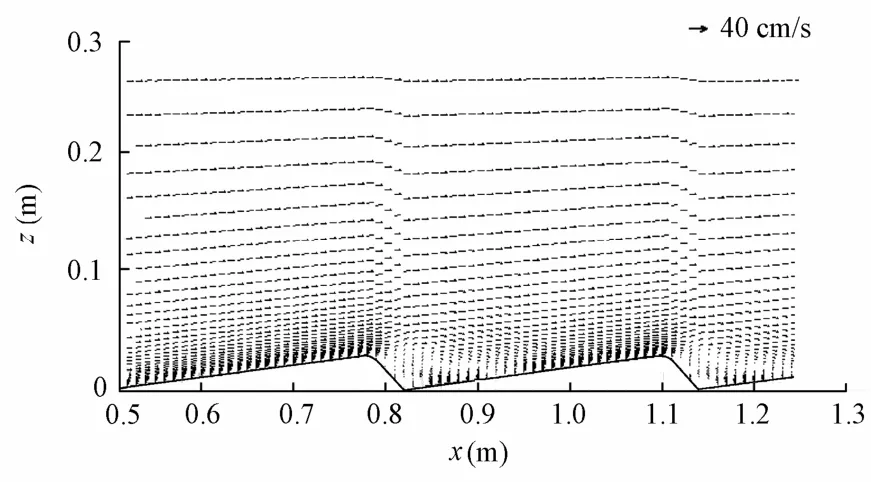
Fig. 4 Computed velocity field

Fig. 5 Velocity field between ninth and tenth dunes
Fig. 6 shows the spatial development of the Reynolds stressalong the flow over dunes. From Fig. 6, it can be seen that the flow characteristics vary up to the seventh dune, beyond which the entrance effect disappears. That is to say, the turbulence fully develops, because the increment of Reynolds stress intensity (the thickness in Fig. 6) grows much smaller after the seventh dune. Again, this is in qualitative agreement with the experimental observations.
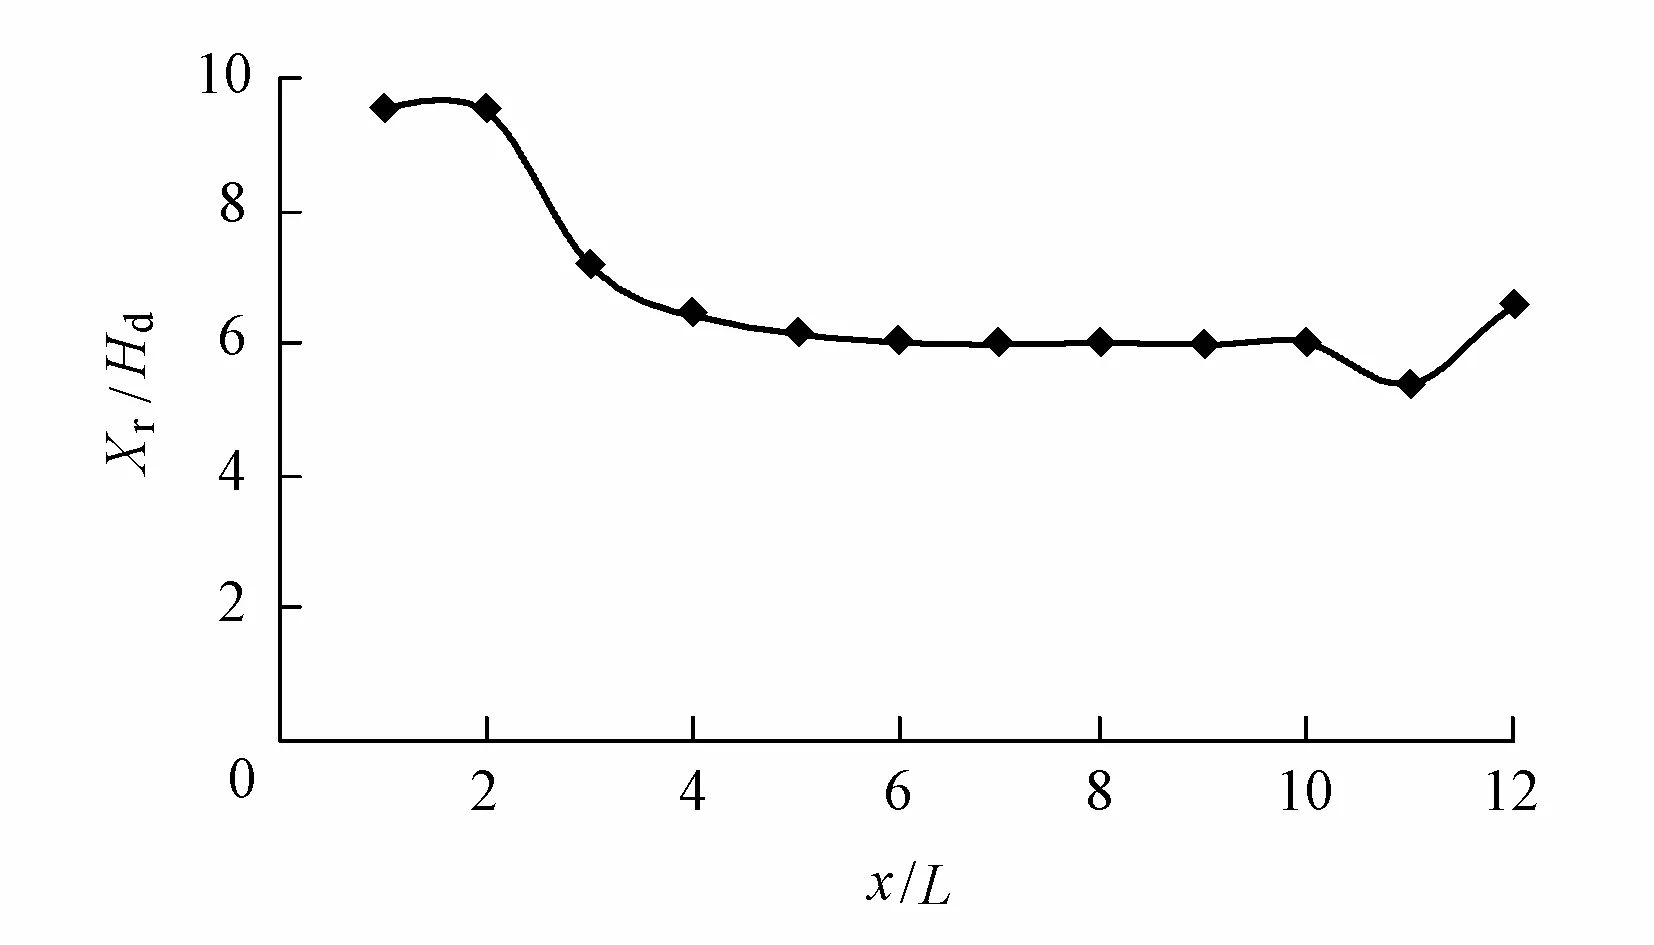
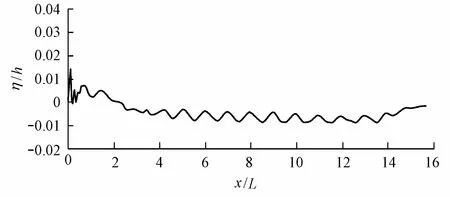
The reattachment point is determined as the location closest to the bottom at which the mean velocity changes sign. The predicted values at each reattachment point are shown in Fig. 7. From Fig. 7, it can be seen that the first two computed reattachment lengths are much larger than the remaining values. Flow reaches the fully developed state after the seventh dune, which is in agreement with the result mentioned above. The predicted reattachment length is=6.0 at the quasi-steady state (as shown in Fig. 5), which is a little larger than the experimental value of 5.8 (Fourniostis et al. 2009), whereXris the reattachment length. Kasagi and Matsunaga (1995) conducted an experiment of the flow over a backward-facing step with a Reynolds number of 5 540, giving a value of 6.5. With the increasing of the Reynolds number in the range of 1200 Fig. 6 Distribution of Reynolds shear stress Fig. 7 Reattachment length at each dune The free surface plays a significant role in the open channel over dunes. The normalized free surface level () over dunes is shown in Fig. 8. From the figure, it can be seen that the average water level rises before the first dune because the existence of the dunes increases the roughness of the channel bottom. In the middle of the channel, free surface elevation fluctuates in accordance with the distribution of dunes on the bottom. The average water level is low due to the reduction of the cross-section area. Near the outflow region where dunes disappear, the free surface tends to increase just like the outlet of a sluice. Fig. 8 Free surface elevation over dunes In order to analyze the head loss caused by dunes, the energy equation of the cross-section between the inflow and outflow boundaries can be expressed as whereZinis the inflow water elevation;Zoutis the outflow water elevation;αinandαoutare coefficients, whereαin=1 andαout=1;PinandPoutare the dynamic water pressures at the inlet and outlet positions, respectively;UinandUoutare the mean stream-wise velocities at the inlet and outlet positions, respectively;gis the gravitational acceleration; andhwis the water head loss. From Eq. (13), we find that the head loss between the inflow and outflow sections is about 0.014 m. Large eddy simulation of open channel flow over a series of dunes in the sigma coordinates were carried out. The subgrid stress was modeled with the dynamic coherent eddymodel proposed by the authors. The computed velocity profiles are in good agreement with the available experimental data. It was found that turbulence does not reach a fully developed state until at the seventh dune. The computed results show that the length of the separation zone at the fully developed region is about 6Hd, which is a little larger than those in the experiment. The spatially mean free surface level decreases in the flow direction. The head loss caused by dunes is about 0.014 m. With the employment of the sigma coordinates and splitting operator method, the dynamic coherent eddy model proposed by the authors has great advantages in simulating turbulent flows in complex geographic environments, which is of great importance and engineering value to river dynamics simulation. Bardina, J., Ferziger, J. H., and Reynolds, W. C. 1980. Improved subgrid-scale model for large-eddy simulation.Proceedings of the 13th Fluid and Plasma Dynamics Conference.Snowmass: American Institute of Aeronautics and Astronautics. Dejoan, A., and Leschziner, M. A. 2004. Large eddy simulation of periodically perturbed separated flow over a backward-facing step.Fluid and Heat Flow, 25(4), 581-592. [doi:10.1016/j.ijheatfluidflow.2004. 03.004] Fourniostis, N. T., Toleris, N. E., and Demetracopoulos, A. C. 2009. Numerical computation of turbulence development in flow over sand dunes.Advances in Water Resources and Hydraulic Engineering, Proceedings of 16th IAHR-APD and 3rd IAHR-ISHS, 943-848. Beijing: Tsinghua University Press. [doi:10.1007/978-3-540-89465-0_148] Germano, M., Piomelli, U., Moin, P., and Cabot, W. H. 1991. A dynamic subgrid-scale eddy viscosity model.Physics of Fluids, 3(7), 1760-1765. [doi:10.1063/1.857955] Huai, W. X., Sheng, Y. P., and Komatsu, T. 2003. Hybrid finite analytic solutions of shallow water circulation.Applied Mathematics and Mechanics (English Edition), 24(9), 1081-1088. [doi:1000-0887(2003)09-0956-07] Huai, W. X., Li, Z. W., Qian, Z. D., Zeng, Y. H., Han, J., and Peng, W. Q. 2010. Numerical simulation of horizontal buoyant wall jet.Journal of Hydrodynamics, 22(1), 58-65. [doi:10.1016/S1001-6058(09) 60028-7] Johns, B., Soulsby, R. L., and Xing, J. 1993. A comparison of numerical model experiments of free surface flow over topography with flume and field observations.Journal of Hydraulic Research, 31(2), 215-228. [doi:10.1080/00221689309498846] Kasagi, N., and Matsunaga, A. 1995. Three-dimensional particle tracking velocimetry measurement of turbulence statistics and energy budget in a backward-facing step flow.Fluid and Heat Flow, 16(6), 477-485. [doi:10.1016/0142-727X(95)00041-N] Li, C. W., and Ma, F. X. 2003. Large eddy simulation of diffusion of a buoyancy source in ambient water.Applied Mathematical Modeling, 27(8), 649-663. [doi:10.1016/S0307-904X(03)00073-8] Lilly, D. K. 1992. A proposed modification of the Germano subgrid-scale closure method.Physics of Fluids, 4(3), 633-635. [doi:10.1063/1.858280] Lin, P. Z., and Li, C. W. 2002. Aσ-coordinate three-dimensional numerical model for surface wave propagation.International Journal for Numerical Methods in Fluids, 38(11), 1045-1068. [doi:10. 1002/fld.258] Lu, J., and Wang, L. L. 2008. Numerical study of large eddy structures-separated flows passing sills.Advances in Water Resources and Hydraulic Engineering, Proceedings of 16th IAHR-APD and 3rd IAHR-ISHS, 1795-1799. Beijing: Tsinghua University Press. [doi:10.1007/978-3-540-89465-0_309] Lu, J., and Wang, L. L. 2009. Comparison of several turbulent models for calculating separated flows passing on sill.Advances in Water Science, 20(2), 255-260. (in Chinese) Lu, J., Tang, H. W., and Wang, L. L. 2010. A novel dynamic eddy model and its application to LES of turbulent jet with free surface.Science in China, Ser. G, 53(9), 1671-1680. [doi:10.1007/s11433-010-4077-z] Lyn, D. A. 1993. Turbulence measurement in open channel flows over artificial bedforms.Journal of Hydraulic Engineering, 119(3), 306-326. [doi:10.1061/(ASCE)0733-9429(1993)119:3(306)] Mendoza, C., and Shen, H. W. 1990. Investigation of turbulent flow over dunes. Journal of Hydraulic Engineering, 116(4), 459-477. [doi:10.1061/(ASCE)0733-9429(1990)116:4(459)] Nelson, J. M., and Smith, J. D. 1993. Mean flow and turbulence over two-dimensional bed forms.Water Resources Research, 29(12), 3925-3953. [doi:10.1029/93WR01932] Ojha, S. P., and Mazumder, B. S. 2008. Turbulence characteristics of flow region over a series of 2-D dune shaped structures.Advance in Water Resources, 31(3), 561-576. [doi:10.1016/j.advwatres.2007.12.001] Peric, M., Ruger, M., and Scheuerer, G. 1988.Calculation of the Two-dimensional Turbulent Flow over a Sand Dune Model. Erlangen: University of Erlangen. Wiberg, P. L., and Nelson, J. M. 1992. Unidirectional flow over asymmetric and symmetric ripples.Geophysical Research, 97(8), 12745-12761. [doi:10.1029/92JC01228] Wilcox, D. C. 1993.Turbulence Modeling for CFD. La Canada: DCW Industries. Yoon, J. Y., Patel, V. C., and Ettema, R. 1995. Numerical model of flow in ice-covered channels.Journal of Hydraulic Engineering, 122(1), 19-26. [doi:10.1061/(ASCE)0733-9429(1996)122:1(19)] This work was supported by the National Natural Science Foundation of China (Grant No. 51179058), the National Science Fund for Distinguished Young Scholars (Grants No. 51125034 and 50925932), the Special Fund for Public Welfare of the Water Resources Ministry of China (Grant No. 201201017), and the 111 Project (Grant No. B12032). *Corresponding author (e-mail:wanglingling@hhu.edu.cn) Received Jan. 7, 2011; accepted Aug. 20, 2011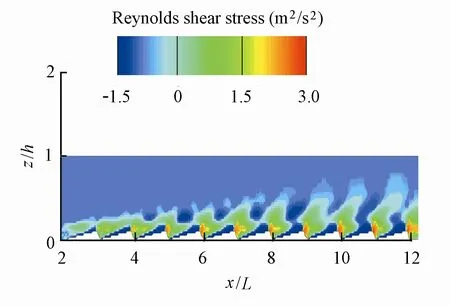

5 Conclusions
杂志排行
Water Science and Engineering的其它文章
- Two-dimensional physical habitat modeling of effects of habitat structures on urban stream restoration
- Experimental study on total dissolved gas supersaturation in water
- Hydrodynamic effects of reconnecting lake group with Yangtze River in China
- Sediment transport following water transfer from Yangtze River to Taihu Basin
- Research on shape optimization of CSG dams
- Analysis of black water aggregation in Taihu Lake
