Correlation between heart rate variability and pupillary reflex in healthy adult subjects under the influence of alcohol*☆
2011-07-19JinMaRumengMaXiwenLiuZhihongWenXiaojingLiTaoWangWenqiangHanWendongHuZuomingZhang
Jin Ma, Rumeng Ma, Xiwen Liu , Zhihong Wen, Xiaojing Li, Tao Wang, Wenqiang Han,Wendong Hu, Zuoming Zhang
1Department of Aerospace Medical Equipment, Faculty of Aerospace Medicine, Fourth Military Medical University, Xi’an 710032, Shaanxi Province, China
2Tangdu Hospital, Fourth Military Medical University, Xi’an 710038, Shaanxi Province, China
3Department of Basic Nursing, Nursing School, Fourth Military Medical University, Xi’an 710032, Shaanxi Province, China
4School of Humanities and Science of Xi’an Jiaotong University, Xi’an 710032, Shaanxi Province, China
5Department of Clinical Aerospace Medicine, Faculty of Aerospace Medicine, Fourth Military Medical University, Xi’an 710032, Shaanxi Province, China
lNTRODUCTlON
Human fatigue is known to be an issue of major concern in airplane operation[1].
Fatigue can be caused by a lack of sleep,tight scheduling, alcohol consumption,health problems, work and boarding conditions, and other stress factors. These factors can contribute to airplane accidents during extended flights.
Fatigue is a dangerous psychophysiological condition for people working in a variety of high-risk professions such as pilots, drivers,and security guards. Alcohol intake is a commonly used model of fatigue[2-4]. Studies on the effects of alcohol on performance have a long and well-documented history,especially in the transportation industry[1].
Piloting aircraft and ships, car driving, and other complex jobs require high levels of cognitive and psychomotor capabilities[5-6].
Overdrinking can result in impaired cognition,leading to poorer information processing,memory recall, verbal expression, timely responsiveness, vigilance, reasoning, and recognition skills; these can often cause fatal operational errors.
Surveys of air accidents that have occurred in different countries demonstrated that 9-12% were related to alcohol consumption[7-9]. In addition, about 10-30%of pilots involved in fatal airplane accidents had alcohol in their blood, and 30% of fatal airplane accidents that happened in the Southwestern region in the United States in 1965 were related to pilots with blood alcohol content higher than 0.015%[10-12]. In 1971, in an effort to reduce alcohol-related airplane accidents, the Federal Aviation Administration introduced the 8-hour“bottle-to-throttle rule”, and consequently the accident rate was cut by 13-19%. The effects of alcohol on aviation include space disorientation, which can be interpreted as“the pilot’s inability to interpret with accuracy of the flying speed or altitude from a basis point on a terrain and the state of the plane”[13]. If disorientation is not recognized immediately, the pilot becomes unable to control the airplane. Alcohol also has a negative effect on the vestibular organ,which transmits the sense of position and movement of the body to the central nerve.
In addition, it affects the eye movement.
However, there has been some disagreement on this issue. In a previous study[7],participants drank alcohol and operated an Boeing 727 simulator for 1 hour. Results showed that even an amount of alcohol which equaled the lowest blood alcohol content led to a failure in proper plane operation and increased errors in flying processes and plans.
However, another study reported that with a blood alcohol content lower than 0.04%, pilots’ radio exchange ability clearly worsened, but their flying skills did not noticeably diminish[14].
The present study was designed to explore the relationship between the autonomic modulation of the pupil diameter, heart rate variability, and blood alcohol content.
RESULTS
Quantitative analysis of the participants
Sixteen healthy young male subjects were included in the experiment. All were included in the final analysis.
Pupil area
Significant differences in pupil areas between statuses are shown in Figure 1. Compared with the baseline, the pupil area increased by about 6.4% (P < 0.001) in state II(1 hour after alcohol consumption), while it decreased by about 8.1% (P < 0.001) in state III (24 hours after alcohol consumption). At the same time, there was a significant difference between state II and state III (P < 0.001).
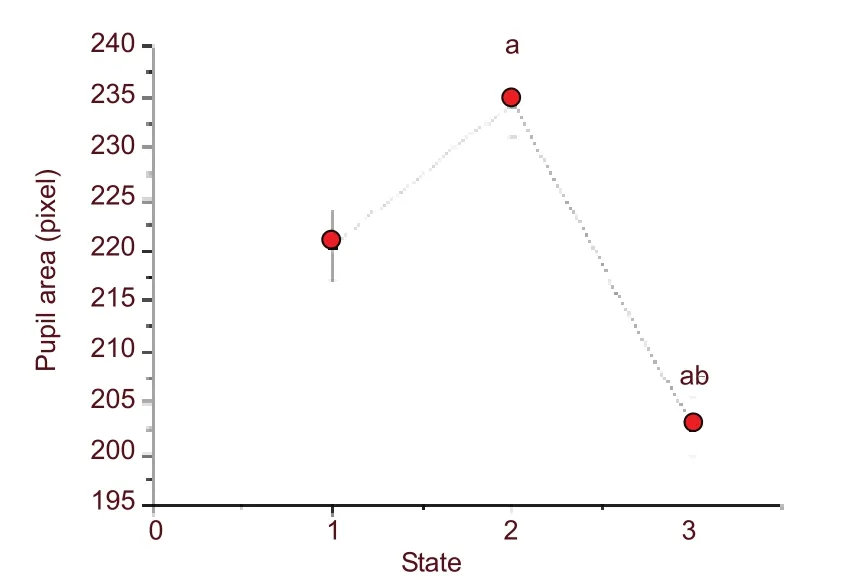
Figure 1 Change in pupil area of 16 subject. aP < 0.001,vs. baseline, as determined by one-way analysis of variance followed by Tukey’s multiple comparison test.bP < 0.001, vs. 1 hour after alcohol consumption as determined by one-way analysis of variance followed by Tukey’s multiple comparison test. Error bars indicate standard errors of the mean. The numbers 1-3 at axis X represent three states: baseline (I), 1 hour after alcohol consumption (II) and 24 hours after alcohol consumption(III), respectively.
Time domain and frequency domain of heart rate variability
Time domain and frequency domain of heart rate variability are shown in Table 1 and Figure 2. There were no significant differences in total frequency, low frequency and high frequency between statuses.
Compared with the baseline state, it was observed that(1) both low frequency and high frequency components of states II and III showed a homological trend of variation; (2) the high frequency had a sharper variational amplitude than the low frequency at state II, and was contrary to state III; (3) the low frequency had a relatively large variance at state III.
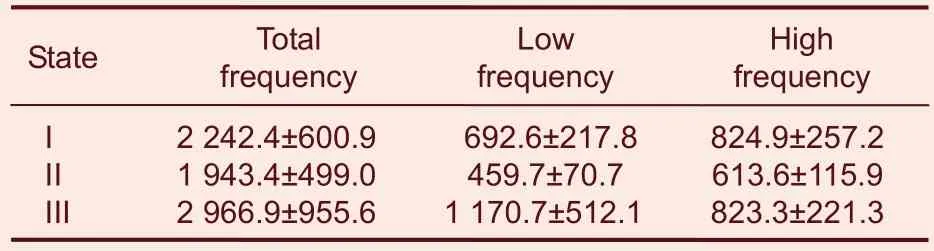
Table 1 Change in time and frequency domain of heart rate variability of 16 subjects under the influence of alcohol

Figure 2 Change in low frequency (LF)/high frequency(HF) (A) and standard deviation of all NN intervals (SDNN)obtained from 16 healthy volunteers (B). aP < 0.05, vs.baseline as determined by one-way analysis of variance followed by Tukey’s multiple comparison test. Data are expressed as mean ± SEM. The numbers 1-3 at axis X represent three states: baseline (I), 1 hour after alcohol consumption (II) and 24 hours after alcohol consumption(III), respectively.
All of these findings indirectly indicate that the vagus nerve was primarily involved. The time domain standard deviation of all NN intervals (SDNN) decreased after drinking alcohol, which meant that the cardiac cycle tended to be more consistent after alcohol consumption.
The linear regression equation between the pupil diameter as a dependent variable Y and SDNN, and low frequency/high frequency as an independent variable was: Y = 215.198 - 0.217X1 + 0.177X2,In the equation above, X1 is low frequency/high frequency, of which the correlation coefficient was -0.143(P < 0.05), and X2 is the SDNN of which the correlation coefficient was 0.816 (P < 0.01).
DlSCUSSlON
Since it has been recognized that there are physical and psychological variations in pilots after alcohol intake,special attention should be paid to the risk involved in aircraft operation. This study showed that bio-signals,including heart rate variability, were significantly affected by alcohol consumption. We did find very distinct correlations between indices of heart rate variability and the pupil diameter. However, it was comparatively difficult to gain accurate indices from individuals who are employed in semi-active jobs such as flight operation;more accurate indices can, in fact, be gained in subjects with inactive jobs. In addition, the difference in heart rates between blood alcohol content 0% (no alcohol intake), and blood alcohol content 0.05%/ blood alcohol content 0.08% (low-dose alcohol intake) was statistically significant[15]. This suggests that these indices are appropriate to measure exhaustion caused by psychological stress, tension, and heavy mental workload.
During the third experiment, there were significant differences in pupil area between baseline levels, 1 hour after alcohol consumption, and 24 hours after alcohol consumption. This suggests that the overall time was influenced by alcohol intake, which contributed to the change in test results[16-17]. Furthermore, images of the pupil under the three conditions suggested data on fatigue could be obtained through the percentage of eyelid closure.
This research was designed to investigate the psycho-physical status by pupil variation and dynamic state heart rate variability. The results show that compared with baseline and 24 hours after alcohol consumption, the pupil area at 1 hour after alcohol consumption was significantly increased, indicating that under the condition of mental overload, the pupil area becomes enlarged to adapt to stress. Furthermore, it was observed that changes in the autonomic nervous system could objectively reflect the psychophysical status in some manners. At the same time, the linear regression equation indicated that time- and frequency-domain indices of heart rate variability were negatively related to pupil area. This means that when the heartbeat becomes accentuated, heart output increases, atrial contraction strengthens, and the sympathetic nerve plays a greater role. Furthermore, pupil area increases, which corroborates the repeated measurement analysis of variance result of the pupil area. These phenomena could be caused by different functions of the sympathetic nerve pre-fibers and post-fibers, as the pre-fiber is a Class B myelin nerve fiber with a faster transmission speed, while the post-fiber is a category C non-myelin nerve fiber with a slow conduction velocity[18]. As a result,when the body is suffering stress, the automatic nervous system starts to function more slowly but the state of stress lasts longer. This may be because the sympathetic nervous system controls a comprehensive range of activities, often being involved in a whole system response, and its primary role is to rapidly adapt one’s body to environmental changes and stimulus.
Norepinephrine may play a special role in this scenario,because sympathetic post-release fibers are its main transmitter. When the body is cold, hot, fatigued, or under other uncomfortable stressful conditions, the sympathetic nerve becomes excited and starts to release norepinephrine. Norepinephrine then promotes the expression of Β1 receptor and norepinephrine in the heart, and the binding of α receptor. Subsequently, the iris radial muscle contracts to expand the pupil, and the cardiac muscle begins to increase cardiac output.In conclusion, the results of the present study show the significant effects of mental fatigue caused by alcohol on indices of heart rate variability and pupil area. These effects are different from effects on these indices caused by physical fatigue. The main mechanism of mental fatigue for optesthesia and cardiovascular ability may lie in the attenuation of the central nervous system coordination to visual and cardiac information and motor effector control. The visual system may play a key role in this process, which needs further study.
SUBJECTS AND METHODS
Design
A self-comparison, repetitive measurement using analysis of variance.
Time and setting
Experiments were performed at the Laboratory of Faculty of Aerospace Medicine, Fourth Military Medical University of Chinese PLA in China, from October to November 2007.
Experimental subjects
Sixteen healthy young male volunteers were enrolled
from the Fourth Military Medical University of Chinese PLA from Tencent QQ. They had an average age of 18.1± 1.4 years, an average weight of 66.3 ± 7.13 kg, and an average height of 173.1 ± 15.5 cm. The subjects were prohibited from smoking, drinking coffee or stimulants for 3 days before and during the experiment. All subjects had generally healthy habits, and did not use social drugs including caffeine, cigarettes or alcohol.
Methods
Alcohol manipulation
Distillate spirit (53°; Xifengjiu Co., Ltd., China) was used to establish the fatigue model on the basis of the desired dose (0.65 g/kg), which followed the standard of alcohol consumption which was previously reported[19]. Under this condition, the level of blood alcohol content was about 1%. To avoid a sharp blood alcohol content peak,snacks (cheese, crackers, potato chips, and fruit) were provided for the subjects after each dose.
Performance testing
Two computerized physiological motor tests were used.The tests are briefly described below.
Pupillary test: The equipment included a video transmission cable, a frame grab card and a computer.
The video frequently sent images of the pupil to the eye tracking system (Arrington Research, Inc., Scottsdale,AZ, USA). Data were processed to determine the state of the pupil. The camera took one image of the pupil every 5 seconds. All subjects had to sit in a dark room for 2 minutes before the test. The camera was used to determine the location of visual attention. By localizing the eye position, the eye-tracking system recorded visual movements. In the system, there were two video cameras, one of which was an infrared camera that recorded the vision images of the pupils. The images were digitized and sent to a processing module, together with the scene signals obtained by another common camera, and the centers of each pupil were obtained for fixation of the gazing point in the visual scene. This process is shown in the Figure 3.

Figure 3 Workflow of the eye tracking system.
As the designed modular eye-tracking system has standard signal transmitting ports, like a composite video port and a standard serial port to ensure that the modules are connected through these ports, we were able to obtain original data, including video frequency and scene frequency, which could provide the basis for further development of the eye-tracking system.
The output port in the pupil camera was adjusted so that the pupil video frequency was sent to both the subsequent module of the eye tracking machine for detecting the gazing point and the image grab card to the computer. Thus we could determine the level of closure of the eyelid and the subject’s fatigue state, which was determined by analyzing the percentage of the eyelid closure value (Figure 4).
The pupil of the left eye was imaged by a video camera(Tianmin, Huizhou, China), placed in an eye shield which was worn on the head of the subject. The camera was directly placed to the pupil to record the data of visual axis. To facilitate measurement of the pupil size by image analysis using a pupillometer (developed by Research Room of Clinical Medicine, Faculty of Aerospace Medicine, Fourth Military Medical University), an infra-red light source was mounted on the video camera. The video image was analyzed using software compiled by delphi 7.0 (Borland, USA) at a frequency of 10 Hz. The pupil was located using a threshold and edge detection algorithm, allowing the pupil diameter to be analyzed at a resolution of < 0.02 mm. The pupillary test graph of every subject was delineated in Microsoft Origin 6.0 (OriginLab,Northampton and Wellesley Hills, MA, USA). These graphs indicated the changes in pupil area under alcohol consumption.

Figure 4 Flow chart of fatigue detection based on the eye-tracking machine.
After the pupillary test, the heart rate variability test was performed. All subjects were measured by limb lead,including a left arm electrode, a right arm electrode and a left leg electrode (electrode-avf). All subjects were lying down for the experiment, and 10-minute electrocardiosignals were recorded in three states with a RM6280C multi-channel physiological signal collection processing system (Cheng Du Instrument Factory,China). Several typical time- and frequency-domain heart rate variability calculation indices were selected for data analysis, as shown in Table 2.

Table 2 Standard heart rate variability measures:time-domain measurement method
Three main spectral components were distinguished in a spectrum calculated from short-term recordings: very low frequency, low frequency, and high frequency components.
Procedure
Subjectswere placed in four groups with four subjects in each group for 4 weeks. Every group attended a 2-day practice session to become acquainted with the study and the performance tests. In this session, the subjects’weights and heights were measured. On day 1, the subjects completed a baseline performance test at 8:00 p.m. Alcohol was then consumed at 7:00 p.m. on day 2.
Tests were performed at baseline, 1 hour after drinking,and at 8:00 p.m. on day 3. Every test session took approximately 25-30 minutes.
Statistical analysis
Statistical analysisof the data was performed using SPSS 10.0 software (SPSS, Chicago, IL, USA). Data were expressed as mean ± SEM and analyzed using repeated measurement analysis of variance followed by Tukey’s multiple comparison test to identify the cross-referring variance before and after alcohol consumption. Correlation between pupil diameter and heart rate variability indices was analyzed using linear regression. A value of P < 0.05 was considered statistically significant.
Author contributions:Jin Ma, Rumeng Ma, and Zhihong Wen provided article data and ensured the integrity of the data.
Wendong Hu and Zuoming Zhang participated in the study concept and design. Jin Ma, Zhihong Wen, Xiaojing Li, and Tao Wang participated in the study analysis. Jin Ma, Rumeng Ma,and Xiwen Liu participated in the manuscript writing. Wendong Hu and Zuoming Zhang were in charge of the manuscript authorization. Jin Ma participated in the statistical analysis.
Wendong Hu obtained funding. Xiwen Liu and Zuoming Zhang provided technical or material support. Wendong Hu and Zuoming Zhang served as principle investigators. Wenqiang Han recruited subjects and performed heart rate test.
Conflicts of interest:None declared.
Funding:This study was supported by the National Natural Science Foundation of China (Real time monitoring model study of work ability status of flying personnel), No. 60879007.
Ethical approval:Subjects voluntarily participated in this experiment and signed informed consents.
[1]Levine J M, Karras L. Effects of alcohol on human accommodation. Aviat Space Environ Med. 1977;48:612-616.
[2]Marsden G, Leach J. Effects of alcohol and caffeine on maritime navigational skills. Ergonomics. 2000;43:17-26.
[3]Modell JG, Moints JM. Drinking and flying- the problem of alcohol use by pilots. New Engl J Med. 1990;23:455-461.
[4]Moskowitz H, Fiorentino D. A review of the literature on the effects of low doses of alcohol on driving-related skills. Final Report,NHTSA, DOT HS 809 028. 2000.
[5]Seehafer RW, Huffman WE, Kinizie MD. Effects of low level blood alcohol concentration on psychophysical and personality measures under controlled driving conditions. Natl Safety Con Trans. 1986;23:100-107.
[6]Smith FJ, Harrise D. The effects of low blood alcohol levels on pilot’s prioritization of tasks during a radio navigation task. Int J Aviat Psych. 1994;4:349-358.
[7]Billings CE, Denosthernes RL, White TR, et al. Effects of alcohol on pilot performance in simulated flight. Aviat Space Environ Med.1991;62:233-235.
[8]Colin A. Graham. Alcohol and drug addiction: An emergency department perspective. Clin Eff Nurs. 2006;9S3:e260-268.
[9]Daniela I. Analysis of pupil fluctuations after a light stimulus by image processing and neural network. Comput Math Appl. 2007;53:1260-1270.
[10]Burton RR, Jaggars JL. Influence of ethyl alcohol ingestion on a target task during sustained +Gz centrifugation. Aerosp Med.1974;45:290-296.
[11]Finnigan F, Hammersley R. The effects of alcohol on performance.In: Smith AP, Jones DM, eds. Handbook of Human Performance.London: Academic Press. 1992;2:73-125.
[12]Herbert MJ, Jaynes WE. Performance decrement in vehicle driving. J Eng Psychol. 1964;3:1-8.
[13]Kim H, Yang CS, Lee BW, et al. Effects of alcohol intoxication on ship operational ability using ship handling simulator. In:Proceedings of the International Conference on Human Factors in Ship Design. 2005.
[14]Newman G. Alcohol and human performance from an aviation perspective: a review. Technical Report, Australian Transport Safety Bureau. 2000.
[15]Mushkudiani NA, Hukkelhoven CW, Hernández AV, et al. A systematic review finds methodological improvements necessary for prognostic models in determining traumatic brain injury outcomes. J Clin Epidemiol. 2008;61:331-343.
[16]Franzen PL, Buysse DJ, Dahl RE, et al. Sleep deprivation alters pupillary reactivity to emotional stimuli in healthy young adults.Biol Psychol. 2009;80:300-305.
[17]Ross LE, Yeazel LM, Chau AW. Pilot performance with blood alcohol concentrations below 0.04%. Aviat Space Environ Med.1992;63:951-956.
[18]Ryan LC, Mohler SR. Intoxicating liquor and the general aviation pilot in 1971. Aerosp Med. 1972;43:1024-1026.
[19]Howland J, Rohsenow DJ, Cote J, et al. Effects of low-dose alcohol exposure on simulated merchant ship piloting by maritime cadets. Accid Anal Prev. 2001;33:257-265.
杂志排行
中国神经再生研究(英文版)的其它文章
- Establishment of a beagle dog model of oculomotor nerve injury**★
- Expression of cyclinD1 in a rat model of oxygeninduced retinopathy☆
- Effect of Zhutan Tongluo Tang on fibrinolytic activity following intracerebral hemorrhage in rats*★
- Xuefuzhuyu decoction and astragalus prevent hypoxic-ischemic brain injury*★
- Effect of Yiqi Bushen prescription on hippocampal neuronal apoptosis in diabetic rats***☆
- Triptolide protects astrocytes from hypoxia/reoxygenation injury**★