Effects of suppressing glucose transporter-1 by an antisense oligodeoxynucleotide on the growth of human hepatocellular carcinoma cells
2011-07-07TianQiLiuJunFanLinZhouandShuSenZheng
Tian-Qi Liu, Jun Fan, Lin Zhou and Shu-Sen Zheng
Hangzhou, China
Effects of suppressing glucose transporter-1 by an antisense oligodeoxynucleotide on the growth of human hepatocellular carcinoma cells
Tian-Qi Liu, Jun Fan, Lin Zhou and Shu-Sen Zheng
Hangzhou, China
BACKGROUND:The glucose transporter-1 (Glut-1), a key ratelimiting factor in the transport and metabolism of glucose in cancer cells, is over-expressed in many human cancer cells and this over-expression is correlated with poor biological behavior. The increased levels of Glut-1 expression in hepatocellular carcinoma (HCC) cells functionally affect tumorigenicity. This study was undertaken to investigate effects of suppressing Glut-1 by an antisense oligodeoxynucleotide (AS-ODN) on the growth of human hepatocellular carcinoma (HepG-2) cells.
METHODS:We used AS-ODN targeting against the Glut-1 gene in a HepG-2 cell line. There were four experimental groups: empty pcDNA3.1 vector (mock transfection), pcDNA3.1-anti-Glut (+), pcDNA3.1-Glut (+), and non-transfected HepG-2 cells. The Glut-1 mRNA expression was detected by RT-PCR and the Glut-1 protein expression by Western blotting after cell culture, and the glucose uptake was detected after glucose stimulation in each group.
RESULTS:Compared with non-transfected HepG-2 or Glut-1 pcDNA3.1, a down-regulation of Glut-1 mRNA in HepG-2 cells transfected with anti-Glut-1 pcDNA3.1 was noted (P<0.05). Glut-1 protein in HepG-2 cells transfected with Glut-1 AS-ODN was decreased compared with nontransfected HepG-2, Glut-1 pcDNA3.1, or empty vectors. Glucose uptake by the HepG-2 cells transfected with ASODN was decreased at 1 hour after glucose stimulation.
CONCLUSIONS:The application of Glut-1 AS-ODN can downregulate the expression of Glut-1 at mRNA and protein, and inhibit glucose uptake partially in HepG-2 cells. The Glut-1 gene maybe a potential therapeutic target for HCC.
(Hepatobiliary Pancreat Dis Int 2011; 10: 72-77)
hepatocellular carcinoma; HepG-2 cell; glucose transporter-1; therapeutic target
Introduction
Hepatocellular carcinoma (HCC) is one of the most common and lethal primary malignant tumors worldwide.[1,2]Both the incidence and mortality rate of HCC have increased in recent years.[3-5]Since the 1990s, HCC has been the second highest mortality due to cancer in China.[6]Because most patients are diagnosed at advanced stages, outcomes are usually poor.[7]Some of these HCC patients may be treated by liver transplantation with satisfactory results at our department,[8,9]most lose the chance for treatment because of lack of available and timely donor organs.[4]Thus, new and effective treatments are needed for HCC, and suppression of the energy supply of malignant tumors is an attractive possibility.[1,10]
Many studies have revealed that malignant tumor cells exhibit increased glucose uptake.[11-13]This phenomenon has been demonstrated using18F-labeled 2-fluoro-2-deoxy-D-glucose positron emission tomography (18F-FDGPET).[14,15]The glucose transporter-1 (Glut-1) is a key rate-limiting factor in the transport and metabolism of glucose in cancer cells.[16]Many studies have also shown a significant correlation between FDG levels and Glut-1 mRNA or Glut-1 protein levels.[17-19]Glut-1 is over-expressed in many human cancer cells;[16,17,20]this over-expression is correlated with poor biological behavior.[17,20,21]In HCC, strong and increased expression of Glut-1 mRNAhas been found in HCC.[22,23]However, the biological significance of Glut-1 expression in HCC remains unclear.[22-25]Amann et al[1,22]found that increased Glut-1 expression levels in HCC cells functionally affected tumourigenicity, and they proposed Glut-1 as an innovative therapeutic target for this highly aggressive tumor. One study demonstrated the inhibition of Glut-1 expression in HCCin vitroby siRNA,[22]and another showed the inhibition of Glut-1 expression in HCC by using the antisense oligodeoxynucleotide (AS-ODN).[26]AS-ODN is a single-stranded DNA that is complementary to specific regions of mRNA and is capable of inhibiting the anti-apoptotic gene.[27]Some reports suggest that ASODN, against Glut-1 expression could inhibit the growth of human tumor cells.[28,29]
In the present study, we used AS-ODN targeted against the Glut-1 gene to investigate the effects of suppressing Glut-1 by an AS-ODN on the growth of human HCC HepG-2 cells.
Methods
Agents and primers
The HCC HepG-2 cell line was purchased from the Cell Research Institute of the Chinese Academy of Sciences (Shanghai, China). The pcDNA3.1 vectors, restriction endonucleases HindIII and XbaI, and T4-RNA ligase were purchased from Takara Co. (Japan). The PCR Kit was from Shanghai Zhijiang Biotech Co. (China). Primers were synthesized by Shanghai Dingan Co. (China). The primary antibody Glut-1 was purchased from Santa Cruz Biotechnology. The secondary antibodies, donkey anti-rabbit, donkey anti-mouse, and cell lysis reagents were purchased from Pierce Co. (USA). The Supersignal West Femto kit was purchased from Pierce Co. (USA). The sequence of the entire coding region of Glut-1 was searched from GenBank, and primers were designed using the Clustalx and Omiga 2.0 software (Table 1).
Preparation of Glut-1 AS-ODN
The construction of the pcDNA3.1 Glut-1 antisense and sense vectors has been described previously.[29]Briefly, total RNA was isolated from HepG-2 cells. RTPCR was used to generate Glut-1 complementary DNA (cDNA) from total RNA (800 ng). The product of the anti-Glut-1 or Glut-1 pcDNA3.1 vector was digested with HindIII and XbaI, and cDNA was extracted from an agarose gel. After digestion, the cDNA was then subcloned into the vector pcDNA3.1 with T4-DNA ligase overnight. The linked products were named pcDNA3.1-anti-Glut (+) and pcDNA3.1-Glut (+). The transforming mixture was selected on an LB agar plates with ampicillin (100 mg/L). To confirm positive clones, the recombinant plasmids pcDNA3.1-anti-Glut (+) and pcDNA3.1-Glut (+) were digested with HindIII and XbaI. Then, the sequences of the amplified PCR products were verified.
Cell culture
HepG2 cells were cultured in Dulbecco's modified Eagle's medium (DMEM) (Gibco BRL, Gaithersburg, MD, USA) supplemented with 10% fetal bovine serum (FBS, Hyclone, Logan, UT), 100 kU/L penicillin, and 100 kU/L streptomycin under standard conditions in humidified 5% CO2and air mixture at 37 ℃. As previously described, the cells were trypsinized and harvested when they reached a confluency of 80%-90%.[27]
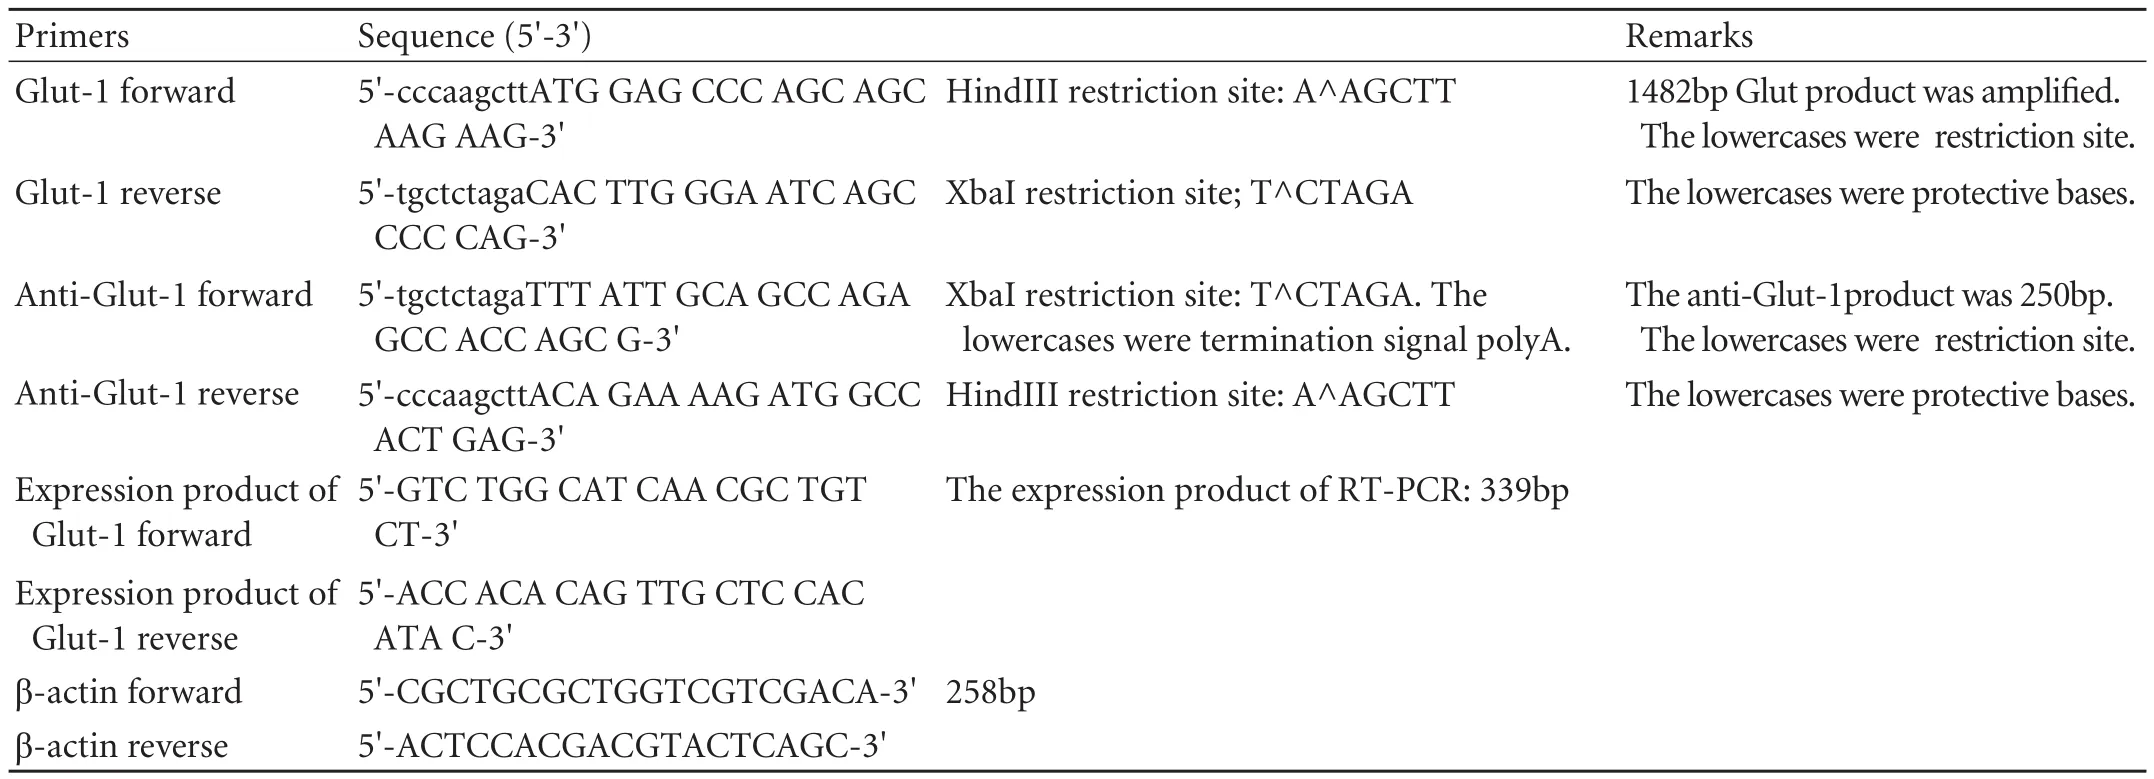
Table 1. Primers
Cell transfection and identification
There were four experimental groups: empty pcDNA3.1 vector (mock transfection), pcDNA3.1-anti-Glut (+), pcDNA3.1-Glut (+), and non-transfected HepG-2 cells. The day before transfection, HepG-2 cells were seeded in 6-well plates at a density of 4×10⁴cells/well. Empty pcDNA3.1 vectors (mock transfection), pcDNA3.1-anti-Glut (+), or pcDNA3.1-Glut (+) was transfected into HepG-2 cells using the Lipofectamine 2000 reagent (Invitrogen Co., Ltd., USA). Each group had three wells/plate, according to the manufacturer's protocol, and the medium was replaced with 1200 μg/ml G418 medium at 24 hours after transfection. The cells in two of three non-transfected wells were cultured in G418-selective medium. The medium was then replaced every 2 days until it was full of transfected cells in each of the 6-well plates. After cultured cells were propagated to passage 25, the collected transfected cells were characterized by PCR. Briefly, DNA from each group was extracted using a DNA extraction kit (Tiangen Biotech, DP304), according to the manufacturer's protocol. Extracted DNA (4 μl) was amplified by PCR in a 40-μl reaction volume. The reaction volume included 10× buffer (4 μl), 10 mmol dNTP polymerase (0.8 μl), 25 mmol MgCl2(3.2 μl), 5 U Taq DNA polymerase (0.3 μl), template (4 μl), upstream and downstream specific primers (0.5 μl), and deionized water (26.7 μl). The parameters of the PCR cycles were as follows.
Identification of Glut-1 pcDNA3.1
Samples were pre-denatured at 94 ℃ for 180 seconds, and then subjected to 35 cycles of denaturation at 94 ℃ for 20 seconds, annealing at 61 ℃ for 20 seconds, and extension at 72 ℃ for 90 seconds, followed by a final extension at 72 ℃ for 10 minutes and cooling at 4 ℃ for 5 minutes. The PCR products were separated by electrophoresis on a 2% agarose gel stained with ethidium bromide to visualize the bands.
Identification of anti-Glut-1 pcDNA3.1
Samples were pre-denatured at 94 ℃ for 180 seconds, and then subjected to 35 cycles of denaturation at 94 ℃ for 20 seconds, annealing at 57 ℃ for 20 seconds, and extension at 72 ℃ for 30 seconds, followed by a final extension at 72 ℃ for 10 minutes and cooling at 4 ℃ for 5 minutes. The PCR products were separated by electrophoresis on a 2% agarose gel stained with ethidium bromide to visualize the bands.
Detection of Glut-1 mRNA expression by RT-PCR
Total RNA was isolated from the cells of each group using the Trizol reagent (GIBCO). The concentration of total RNA was measured by UV spectrophotometry; an OD260/280ratio between 1.8 and 2.0 was considered acceptably pure.
Reverse transcription reaction
Total RNA (2 μg) was extracted and reversetranscribed to cDNA in a 20-μl reaction volume consisting of 5× RT buffer (4 μl), 2.5 μmol oligo d(T), 5 mmol dNTP, and 20 U RNAasin. The reaction mixature was first pre-denatured at 65 ℃ for 5 minutes. After the addition of 200 U M-MLV reverse transcriptase (Promega), the samples were incubated at 42 ℃ for 1 hour and annealed at 72 ℃ for 10 minutes.
PCR reaction
The above product was amplified by PCR in a 40-μl reaction volume consisting of 10× buffer (4 μl), 10 μmol dNTP (0.8 μl), 25 mmol MgCl2(3.2 μl), 5 U Taq DNA polymerase (0.3 μl), template (4 μl), upstream and downstream specific primers (0.5 μl), and deionized water (25.7 μl). The reaction mix was first denatured at 94 ℃ for 3 minutes, followed by 30 cycles at 94 ℃for 20 seconds, 57 ℃ for 20 seconds, and 72 ℃ for 30 seconds, and a final extension period at 72 ℃ for 10 minutes and cooling at 4 ℃ for 5 minutes. RT-PCR products were visualized by agarose gel electrophoresis with ethidium bromide staining, and the band density ratio of the target gene to the β-actin gene was used for semiquantitative evaluation.
Detection of Glut-1 protein expression by Western blotting
The Glut-1 protein in each group of HepG-2 cells was measured using a BAC protein quantitative kit (Wuhan Boster Biological Technology Co. Ltd., China). Briefly, protein (80 μg) was subjected to polyacrylamide gel electrophoresis (SDS-PAGE) and then transferred onto a nitrocellulose membrane (Millipore, Billerica, MA, USA). Skimmed milk (2%) was used as a blocking solution (room temperature, 1 hour). The membrane was incubated with the primary antibody (Glut-1, 1∶3000) at room temperature for 3 hours and the secondary antibody (1∶5000 donkey anti-rabbit, 1∶5000 donkey anti-mouse) at room temperature for 1 hour. The proteins were detected using an enhanced chemiluminescence (ECL) system (Santa Cruz, USA) and were exposed to X-ray film. Protein expression was semi-quantitatively analyzed using the Kodak Gel Logic Analysis System.
Glucose stimulation experiment
In each group, HepG-2 cells were seeded in 6-well plates; each group had three wells/plates. After a 24-hour incubation, 20 mmol glucose was added to begin the glucose stimulation test, as described previously.[29]After incubation for 1 hour, cell culture supernatants were collected.
Glucose uptake from the culture medium was determined using a detection kit (Shanghai Kehua Biotech, China). The glucose uptake in the supernatant of HepG-2 cells was calculated as follows:
Concentration of glucose uptake (mmol)=concentration of glucose stimulation (mmol)+glucose concentration of medium-concentration of glucose in supernatant (mmol).
Statistical analysis
The data were analyzed using the SPSS software (Version 16.0). The data are presented as mean± standard deviation (SD). The independent sample t-test was used to determine the P value. A P value less than 0.05 was considered statistically significant.
Results
Characterization of transfected HepG-2 cells
The band of the Glut-1 product (1482bp) was found only in the Glut-1 pcDNA3.1 group, demonstrating the successful transfection of the plasmid of Glut-1 pcDNA3.1 into the HepG-2 cells (Fig. 1A). A specific band of the anti-Glut-1 product (250bp) was detected by PCR in the anti-Glut-1 pcDNA3.1 group, demonstrating the successful transfection of the anti-Glut-1 pcDNA3.1 plasmid into the HepG-2 cells (Fig. 1B).
Inhibition of Glut-1 mRNA expression in HCC HepG-2 cells
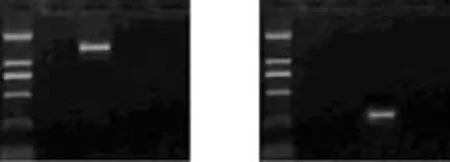
Fig. 1. A specific band of the Glut-1 product in the Glut-1 pcDNA3.1 group. The size was 1482bp, and other groups did not show specific bands (A). A specific band of the anti-Glut-1 product was detected by PCR in the anti-Glut-1 pcDNA3.1 group. Its size was 250bp, and other groups showed non-specific bands (B). M: marker; 1. untransfected HepG-2 cell; 2. Glut-1 pcDNA3.1; 3. anti-Glut-1 pcDNA3.1; 4. empty vector.
A down-regulation of Glut-1 mRNA was noted in HepG-2 cells transfected with anti-Glut-1 pcDNA3.1 compared with non-transfected HepG-2 or Glut-1 pcDNA3.1 (P<0.05; Table 2, Fig. 2). Compared with empty vectors, however, Glut-1 mRNA in HepG-2 cells transfected with the anti-Glut-1 pcDNA3.1 was not decreased.

Table 2. Glut-1 mRNA expression(relative to β-actin)
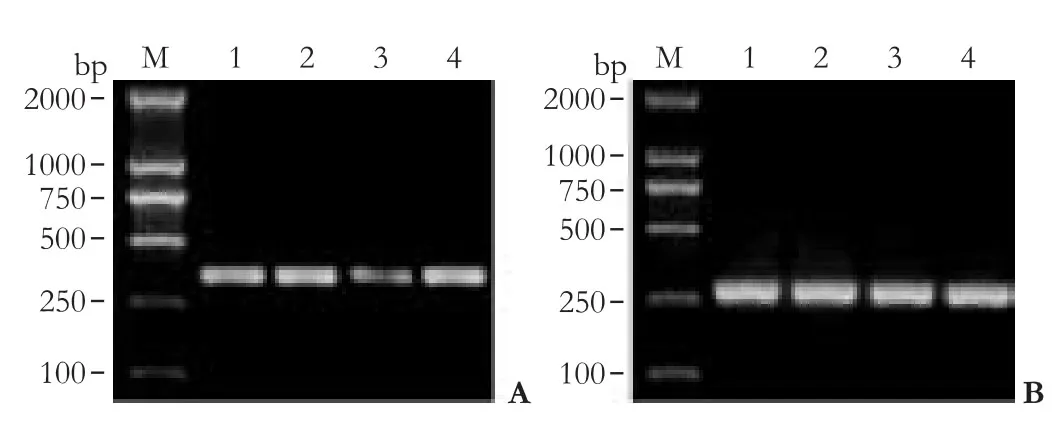
Fig. 2. Glut-1 mRNA expression in HCC HepG-2 cells. A: RTPCR revealed down-regulation of Glut-1 mRNA in HepG-2 cells transfected with anti-Glut-1 pcDNA3.1 compared with non- or mock-transfected HepG-2 or Glut-1 pcDNA3.1 (P<0.05). B: β-actin expression in HCC HepG-2 cells. M: marker; 1. untransfected HepG-2 cell; 2. Glut-1 pcDNA3.1; 3. anti-Glut-1 pcDNA3.1; 4. empty vector.
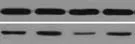
Fig. 3. Glut-1 protein expression in HCC HepG-2 cells. Western blotting showed down-regulation of Glut-1 protein in HepG-2 cells transfected with anti-Glut-1 pcDNA3.1 compared with non- or mock-transfected HepG-2 or Glut-1 pcDNA3.1. 1: Non-transfected HepG-2; 2: Glut-1 pcDNA3.1; 3: anti-Glut-1 pcDNA3.1; 4: empty vector.

Fig. 4. Compared with non-transfected HepG-2 cells, glucose uptake by HepG-2 cells transfected with antisense Glut-1 was decreased 1 hour after glucose stimulation.
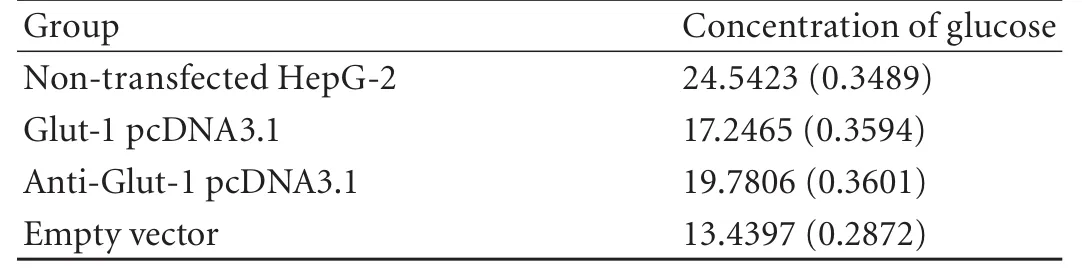
Table 3. Concentration of glucose in supernatant of HepG-2 cell
Effects of anti Glut-1 on Glut-1 protein in HCC HepG-2 cells
The Glut-1 protein in HepG-2 cells transfected with Glut-1 AS-ODN was decreased compared with nontransfected HepG-2, Glut-1 pcDNA3.1, or empty vectors (Fig. 3).
Detection of glucose uptake
Compared with HepG-2 cells transfected plasmid Glut-1 pcDNA3.1 or empty vectors, glucose uptake by HepG-2 cells transfected with antisense Glut-1 was decreased 1 hour after glucose stimulation. However, compared with nontransfected HepG-2 cells, glucose uptake by HepG-2 cells transfected with antisense Glut-1 did not decrease 1 hour after glucose stimulation (Fig. 4, Table 3).
Discussion
Previously we found that Glut-1 is highly expressed in head and neck cancer[16]and that there is a significant correlation between Glut-1 expression and FDG (fluorodeoxyglucose) uptake.[17]Further, we investigated the inhibition of Glut-1 expression in laryngeal carcinoma Hep-2 cells by AS-ODN and found that it may reduce glucose uptake and inhibit proliferation of laryngeal carcinoma cells.[29]These findings suggest that Glut-1 is a potential therapeutic target for head and neck cancer. Are the same Glut-1 results found in other malignant tumors? In the present study, we analyzed Glut-1 expression in HCC HepG-2 cells and explored the effect of antisense Glut-1 on Glut-1 expression and glucose uptake in HepG-2 cells.
Glut-1 expression is increased in many carcinomas and is associated with a poor prognosis[19,21,30-32]although its mechanism is not fully understood. However, Glut-1 expression in HCC is controversial.[22-25]Studies were performed only in a small number of cases,[1,22]focusing on Glut-1 mRNA and protein expression in 152 HCC. Increased expression of Glut-1 mRNA and protein was found in all HCC cell lines, suggesting that increased Glut-1 expression functionally affected proliferation and invasiveness of HCC cells.[22]Thus, Glut-1 was proposed as a therapeutic target for HCC. In early 2002, Chen et al[26]found that conjugate targeting to Glut-1 showed up to 50% inhibition of cell proliferation in HepG-2 and MCF-7 cells.
In this study, we successfully transfected Glut-1 ASODN in HCC HepG-2 cells. RT-PCR revealed downregulation of Glut-1 mRNA in HepG-2 cells transfected with anti-Glut-1 pcDNA3.1, compared with nontransfected HepG-2 or Glut-1 pcDNA3.1. Glut-1 ASODN may inhibit the expression of Glut-1 mRNA similar to previous reports that Glut-1 mRNA decreased the growth of a gastric cancer cell line,[28]a human rhabdomyosarcoma cell line RD,[33]and leukemia HL-60 cells,[34]and suppressed the transforming phenotype of NIH 3T3 cells.[35]Compared with empty vectors, however, Glut-1 mRNA in HepG-2 cells transfected with anti-Glut-1 pcDNA3.1 was not decreased. This finding is different from other reports.[28,33-35]In our study, we only detected Glut-1 mRNA expression one hour after incubation so that the time of plasmid transfection affected the results. Thus further research on HCC is required. In laryngeal carcinoma HepG-2 cells, the degree of suppression was the highest 0.5 hour after stimulation with 10 mmol glucose. After an additional 24 hours, Glut-1 mRNA recovered to normal levels, which may reflect degradation of antisense molecules within the cells.[29]Generally, Glut-1 mRNA suppression should lead to a decline in the corresponding protein expression, as was found in our study (Fig. 3). Glut-1 AS-ODN may decrease glucose uptake in HepG-2 cells, and Glut-1 plays a role in glucose uptake by HepG-2 cells. However, compared with HepG-2 cells transfected with non-transfected HepG-2 cells, the glucose uptake of HepG-2 cells transfected with antisense Glut-1 did not decrease one hour after glucose stimulation. The effect of Glut-1 AS-ODN may be time-dependent. In the present study, we only detected Glut-1 mRNA expression one hour after transfection.
In conclusion, the application of Glut-1 AS-ODN can down-regulate the expression of Glut-1 at mRNA and protein, and inhibit glucose uptake partially in HepG-2 cells. Glut-1 gene maybe a potential therapeutic target for HCC.
Funding:None.
Ethical approval:Not needed.
Contributors:ZSS proposed the study. ZSS and LTQ wrote the first draft. LTQ analyzed the data. All authors contributed to the design and interpretation of the study and to further drafts. ZSS is the guarantor.
Competing interest:No benefits in any form have been received or will be received from a commercial party related directly or indirectly to the subject of this article.
1 Amann T, Hellerbrand C. GLUT1 as a therapeutic target inhepatocellular carcinoma. Expert Opin Ther Targets 2009;13: 1411-1427.
2 El-Serag HB. Hepatocellular carcinoma: recent trends in the United States. Gastroenterology 2004;127:S27-34.
3 Jemal A, Siegel R, Ward E, Hao Y, Xu J, Murray T, et al. Cancer statistics, 2008. CA Cancer J Clin 2008;58:71-96.
4 Jemal A, Siegel R, Ward E, Hao Y, Xu J, Thun MJ. Cancer statistics, 2009. CA Cancer J Clin 2009;59:225-249.
5 Jemal A, Siegel R, Xu J, Ward E. Cancer statistics, 2010. CA Cancer J Clin 2010;60:277-300.
6 Yang L, Parkin DM, Ferlay J, Li L, Chen Y. Estimates of cancer incidence in China for 2000 and projections for 2005. Cancer Epidemiol Biomarkers Prev 2005;14:243-250.
7 Rampone B, Schiavone B, Confuorto G. Current management of hepatocellular cancer. Curr Oncol Rep 2010;12:186-192.
8 Zheng SS, Xu X, Wu J, Chen J, Wang WL, Zhang M, et al. Liver transplantation for hepatocellular carcinoma: Hangzhou experiences. Transplantation 2008;85:1726-1732.
9 Xu X, Zheng SS, Liang TB, Wang WL, Jin J, Shen Y, et al. Orthotopic liver transplantation for patients with hepatocellular carcinoma complicated by portal vein tumor thrombi. Hepatobiliary Pancreat Dis Int 2004;3:341-344.
10 Xu RH, Pelicano H, Zhou Y, Carew JS, Feng L, Bhalla KN, et al. Inhibition of glycolysis in cancer cells: a novel strategy to overcome drug resistance associated with mitochondrial respiratory defect and hypoxia. Cancer Res 2005;65:613-621.
11 Warburg O. On the origin of cancer cells. Science 1956;123: 309-314.
12 Kim JW, Dang CV. Cancer's molecular sweet tooth and the Warburg effect. Cancer Res 2006;66:8927-8930.
13 Brahimi-Horn MC, Chiche J, Pouysségur J. Hypoxia signalling controls metabolic demand. Curr Opin Cell Biol 2007;19:223-229.
14 Miura Y, Tsudo M. Fluorodeoxyglucose-PET/CT for diagnosis of intravascular large B-cell lymphoma. Mayo Clin Proc 2010;85: e56-57.
15 Prante O, Maschauer S, Fremont V, Reinfelder J, Stoehr R, Szkudlinski M, et al. Regulation of uptake of 18F-FDG by a follicular human thyroid cancer cell line with mutationactivated K-ras. J Nucl Med 2009;50:1364-1370.
16 Zhou S, Wang S, Wu Q, Fan J, Wang Q. Expression of glucose transporter-1 and -3 in the head and neck carcinoma--the correlation of the expression with the biological behaviors. ORL J Otorhinolaryngol Relat Spec 2008;70:189-194.
17 Li LF, Zhou SH, Zhao K, Wang SQ, Wu QL, Fan J, et al. Clinical significance of FDG single-photon emission computed tomography: Computed tomography in the diagnosis of head and neck cancers and study of its mechanism. Cancer Biother Radiopharm 2008;23:701-714.
18 Taylor MD, Smith PW, Brix WK, Wick MR, Theodosakis N, Swenson BR, et al. Correlations between selected tumor markers and fluorodeoxyglucose maximal standardized uptake values in esophageal cancer. Eur J Cardiothorac Surg 2009;35:699-705.
19 Robey IF, Stephen RM, Brown KS, Baggett BK, Gatenby RA, Gillies RJ. Regulation of the Warburg effect in early-passage breast cancer cells. Neoplasia 2008;10:745-756.
20 Demasi AP, Costa AF, Altemani A, Furuse C, Araújo NS, Araújo VC. Glucose transporter protein 1 expression in mucoepidermoid carcinoma of salivary gland: correlation with grade of malignancy. Int J Exp Pathol 2010;91:107-113.
21 Endo M, Tateishi U, Seki K, Yamaguchi U, Nakatani F, Kawai A, et al. Prognostic implications of glucose transporter protein-1 (glut-1) overexpression in bone and soft-tissue sarcomas. Jpn J Clin Oncol 2007;37:955-960.
22 Amann T, Maegdefrau U, Hartmann A, Agaimy A, Marienhagen J, Weiss TS, et al. GLUT1 expression is increased in hepatocellular carcinoma and promotes tumorigenesis. Am J Pathol 2009;174:1544-1552.
23 Zhao S, Kuge Y, Mochizuki T, Takahashi T, Nakada K, Sato M, et al. Biologic correlates of intratumoral heterogeneity in 18F-FDG distribution with regional expression of glucose transporters and hexokinase-II in experimental tumor. J Nucl Med 2005;46:675-682.
24 Paudyal B, Paudyal P, Oriuchi N, Tsushima Y, Nakajima T, Endo K. Clinical implication of glucose transport and metabolism evaluated by 18F-FDG PET in hepatocellular carcinoma. Int J Oncol 2008;33:1047-1054.
25 Zimmerman RL, Fogt F, Burke M, Murakata LA. Assessment of Glut-1 expression in cholangiocarcinoma, benign biliary lesions and hepatocellular carcinoma. Oncol Rep 2002;9:689-692.
26 Chen CP, Li XX, Zhang LR, Min JM, Chan JY, Fung KP, et al. Synthesis of antisense oligonucleotide-peptide conjugate targeting to GLUT-1 in HepG-2 and MCF-7 Cells. Bioconjug Chem 2002;13:525-529.
27 WeiXing C, Tiantian H, Qun N, Chaohui Y, Ping X. Inhibitory effect of hypoxia inducible factor-1 antisense oligonucleotide on growth of human hepatocellular carcinoma cells. Med Oncol 2008;25:88-92.
28 Noguchi Y, Saito A, Miyagi Y, Yamanaka S, Marat D, Doi C, et al. Suppression of facilitative glucose transporter 1 mRNA can suppress tumor growth. Cancer Lett 2000;154:175-182.
29 Zhou SH, Fan J, Chen XM, Cheng KJ, Wang SQ. Inhibition of cell proliferation and glucose uptake in human laryngeal carcinoma cells by antisense oligonucleotides against glucose transporter-1. Head Neck 2009;31:1624-1633.
30 Xiong Y, Xiong YY, Zhou YF. Expression and significance of beta-catenin, Glut-1 and PTEN in proliferative endometrium, endometrial intraepithelial neoplasia and endometrioid adenocarcinoma. Eur J Gynaecol Oncol 2010;31:160-164.
31 Ayala FR, Rocha RM, Carvalho KC, Carvalho AL, da Cunha IW, Lourenço SV, et al. GLUT1 and GLUT3 as potential prognostic markers for oral squamous cell carcinoma. Molecules 2010;15:2374-2387.
32 Airley R, Evans A, Mobasheri A, Hewitt SM. Glucose transporter Glut-1 is detectable in peri-necrotic regions in many human tumor types but not normal tissues: Study using tissue microarrays. Ann Anat 2010;192:133-138.
33 Ito S, Fukusato T, Nemoto T, Sekihara H, Seyama Y, Kubota S. Coexpression of glucose transporter 1 and matrix metalloproteinase-2 in human cancers. J Natl Cancer Inst 2002;94: 1080-1091.
34 Chan JY, Kong SK, Choy YM, Lee CY, Fung KP. Inhibition of glucose transporter gene expression by antisense nucleic acids in HL-60 leukemia cells. Life Sci 1999;65:63-70.
35 Choi JW, Yoon DJ, Lee HW, Han DP, Ahn YH. Antisense GLUT1 RNA suppresses the transforming phenotypes of NIH 3T3 cells transformed by N-Ras. Yonsei Med J 1995;36: 480-486.
October 19, 2010
Accepted after revision December 15, 2010
Author Affiliations: Key Laboratory of Combined Multi-organ Transplantation, Ministry of Public Health; Key Laboratory of Organ Transplantation, Zhejiang Province; and Division of Hepatobiliary and Pancreatic Surgery, Department of Surgery (Liu TQ, Zhouland Zheng SS); State Key Laboratory for Diagnosis and Treatment of Infectious Disease (Fan J), First Affiliated Hospital, Zhejiang University School of Medicine, Hangzhou 310003, China; Department of Hepatobiliary Surgery, the People's Hospital of Guangxi Zhuang Autonomous Region, Nanning 530021, China (Liu TQ)
Shu-Sen Zheng, MD, PhD, FACS, Division of Hepatobiliary and Pancreatic Surgery, First Affiliated Hospital, Zhejiang University School of Medicine, Hangzhou 310003, China (Tel: 86-571-87236601; Fax: 86-571-87236601; Email: shusenzheng@zju.edu.cn)
© 2011, Hepatobiliary Pancreat Dis Int. All rights reserved.
杂志排行
Hepatobiliary & Pancreatic Diseases International的其它文章
- Hepatobiliary & Pancreatic Diseases International (HBPD INT)
- Primary hepatic carcinosarcoma
- Aberrant methylation frequency of TNFRSF10C promoter in pancreatic cancer cell lines
- Protective effects of glutamine preconditioning on ischemia-reperfusion injury in rats
- Peroxisome proliferator-activated receptor gamma inhibits hepatic fibrosis in rats
- Hepatocyte differentiation of human fibroblasts from cirrhotic liver in vitro and in vivo