A Comparative Investigation on Optimization of Propeller Blade Section Design
2011-06-22ZENGZhibo
ZENG Zhi-bo
(China Ship Scientific Research Center,Wuxi 214082,China)
A Comparative Investigation on Optimization of Propeller Blade Section Design
ZENG Zhi-bo
(China Ship Scientific Research Center,Wuxi 214082,China)
A method of blade section design optimization for marine propellers with maximum cavitation inception speed is comparatively investigated.The design optimization method consists of three parts:parametric representation of sections,cavitation bucket prediction and Genetic Algorithm(GA)used to search the optimized foils providing excellent cavitation inception performance.The Eppler method,which describes a profile by ten parameters,was effectively utilized for propeller blade section design optimization for maximum inception speed.Besides design parameters in Eppler method,parametric representation of sections can be also realized by control points of B-spline curve.A comparative investigation of blade section design optimization on these two parametric representations is presented,some conclusions are drawn.
blade section design optimization;genetic algorithm;B-spline;Eppler method;comparative investigation
Biography:ZENG Zhi-bo(1980-),male,engineer of CSSRC.
1 Introduction
Cavitation is a key subject of ship propeller design.In many cases,such as for naval ships,it is necessary to delay cavitation inception up to the highest possible ship speed.Traditionally the margin against cavitation is increased by increasing the blade area.However,it leads to thin and wide sections,which reduces the ability of cavitation free when it operates at angle of attack with time dependent varying because of non-uniform wake.Furthermore,increasing blade area reduces propeller efficiency.
For improving the cavitating performance of foil section,Eppler method[1]was proved to be significantly successful to enlarge cavitation bucket of sections and it had been verified by experiments[2].In recent years,more practical design methods of sections based on optimization have been developed[3-4].Zeng and Kuiper[5]developed an optimization technique,using a genetic algorithm to integrate the program of Eppler-Shen,makes Eppler foil design method more accessible and convenient.
In this paper,the optimization technique[5]was adopted to comparatively investigate effects of different parametric representations on optimized sections of propeller.Two parametric representations:design parameters in Eppler method,coordinates of control points of B-spline curve were investigated.The optimization strategy applied genetic algorithms which were processed by means of genetic operators,including crossover,mutation and selection.The objectives derive from a cavitation bucket against an operating curve of a section of a propeller,which consist of pressure sheet cavitation margin,suction sheet cavitation margin and suction bubble cavitation margin.The evaluation of the fitness of objective adopted a two dimensional panel code.
For a specific operating curve of a blade section,a comparative investigation on the two parametric representations in optimization has been carried out.The analysis was presented and some conclusions were drawn.The geometrical differences among the optimized foils based on two parametric representations tell that the significance of each parameter of each representation needs to be studied further.
2 Methodology
Methodology of section design optimization to delay cavitation inception is generally composed of three parts:the first is parametric representation of geometry of sections,the second is prediction of cavitation bucket of foils and the third is optimization tool.
Blade section parameterization is a difficult problem in optimization,which significantly affects optimized results.An ideal parametric representation should be simple and completely extract characteristics of blade section in its parametric space.
Two dimensional panel method is employed to predict the pressure distribution and the cavitation bucket on a foil.Cavitation bucket is defined by the minimum pressure on the foil versus angle of attack or lift coefficient.So after the calculation of the pressure distributions on a foil at a series of angles of attack,the cavitation bucket can be structured.
The optimization was realized with genetic algorithms,available under the iSIGHT 9.0 environment,a product from Engineous Software.
The section design optimization is set up by integrating a parametric representation,a two dimensional panel method and an optimization tool.Fig.1 shows the flow chart.
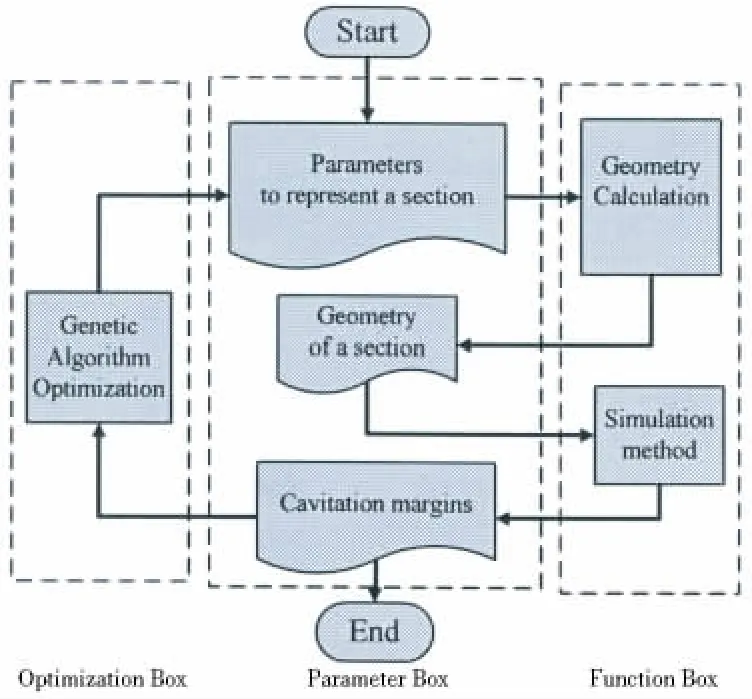
Fig.1 The flow chart of section design optimization
3 Parameteric representations
As mentioned above,blade section parameterization is a worthy studying problem related to a specific optimization object.Two methods were investigated in the present study.
3.1 B-spline
Letting P(t)be the position vector along the curve as a function of the parameter t,a B-spline curve is given by
管沟基础采用中粗砂垫层,厚15~20 cm,砂料含泥量不应大于5%。遇有淤泥时,清淤换土,进行基础换置,使地基承载力达到设计要求。

where Biare the position vectors of the n+1 vertices of the control polygon,and Ni,kare the normalized B-spline basis functions.
Different types of control ‘handles’ are used to influence the shape of B-spline curves,in which changing/adjusting position of the control polygon vertices is the most practical and significant one.
As an usual way,a section of propeller blade is considered as a superposition of a thickness distribution and a camber distribution.In order to make two curves reflect possible characteristics of sections in optimization,the control points of B-spline should be selected reasonably.The control points for thickness and camber can be selected as in Fig.2 and Fig.3,and the coordinates of them are shown in Tab.1 and Tab.2.The thickness is represented by 9 control points and 8 parameters with two points corresponding to the leading edge and trailing edge being fixed:(xt,yt1,yt2,yt3,yt4,ytmax,yt5,yt6).The camber is represented by 8 control points and 7 parameters:(xf,yf1,yf2,yf3,yf4,yfmax,yf5).So there are 15 parameters in total to represent a section in B-spline parametric representation method.
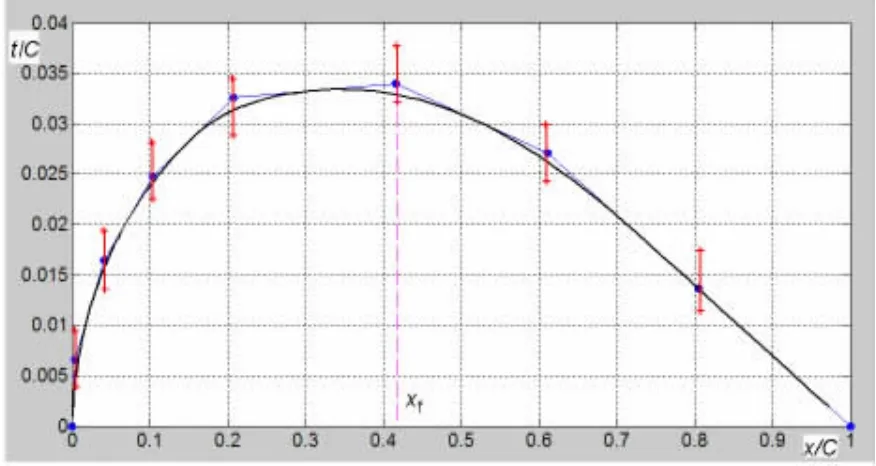
Fig.2 The control points to represent thickness distribution

Fig.3 The control points to represent camber distribution

Tab.1 The control points coordinates for thickness distribution

Tab.2 The control points coordinates for camber distribution
3.2 Eppler method
The program of Eppler-Shen[1]for designing a section can be considered to describe a section by ten parameters as follows[5]:

Fig.4 is segmentation of the section geometry and shows parameters on each segment.In the figure,from φPRto φ1is the main pressure region and α1is the corresponding angle of attack for constant pressure distribution in this region,where φPRis the location of the beginning of the recovery and fixed at 51 degrees,which is the same value as used by Kuiper and Jessup[6];From φ1to φ2,φ2to φ3and φ3to φ4are the sheet cavitation suppression regions,in which φ2is calculated in the program and α2, α3and α4are the corresponding angles of attack in these regions;α5corresponds to the region from φ4to-φ5,in which φ5determines the closure region at the trailing edge and fixed at 24 degrees;The suction pressure recovery region is on the suction side from+φ5to φPR;u and k are used to control the pressure distribution on the suction pressure recovery region.
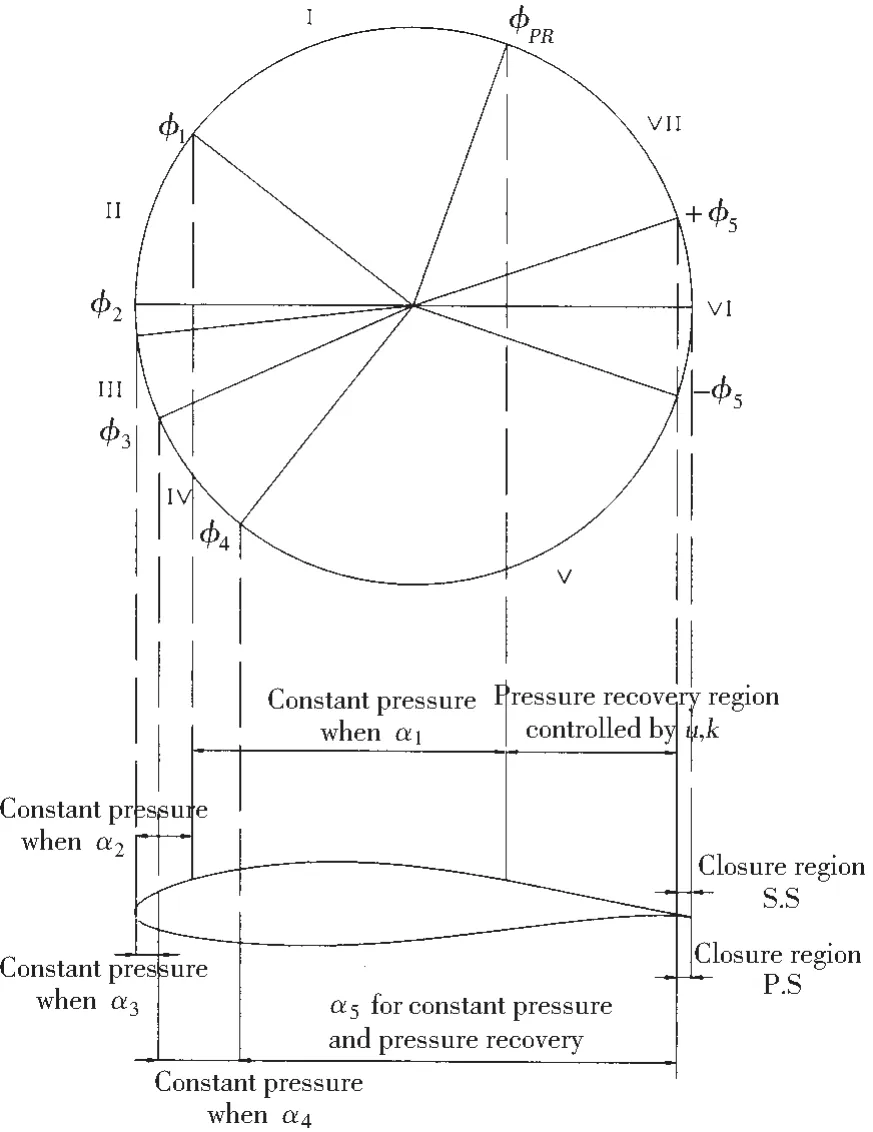
Fig.4 Segmentation of the section geometry
4 Comparative investigation
A comparative investigation on the effects of two parametric representation methods,i.e.B-spline method,and Eppler method on the optimized results is carried out.Each optimization has its own parametric representation but using the same panel method for producing cavitation bucket and the same optimization tool.An operating curve of the section in 0.8R of a propeller working behind DTMB 5415[5]was adopted as example to find the objectives.Fig.5 gives the operating curve and a bucketof NACA66mod+a=0.8 section with a maximum thickness 0.035 and the section is shown in Figs.13~15,it can be seen that the bucket can not envelope the operating curve related to suction sheet cavitation.
4.1 Optimization problem
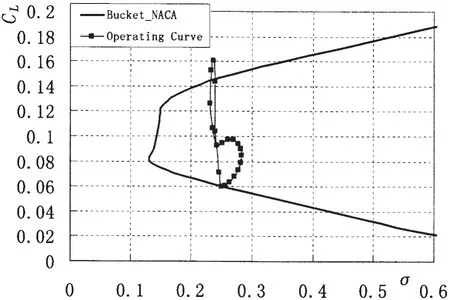
Fig.5 The operating curve and a bucket of NACA66mod+a=0.8 section with a maximum thickness 0.035
The objective of the optimization is to design a section with a cavitation bucket,which envelops the operating curve in Fig.6.The operating curve can be calculated by unsteady panel code.The objective consists of dCLA,dCLBand dσC.The value dCLAis the vertical distance between the cavitation bucket and the lowest point of the operating curve,and gives the margin against pressure side sheet cavitation.The value dCLBis the vertical distance between the cavitation bucket and the highest point of the operating curve,and gives the margin against suction side sheet cavitation.Similarly the value dσCcomes from the minimum horizontal distance between the operating curve and the bucket and it depicts the margin against suction side bubble cavitation.
The optimization problem is formed with a constraint of maximum thickness of foils Tmaxas follows,

where X is combination of parameters,C is a constraint space of parameters,Tlimis the limit of maximum thickness of section.The range of every parameter in each parameter representation method should be firstly specified,which has some effects on the design results.The constraint of maximum thickness Tlimis set as 0.04.
In order to optimize design variables the objectives are translated into one fitness parameter with suitable weight for each of the design objectives.A Genetic Algorithm(GA)optimization method is used to generate a new better population.Optimizations are processed by means of genetic operators,including crossover,mutation and selection.The best solution for a multi-objective optimization problem is often a trade-off,so a Pareto optimum is used instead of finding only one solution.There is a series of feasible and non-dominated solutions in the Pareto and designers can select a suitable one according to practical requirements.
The design optimization is executed in iSIGHT,the features of optimization tool,genetic algorithm,are selected as follows:population size is 20,maximum generations are specified as 25,crossover type is two points and crossover rate is 0.4,mutation rate is set as 0.1.Objective is defined as,


is selected.
4.2 Comparison on the optimization process
The optimization processes with the two parametric representation methods are shown in Fig.7.The figure gives the development of best Objective versus generations.It can be seen that each best Objective is improved with the increasing of generations,however the convergence is significantly different.Eppler method can arrive at minimum value after 5 generations but B-spline method shows a gradually improved process and reaches the minimum Objective in 20 generations.Regarding the minimum Objective,B-spline method and Eppler method have the same value which is close to-0.1.
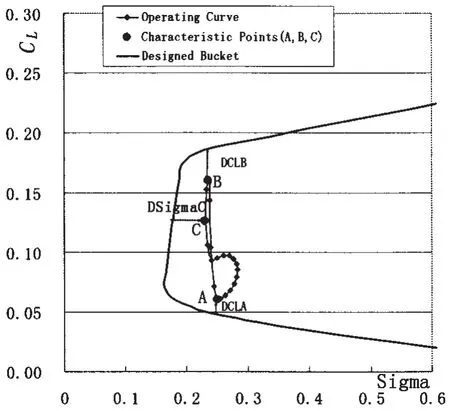
Fig.6 A typical operating curve and cavitation bucket
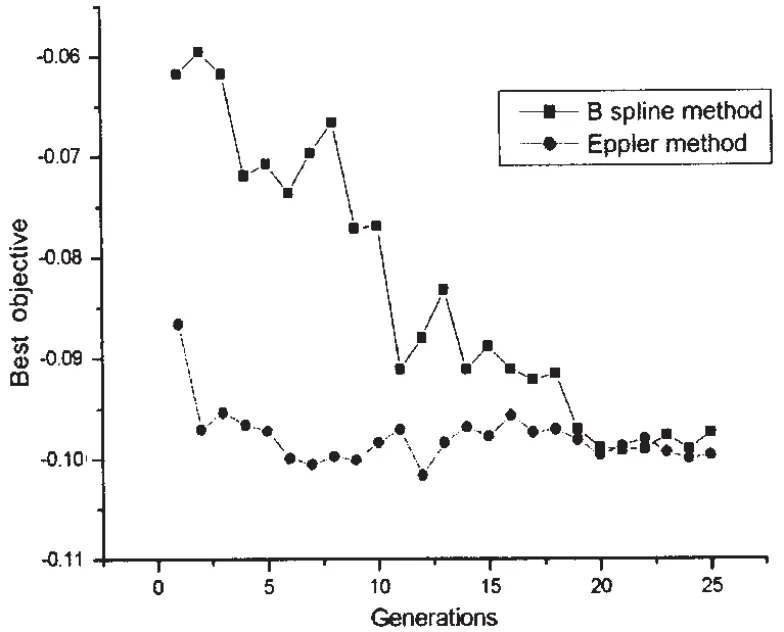
Fig.7 Comparison of the optimization process between B-spline method and Eppler method
4.3 Comparison on the optimization result
The Pareto distribution is used to demonstrate the optimization design results in the multi-objective problem.Figs.8~9 give respectively the Paretos in each method.There are four Paretos:dCLAand dσC;dCLAand dCLB;dCLBand dσC;dσCand Objective.In these figures there are all the individuals in every generation during the process of optimization in which the dark blue dots are the final optimum individuals.For Objective in the two methods,it can be seen from the dark dots that Objective is improved and the minimum values are in the same level;For dσC,Eppler method has the higher level than B-spline method and the value in both methods is larger than 0.For dCLAand dCLB,two methods generate values distributed on the both sides of 0,and B-spline has larger range.dCLAand dCLBhave the obviously con-flictive relationship in B-spline method and dCLAand dσCare conflicting in Eppler method.
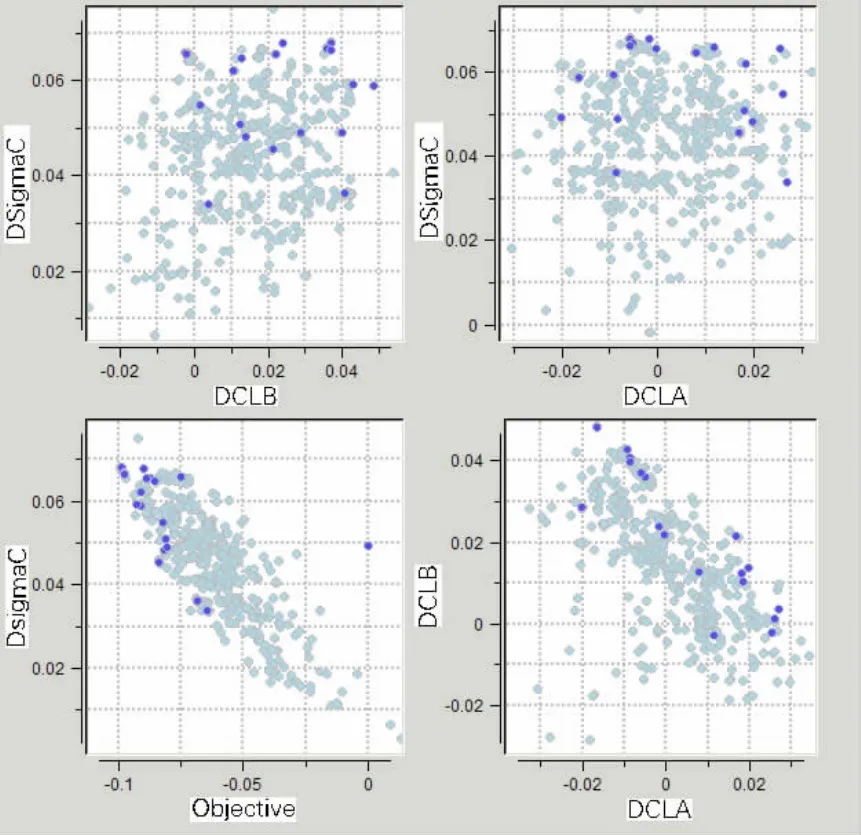
Fig.8 The Pareto:The distribution in the objective space of all the individuals(B-spline method)
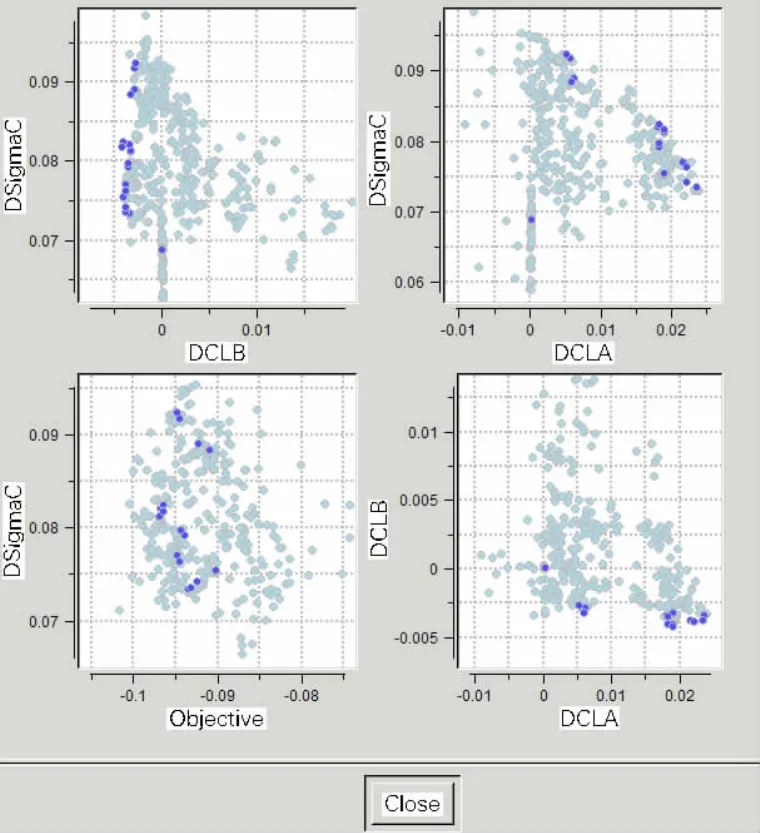
Fig.9 The Pareto:The distribution in the objective space of all the individuals(Eppler method)
In order to distinguish the difference between these two methods,the comparisons on the three cavitation margins in three practical cases were singly carried out.The results are shown in Tab.3.

Tab.3 The results of the comparisons
Case 1:When dCLA≥0.007 and dCLB≥0.013,dσCis 0.065 optimized by B-spline method and 0.074 by Eppler method,which shows Eppler method gives 13.8%better suction bubble cavitation margin than B-spline method due to constant pressure distribution on the main pressure region.The comparison of the two buckets were depicted in Fig.10.The corresponding maximum thickness of Eppler method is 0.038 8 larger than that of B-spline method 0.033 5.
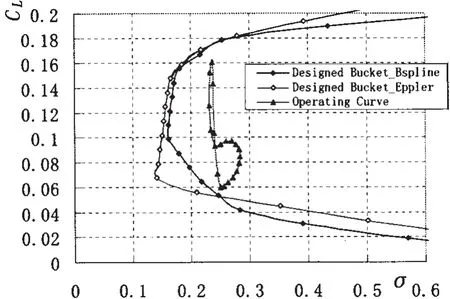
Fig.10 The comparison on suction bubble cavitation margin
Case 2:When dCLA≥0.013 and dσC≥0.06,B-spline method generates dCLB=0.019 and Eppler method generates dCLB=0.017 which is slightly lower.Fig.11 shows the two buckets and their suction sheet cavitation margins are very close.And the maximum thickness in Eppler method is larger than that in B-spline method.
Case 3:When dCLB≥0.09 and dσC≥0.06,dCLAoptimized by the two methods are also very close and the buckets are shown in Fig.12.The maximum thickness in Eppler method is larger than that in B-spline method.
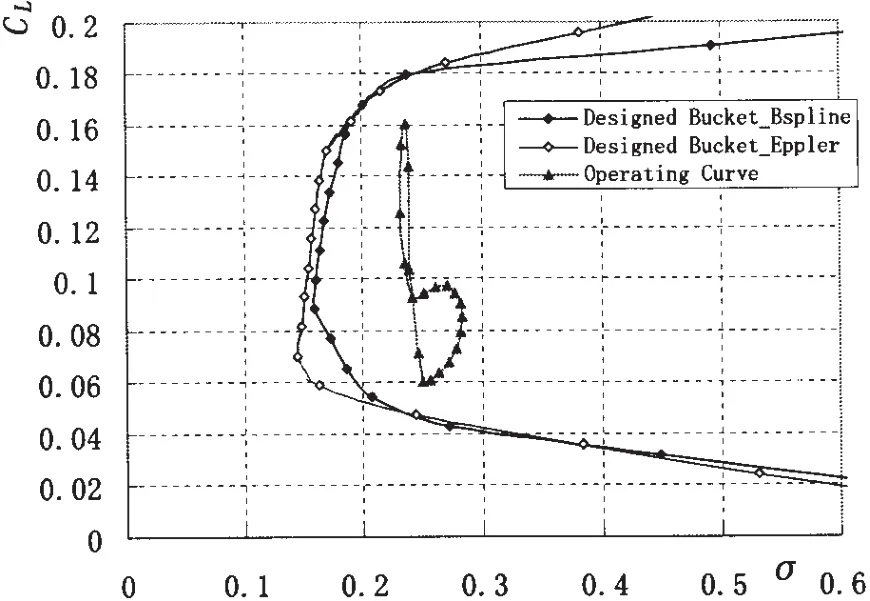
Fig.11 The comparison on suction sheet cavitation margin
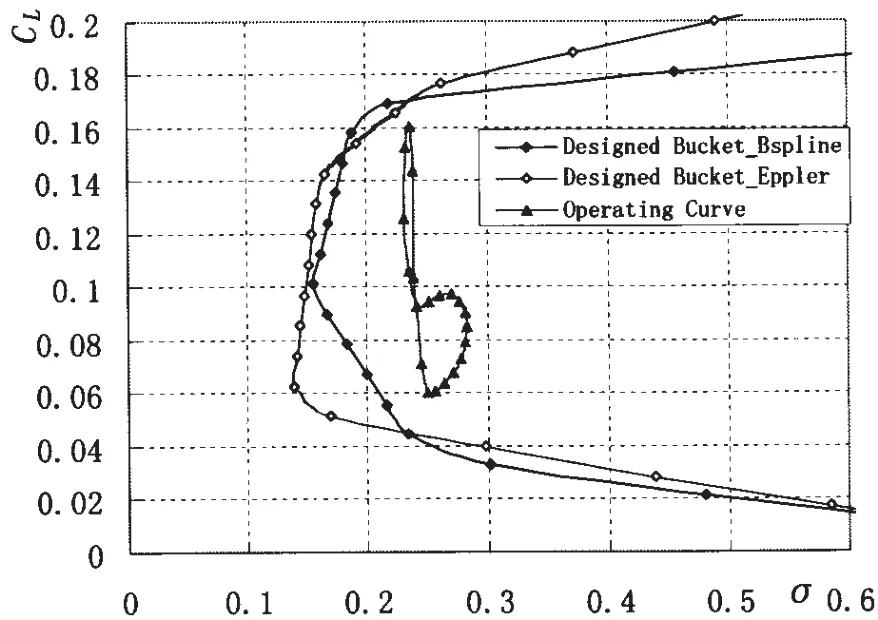
Fig.12 The comparison on pressure sheet cavitation margin
In summary,Eppler method and B-spline method all can optimize sections with considerable buckets.Eppler method can optimize a section with better bubble cavitation margin,and slightly better sheet cavitation margins can be obtained with B-spline method.The maximum thickness of B-spline method is less than that in Eppler method
The sections structured by parametric representation in the above cases are shown in Figs.13~15.The maximum thickness of them is moved towards the leading edge for increasing the margin against sheet cavitation and the maximum camber is moved towards the trailing edge for moving more loads towards the trailing edge in comparison with the NACA66mod+a=0.8 section also shown in these figures.
The geometrical differences among the optimized sections based on the two parametric representations tell that significance of each parameter of each representation needs to be studied further.
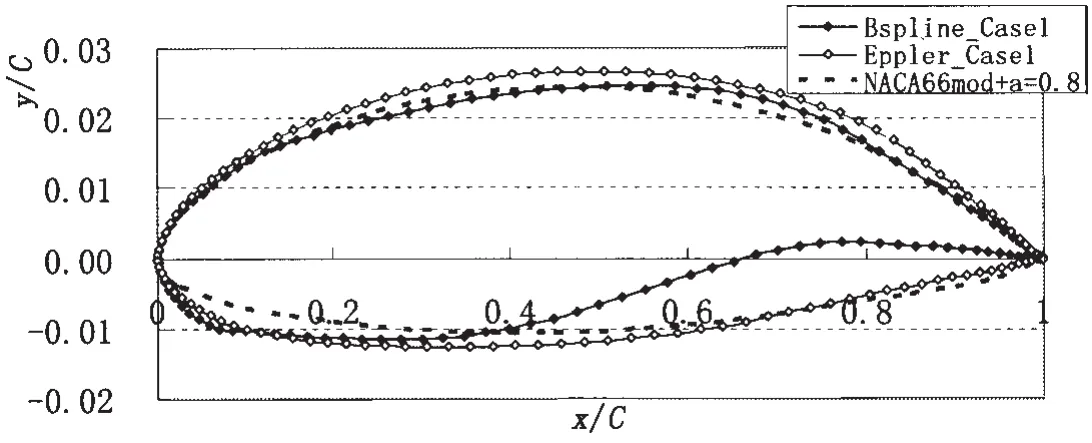
Fig.13 The optimized sections(Case 1)
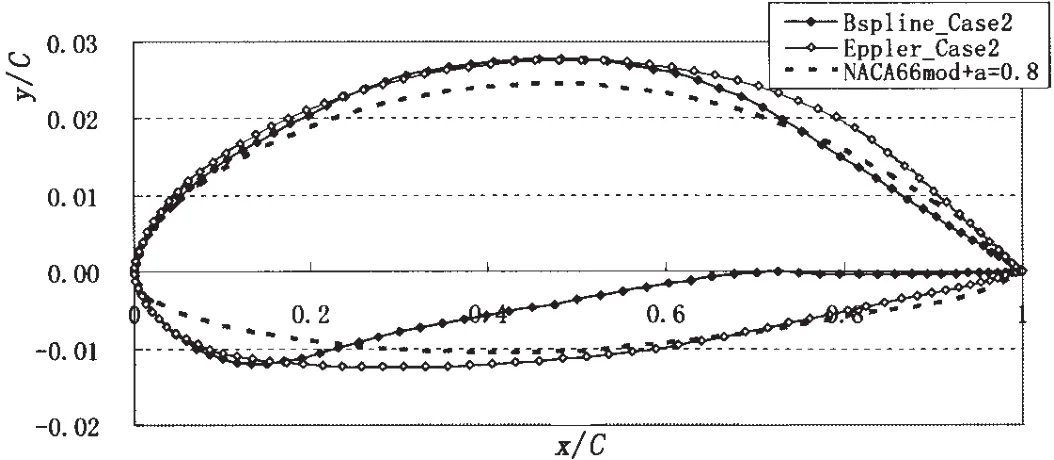
Fig.14 The optimized sections(Case 2)
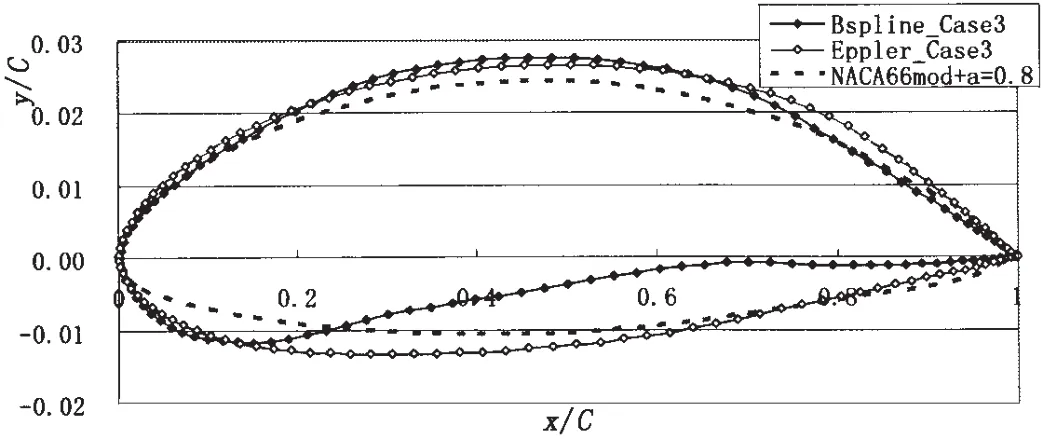
Fig.15 The optimized sections(Case 3)
5 Conclusions
A comparative investigation on the effects of two parametric representation methods:B-spline method and Eppler method in the section design optimization method was carried out,some conclusions can be drawn as follows:
(1)The design optimization method with these two parametric representation methods can all work out optimum sections,and can be taken as a practical and convenient section design optimization tool.
(2)The comparative investigation shows the superiority of Eppler method in optimized a section with better suction bubble cavitation margin and B-spline method can generate slightly better sheet cavitation margins on suction side or pressure side of a section.
The design optimization method is developed for designing blade section to suppress cavitation,however it can be used as a general tool to design a section with other optimum performances.
[1]Eppler R A.Computer program for the design and analysis of low-speed airfoil[R].NASA Technical Memorandum,1980,80210.
[2]Shen Y T.Wing sections for hydrofiles-part 3 eexperimental verifications[J].Journal of Ship Research,1985,29(1):39-50.
[3]Zondervan G J,Holtrop J.Application of advanced sectional profoiles in the design of propulsors and ship appendages[C]//Proceedings of Propeller and Shafting Symposium,2000.Virginia Beach,2000.
[4]Black Scott,Shen Young,Jessup Stuart.Advanced blade sections for high speed propellers[C]//Propellers and Shafting Symposium,2006.
[5]Zeng Zhibo,Kuiper G.Blade section design of marine propellers with maximum inception speed[C]//Proceedings of the 7th International Symposium on Cavitation.CAV2009,Ann Arbor,Michigan,USA,2009.
[6]Kuiper G,Jessup S D.A propeller design method for unsteady conditions[J].SNAME Transactions,1993,101:247-273.
螺旋桨叶剖面优化设计比较研究
曾志波
(中国船舶科学研究中心,江苏 无锡 214082)
比较研究了船舶螺旋桨最高空泡起始航速的叶剖面优化设计方法。优化设计方法由剖面参数表达、空泡斗预报和最佳空泡起始性能遗传算法翼型优化三部分组成。Eppler方法采用10个参数表达任一翼型,已被有效应用到最高起始航速的螺旋桨叶剖面优化设计中。除了Eppler方法中的设计参数,剖面参数表达也可采用B样条曲线的控制点参数实现。对上述两种剖面参数表达方法进行了叶剖面优化设计比较研究,得到了一些结论。
叶剖面优化设计;遗传算法;B样条;Eppler方法;比较研究
U661.313
A
曾志波(1980-),男,中国船舶科学研究中心工程师。
U661.313
A
1007-7294(2011)12-1344-09
date:2011-08-23
猜你喜欢
杂志排行
船舶力学的其它文章
- Numerical Research on Ventilated Supercavity Shape and Flow Structure in the Turning Motion
- Experimental Investigation of Sloshing Loads and Structural Dynamic Responses in Tanks of LNG Carriers
- Comparative Analysis of Vortex Induced Nonlinear Vibration of Casing Pipe under Three Different Boundary Conditions
- Study of Damage Characteristics during Fatigue by Acoustic Emission Techniques
- Nonlinear Model for Vibration Analysis of Fluid-conveying Pipes via the Incremental Harmonic Balance Method
- Coupled Vibration of Fluid-filled Functionally Graded Material Cylindrical Shell
