大气河对南极冰盖及海冰的影响
2024-04-25梁凯昕王今菲杨清华胡晓明刘骥平
梁凯昕 王今菲 杨清华 胡晓明 刘骥平
摘要 南极冰盖与海冰对全球气候具有重要影响。大气河作为高纬度地区经向水汽输送的重要途径,其对南极冰盖与海冰的影响在近年来愈发受到重视。南极大气河通常形成于高压脊(阻塞高压)与温带气旋之间的强向极经向输送带内。低频的大气河活动为南极带来强降雪,有利于冰盖质量增加。然而,强暖湿水汽侵入同时会导致表面融化、冰架崩解和极端高温,对冰盖质量存在潜在负贡献。大气河携带极端暖湿水汽与强风通过热力与动力过程导致海冰密集度下降。目前,大气河的识别算法仍不完善,其对液态降水的直接影响、与南大洋的相互作用等仍不清楚,需要进一步明晰大气河对南极冰盖与海冰的影响机制,以准确预估未来大气河对南极冰盖物质平衡与海冰变化的作用。
关键词大气河;南极;冰盖;海冰
南极冰盖与海冰是地球系统的关键组成部分。南极冰盖质量变化主要受降雪、冰架底部融化与前沿崩解的影响,对全球海平面上升具有重要贡献(Bronselaer et al.,2018;Shepherd et al.,2018)。1992—2017年,南极冰盖在冰架底部融化与前沿崩解的作用下,总体质量已损失约(2 720±1 390)×109 t,对应海平面上升(7.6±3.9) mm(Shepherd et al.,2018)。作为冰盖质量的重要来源,降雪主要由温带气旋等天气系统向南极大陆输送的水汽抬升所致(Nicolas and Bromwich,2011;Boening et al.,2012;Lenaerts et al.,2019),有利于减缓南极冰盖质量损失(Davison et al.,2023)。此外,海冰对全球经向翻转环流(Marsland et al.,2007)、能量收支平衡(Riihel et al.,2021)等具有影响。2014年以前南极海冰范围呈现缓慢增长趋势,但在2016年后南极海冰急剧减少(Eayrs et al.,2021),南极海冰范围极小值在2017、2022与2023年夏季接连被打破,这预示着南极海冰可能进入极端事件频发的新状态(Liu et al.,2023)。其中,海冰区域的水汽含量与海冰密集度存在显著的负相关关系,在极小值事件中向极水汽侵入导致海冰范围急剧减小(Ionita et al.,2018;Wang et al.,2023a)。可见,水汽输运是南极冰盖与海冰的重要影响因素之一。
大气河(Atmospheric River,AR)是长而窄的瞬时水汽输运带,因其携带的水汽通量与亚马孙河流量接近而得名(Newell et al.,1992;Zhu and Newell,1994)。大气河通常形成于温带气旋冷锋锋面前部、垂直于暖锋锋面(Ralph et al.,2004,2017),主导中高纬度约90%的经向水汽输运(Zhu and Newell,1998;Guan and Waliser,2015),其强致灾性引起了国际学界的广泛关注(Ralph et al.,2006;Leung and Qian,2009;Lavers and Villarini,2013;Lamjiri et al.,2017;Waliser and Guan,2017)。对比中低纬度已有的大量大气河观测、成因及影响等方面的研究,大气河在南极区域的研究仍相对较少。Gorodetskaya et al.(2014)首次将大气河事件与东南极极端降雪事件进行联系。除了引发异常降雪,大气河对西南极冰盖融化有显著贡献(Wille et al.,2019),并通过增强南极半岛东侧的焚风效应触发南极破纪录的高温(Bozkurt et al.,2018)。因此,大气河对南极冰盖的影响受到重视,系列研究从大气河对冰盖雪累积贡献(Pohl et al.,2021;Terpstra et al.,2021;Wille et al.,2021;Maclennan et al.,2022,2023;Baiman et al.,2023;Davison et al.,2023)、冰盖融化与冰架崩解作用(Djoumna and Holland,2021;Francis et al.,2021;Wille et al.,2022)、极端高温事件(Xu et al.,2021;Clem et al.,2022;Turner et al.,2022)等方面开展。Francis et al.(2020)揭示了大气河造成的极端大气异常是威德尔海(Weddell Sea)冰间湖开启的关键,大气河对南极海冰的影响因此受到了关注。大气河也会触发海洋异常,并在与大气异常的共同作用下,促使威德尔海海冰范围在2019年4—5月达到卫星记录以来的最低值(Jena et al.,2022)。
除个例研究以外,长期统计的结果展示海冰区域超过50%的极端水汽异常事件与大气河相联系(Hepworth et al.,2022);Liang et al.(2023)进一步量化大气河对海冰的影响,发现低频的大气河事件期间每日海冰边缘密集度下降超过10%。在全球变暖的背景下,多个全球气候模式预估南大洋与南极大陆沿岸大气河频率将显著升高,并将更频繁地影响南极冰盖与海冰(Espinoza et al.,2018),因此亟需加强大气河对南极区域作用机制的认识。
因此,本文将从大气河在南极的成因、识别方法与分布,大气河对南极冰盖的影响,以及大气河对南极海冰的影响3个方面综述相关研究进展,系统认识大气河对南极冰雪物质平衡的作用,揭示目前研究的不足,以进一步推动南极大气河等极端天气尺度事件的研究。
1 南极大气河的成因、识别与分布
1.1 南极大气河的成因
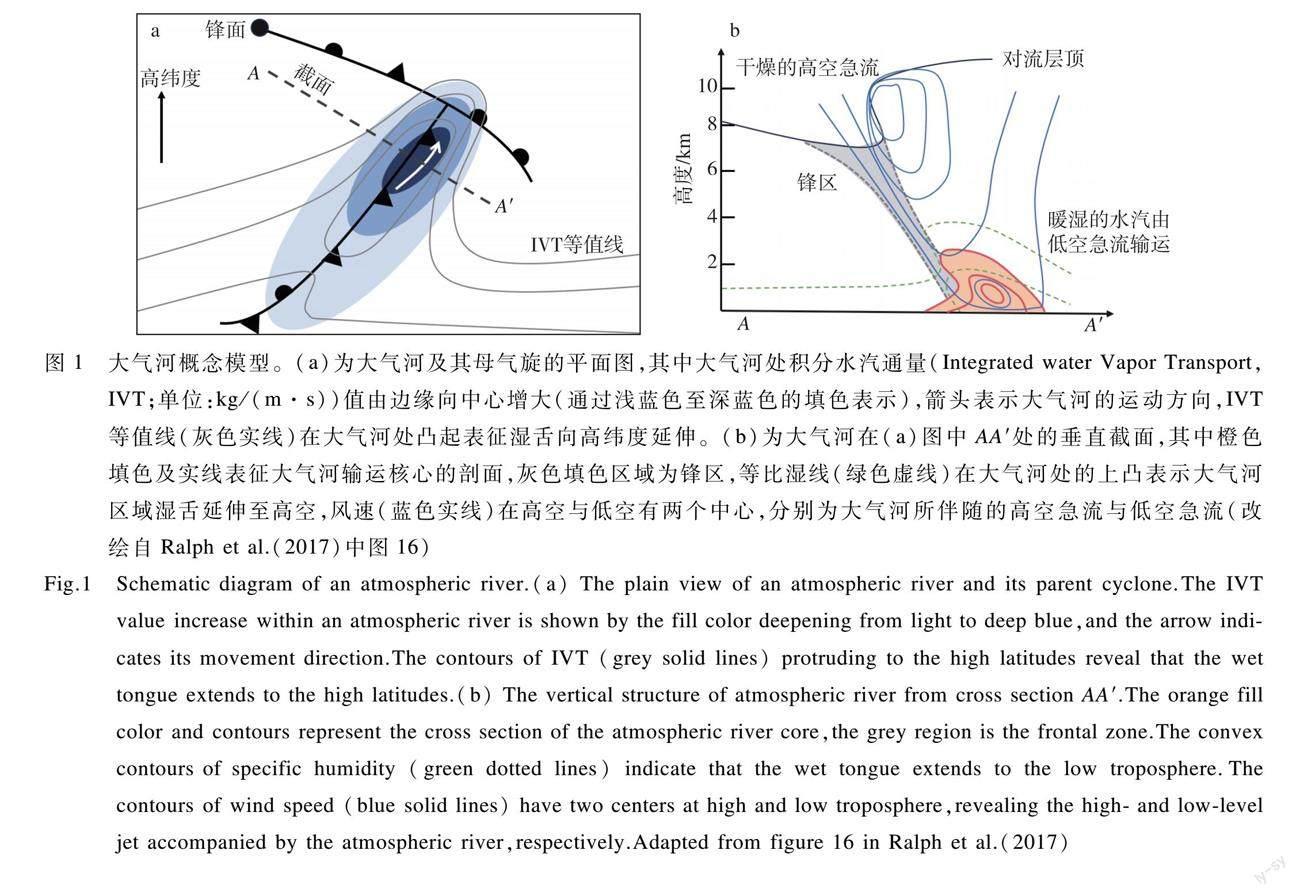
现场观测表明,中纬度地区大气河通常形成于温带气旋冷锋锋前,平行于冷锋锋面、垂直于暖锋鋒面;大气河主要通过冷锋锋前对流层低层(约4 km以下)的低空急流输运大量水汽,在高层存在干燥的高空急流,这样的垂直结构使大气河区域大气极其不稳定(Ralph et al.,2004,2017)(图1)。但在极地区域,由于缺乏现场观测与相关统计工作,成熟的大气河概念模型仍未建立。从多个个例研究(Bozkurt et al.,2018;Wille et al.,2019;Francis et al.,2020,2021)可以发现,大气河通常发生在高压脊与受其阻挡的温带气旋之间的强向极气流带内,该区域有利于强经向水汽与热量输运。Pohl et al.(2021)和Baiman et al.(2023)利用聚类分别对登陆东南极与毛德皇后地(Dronning Maud Land)的大气河进行天气形势分析,结果也表明气旋与高压脊(阻塞高压)配合的天气形势有利于大气河形成,因而区域阻塞指数是进行南极大气河预测的因子之一(Wille et al.,2021)。爆发性气旋也常伴随着大气河的发生(Zhu and Newell,1994;Francis et al.,2021;Jena et al.,2022),但在南极区域两者的关系需要进一步统计。南极大气河的垂直结构与中纬度大气河接近,同样存在低空急流的结构,但在不同站点所观测得到的湿度廓线并不一致,因此尚需开展更多的高时空分辨率的无线电探空仪观测,以得到适用于南极的大气河垂直剖面模型(Gorodetskaya et al.,2020)。
1.2 南极大气河的识别
大气河是长而窄的水汽输运带,最早的全球识别程序由Guan and Waliser(2015)提出。他们利用极端的IVT表征大气河:当一个网格的IVT值大于该网格一个季节内85%的IVT值,且大于100 kg/(m·s),即认为该格点满足大气河阈值条件;当这些格点组成的闭合形状长度大于2 000 km、长宽比大于2,即被认为是大气河。IVT的计算公式如下:
IVT=1g∫300 hPa1 000 hPaqudp2+1g∫300 hPa1 000 hPaqvdp2。(1)
其中:g是重力加速度(常量设定为9.806 65 m/s2);q是比湿(单位:kg/kg);u和v分别是纬向风和经向风(单位:m/s);dp是相邻气压层的气压差(单位:hPa)。在这一算法的基础上,Wille et al.(2019)针对南极区域开发了新的算法。该算法与Guan and Waliser(2015)的算法思路一致,利用经向积分水汽输运(v-component of Integrated water Vapor Transport,vIVT;单位:kg/(m·s))与积分水汽含量(Integrated Water Vapor,IWV;单位:kg/m2)进行识别,百分位阈值调整为vIVT或IWV值大于网格一个月内98%的vIVT或IWV值,以便大气河在南极区域能维持细长的结构;且大气河形状阈值简化为闭合形状经向跨度大于20°即认为是大气河。IWV与vIVT的计算公式如下:
IWV=1g∫300 hPa1 000 hPaqdp。(2)
vIVT=1g∫300 hPa1 000 hPaqvdp。(3)
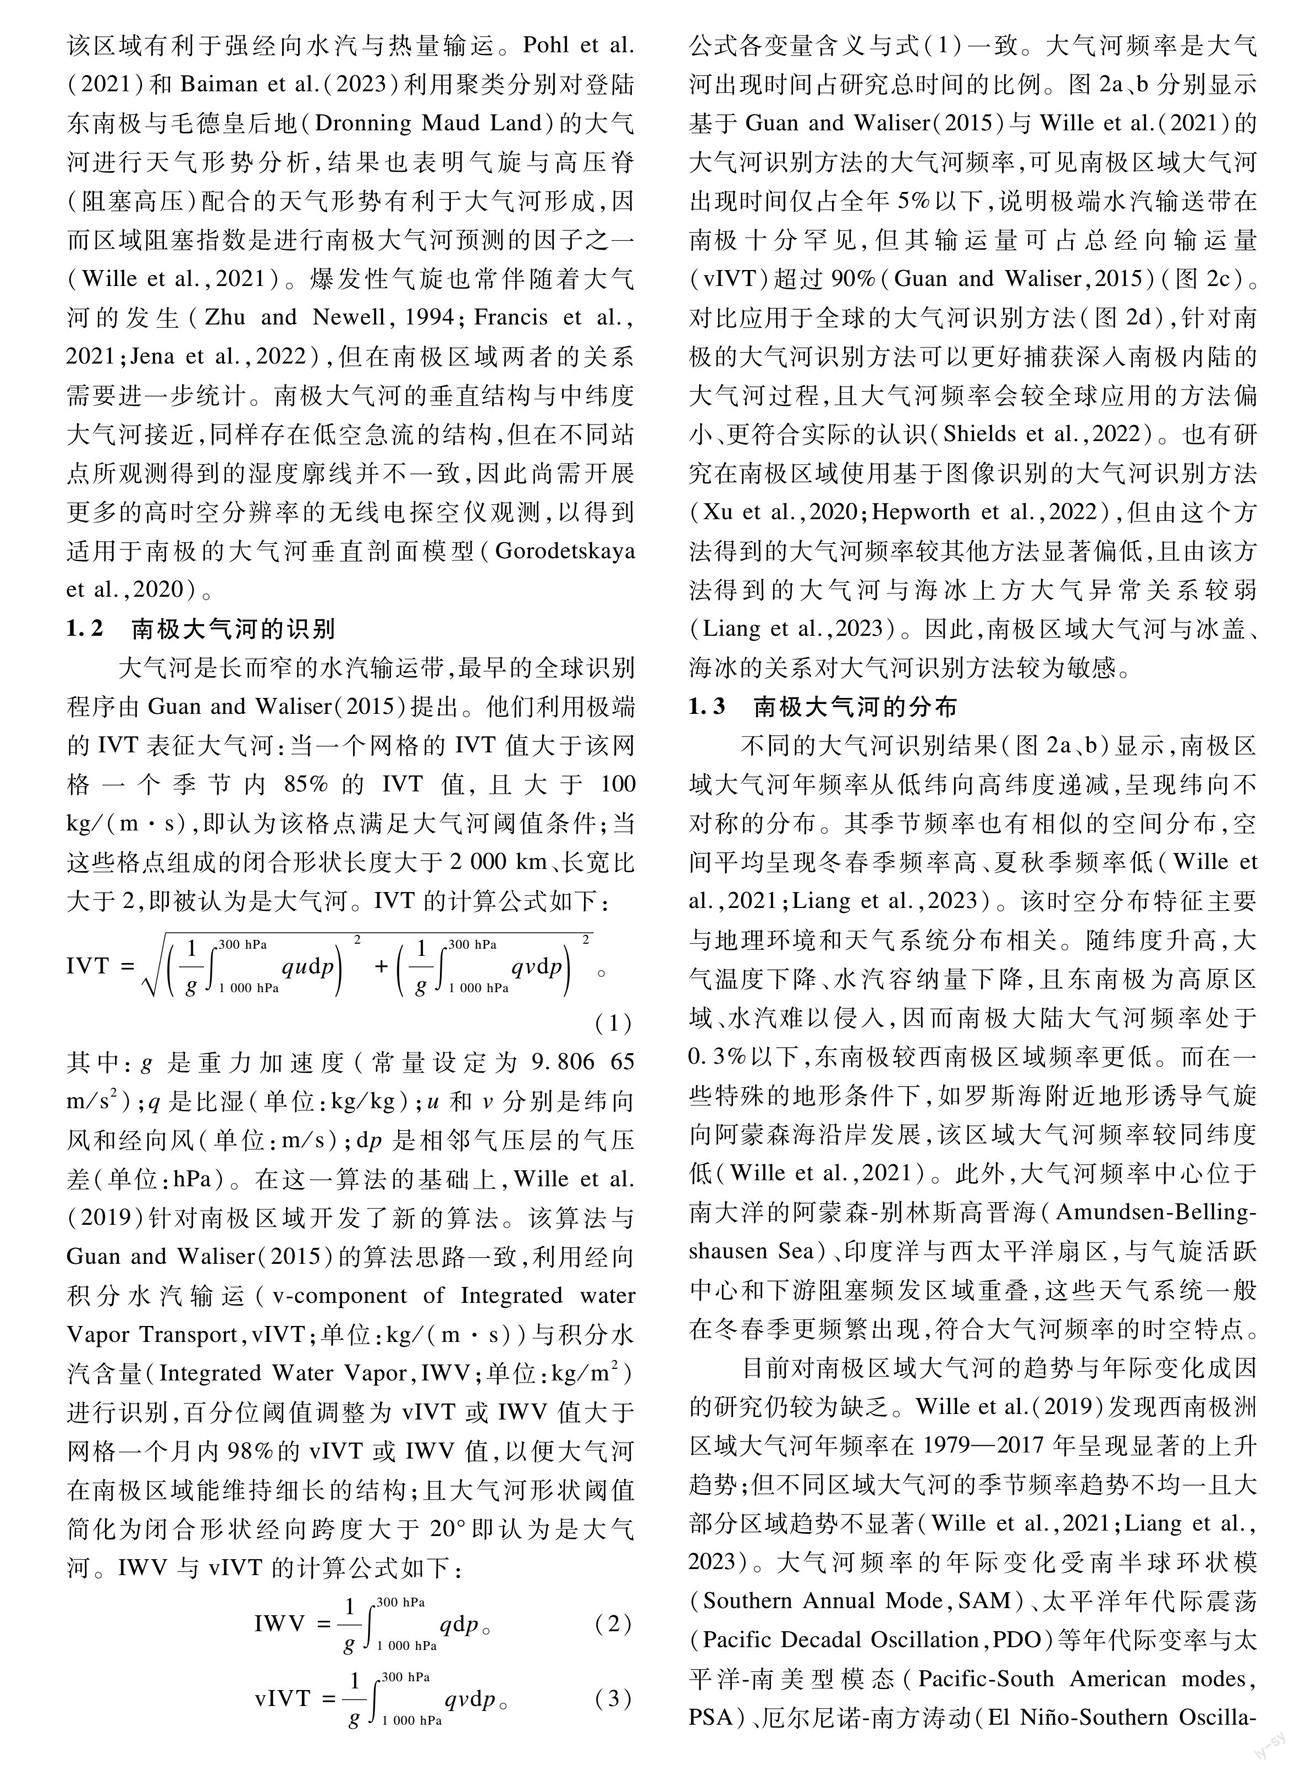
公式各变量含义与式(1)一致。大气河频率是大气河出现时间占研究总时间的比例。图2a、b分别显示基于Guan and Waliser(2015)与Wille et al.(2021)的大气河识别方法的大气河频率,可见南极区域大气河出现时间仅占全年5%以下,说明极端水汽输送带在南极十分罕见,但其输运量可占总经向输运量(vIVT)超过90%(Guan and Waliser,2015)(图2c)。对比应用于全球的大气河识别方法(图2d),针对南极的大气河识别方法可以更好捕获深入南极内陆的大气河过程,且大气河频率会较全球应用的方法偏小、更符合实际的认识(Shields et al.,2022)。也有研究在南极区域使用基于图像识别的大气河识别方法(Xu et al.,2020;Hepworth et al.,2022),但由这个方法得到的大气河频率较其他方法显著偏低,且由该方法得到的大气河与海冰上方大气异常关系较弱(Liang et al.,2023)。因此,南極区域大气河与冰盖、海冰的关系对大气河识别方法较为敏感。
1.3 南极大气河的分布
不同的大气河识别结果(图2a、b)显示,南极区域大气河年频率从低纬向高纬度递减,呈现纬向不对称的分布。其季节频率也有相似的空间分布,空间平均呈现冬春季频率高、夏秋季频率低(Wille et al.,2021;Liang et al.,2023)。该时空分布特征主要与地理环境和天气系统分布相关。随纬度升高,大气温度下降、水汽容纳量下降,且东南极为高原区域、水汽难以侵入,因而南极大陆大气河频率处于0.3%以下,东南极较西南极区域频率更低。而在一些特殊的地形条件下,如罗斯海附近地形诱导气旋向阿蒙森海沿岸发展,该区域大气河频率较同纬度低(Wille et al.,2021)。此外,大气河频率中心位于南大洋的阿蒙森-别林斯高晋海(Amundsen-Bellingshausen Sea)、印度洋与西太平洋扇区,与气旋活跃中心和下游阻塞频发区域重叠,这些天气系统一般在冬春季更频繁出现,符合大气河频率的时空特点。
目前对南极区域大气河的趋势与年际变化成因的研究仍较为缺乏。Wille et al.(2019)发现西南极洲区域大气河年频率在1979—2017年呈现显著的上升趋势;但不同区域大气河的季节频率趋势不均一且大部分区域趋势不显著(Wille et al.,2021;Liang et al.,2023)。大气河频率的年际变化受南半球环状模(Southern Annual Mode,SAM)、太平洋年代际震荡(Pacific Decadal Oscillation,PDO)等年代际变率与太平洋-南美型模态(Pacific-South American modes,PSA)、厄尔尼诺-南方涛动(El Nio-Southern Oscillation,ENSO)、印度洋偶极子(Indian Ocean Dipole,IOD)等年际变率的调控,这些内部变率对西南极大气河频率的调控作用强于东南极;当厄尔尼诺-南方涛动与印度洋偶极子同相时与,它们大气河频率的相关性较其他大气或海洋模态高(Shields et al.,2022),但这些模态如何影响大气河频率尚未得到阐明。
2 大气河对南极冰盖的影响
2.1 大气河对冰盖表面积雪的贡献
南极大陆降水由频繁而较弱的晴空降水和海洋气团侵入南极大陆的较强降水组成。作为海洋水汽侵入南极大陆的重要途经,大气河期间的降水量占南极冰盖(包含陆地冰盖及延伸至海洋的冰架)总降水量的(13±3)%(图3),南极横贯山脉东侧的东南极洲的占比(16%)高于西侧的西南极洲(9%)与南极半岛(10%),东南极洲海拔高度低于3 000 m的部分区域大气河降水占比甚至高达20%。由于大气河等极端水汽输运过程对比一般水汽侵入过程更能深入高寒的南极大陆,所以大气河对南极陆地冰盖(14%)的降水贡献较冰架(11%)更高。对于降水的年际变率,大气河在东南极洲、西南极洲以及南极半岛的解释方差分别达到66%、55%和34%(Maclennan et al.,2022)。同时,大气河与南极大陆极端降水事件密切相关。将南极区域各格点1980—2018年逐3 h累计降水量最强的10%、5%与1%的时刻定义为各格点不同程度的极端降水时刻;在东南极区域,大气河与极端降水同时出现的时刻分别占总极端降水时刻的45%~60%、70%~90%和95%~99%,在西南极区域,这个比例甚至更高(Wille et al.,2021)。这一结果表明,越极端的降水事件,大气河在其中的主导作用越显著,强水汽输运带对相对干燥的南极大陆的作用不可忽视。
由于南极大陆纬度高、海拔高、温度低,除南极半岛南端较低纬度区域,与大气河相关降水多数以降雪形式进行(Wille et al.,2021)。因此,大气河对南极冰盖质量有重要的正贡献作用。Gorodetskaya et al.(2014)分析东南极伊丽莎白公主(Princess Elisabeth)站的现场观测资料发现,该站2009年5月与2011年2月的两次强雪累积事件由大气河导致,且2009年与2011年该站冰盖表面质量异常增加的74%与80%可分别归因至当年4次与5次的大气河事件。由于西南极洲冰盖在1997年以来质量损失远超东南极洲冰盖(Shepherd et al.,2018),该区域的冰盖质量平衡受到了更多的关注。Adusumilli et al.(2021)利用雷达高度计数据得知,2019年4月—2020年6月期间西南极洲41%的冰盖增厚来自极端降水事件,而63%的极端降水事件与低频的大气河事件相联系;Maclennan et al.(2023)利用自动气象站数据与SNOPACK积雪模式,针对大气河对西南极东思韦茨冰川(Thwaites Eastern Ice Shelf)的影响进行模拟,模拟结果显示接连出现的大气河事件(大气河族)为该区域带来了超过100 kg/m2的质量累积。大气河作为西南极洲的降水来源之一,其对西南极洲冰盖质量具有深远意义。Davison et al.(2023)认为2019年与2020年大气河导致的极端降水使西南极冰盖质量损失减少了(60±16) Gt/a、总质量损失降低到(107±15) Gt/a,并强调了极端降雪在短时间内削弱了西南极洲对海平面升高的贡献。
2.2 大气河对冰盖融化与冰架崩解的作用
大气河除了对南极冰盖质量有重要的正贡献外,其伴随的暖湿平流与强风也可能通过冰盖表面融化与冰架崩解导致冰盖质量损失。对于西南极洲的表面融化,大气河与位于西南极洲的罗斯冰架(Ross Ice Shelf)40%的夏季融水相关联,与海拔更高的玛丽伯德地(Marie Byrd Land)的关联性更是接近100%;而与威尔金斯(Wilkins)、巴赫(Bach)、乔治四世(George IV)以及拉森(Larsen)B和拉森C冰架的冬季表面融水关联性介于40%至80%(Wille et al.,2019)。大气河在西南极洲不同区域与季节造成的表面融化机制存在差别:冬季,大气河增强了位于南极半岛山脉背风坡一侧拉森C冰架区域的焚风效应,异常高的感热通量与向下长波辐射共同造成该处的表面融化(Wille et al.,2019)(图4);夏季,罗斯冰架同样受到焚风的影响,净短波辐射的增强主导着该区域的表面融化,异常高的温度与云水含量导致向下长波辐射增强,进一步扩大表面融化的范围,而融化与液态降水降低了冰架表面反照率,加剧了后续对短波辐射的吸收(Hu et al.,2019;Zou et al.,2021;Li et al.,2023)。虽然大气河对表面融化有重要贡献,但Adusumilli et al.(2021)与Maclennan et al.(2023)指出大气河带来的融化量远小于降雪带来的质量增加,且表面融化目前并不是南极冰盖质量损失的重要途径(Rignot et al.,2013)。尽管如此,在全球变暖的背景下,表面融化对冰盖质量损失的贡献增强了(Trusel et al.,2015),因而大气河对南极冰盖质量减少的作用也愈发不可忽视。
冰架崩解贡献约50%的南极冰盖质量损失(Rignot et al.,2013),而大气河对冰架崩解也存在直接或间接的触发作用。在南极半岛区域,大气河与40%的极端温度、表面融化、海冰破碎及海浪相聯系,冰架表面融水径流增强通过水力压裂促进冰架缝隙生长,同时失去周边海冰保护的冰架更容易受到海浪破坏(图4)。在这些因素的共同作用下,2000—2020年南极半岛60%的冰盖崩解事件由大气河触发(Wille et al.,2022)。在东南极洲,2019年9月埃默里冰架(Amery Ice Shelf)发生了50年以来最强的冰架崩解事件,Francis et al.(2021)认为此次事件由两次爆发性气旋及其伴随的大气河触发:第一个爆发性气旋期间,大气河向埃默里冰架前的海冰区域输运了大量暖湿水汽与强风,使得海冰与冰盖前沿强度减弱;第二个爆发性气旋期间,气旋将冰架上大量冷空气向海洋方向输送,离岸运动的海冰使冰架前沿失去支撑性,风压与海浪进一步扩大了冰架前沿已有的裂缝,最终触发冰架的崩解。由此可见,大气河所引起的极端大气与海洋状态在一定程度上触发了崩解的发生。
2.3 大气河对南极极端高温事件的作用
南极半岛是南极大陆纬度最低的区域,南极大陆破纪录的高温通常发生于此。该区域的极端高温事件通常会导致冰盖与冰架的剧烈融化,冰架表面融池和水力压裂作用促使冰架崩解、接地冰加速损失,进而影响冰盖的稳定性(Scambos et al.,2000;Fahnestock et al.,2002;van den Broeke,2005;Turner et al.,2021)。2015年3月24日在南极半岛南端的埃斯帕兰萨站出现17.5 ℃破纪录的高温,Bozkurt et al.(2018)认为,大气河携带的大量水汽在南极山脉的抬升作用下形成迎风坡降水,加强了背风坡的焚风效应,干热的焚风是此次高温的主导因素(图4);在地形敏感性实验中,南极山脉对高温的重要性得到了证实。而大气河的暖湿平流对高温起触发作用与间接增强作用。2020年2月6日该站的高温记录再次被打破,达到了18.3 ℃,暖空气的向下输运对高温起主要贡献;虽然此次极端高温同样存在大气河事件的发生,但大气河较弱,未能通过迎风坡潜热释放增强背风坡焚风(Xu et al.,2021)。Clem et al.(2022)系统总结了南极半岛极端高温和表面融化的成因,结果表明赤道中太平洋深对流触发罗斯贝波波列,使德雷克海峡(Drake Passage)上空高压异常并引导强暖湿气流以大气河的形式到达南极半岛山脉西侧,增强东侧焚风效应,触发高温与极端融化。因此,从个例与气候态的角度都可以证实大气河对南极半岛极端高温事件具有重要作用。
对比南极半岛显著的增暖趋势,东南极洲在近40年来呈现降温趋势(Nicolas and Bromwich,2014),因而该区域的极端高温事件受关注度较低。在东南极洲的埃默里冰架,1989年12月发生了一次温度较气候态偏高14 ℃的极端高温事件,其形成是由于大气河带来的极端暖平流与内陆下降风绝热增温相继发生的叠加作用所致。大气河也会深入东南极洲高原并造成极端高温。2022年3月18日冰穹C(Dome C)的爆发性增温过程使地表气温达到-12.2 ℃,较常年偏高44.5 ℃;分析表明,在阻塞高压上游的大气河为冰穹C提供了大量水汽与云液态水,使该处发生瞬时的剧烈增暖(Wang et al.,2023b)。目前,大气河对东南极洲极端高温作用的研究仅限于个例研究,在未来需要进一步厘清大气河对东南极洲、尤其是东南极高原区域极端高温的总体贡献,以认识东南极洲冰盖稳定性的变化及成因。
3 大气河对南极海冰的影响
与北极近40年来海冰范围呈现显著的下降趋势相反,南极海冰范围呈现微弱的上升趋势(Simmonds,2015),并在2012、2013及2014年多次打破历史海冰范围最大值(Turner et al.,2013;Reid and Massom,2015)。但在2016年以后,南极海冰范围急剧下降,在2017、2022及2023年屡次打破海冰范围的最小值(Liu et al.,2023)。極小值事件期间的海冰变化与大气河相联系,2016年春季是1979年以来最暖湿的春季,暖湿平流导致2016年10—11月海冰范围达到历史最低值;期间,最强的日海冰密集度负异常出现都伴随着大气河形态的暖湿平流发生(Ionita et al.,2018)。大气河影响南极海冰的具体过程在Francis et al.(2020)的研究中得到了进一步分析。大气河携带的暖湿空气使海冰表面温度上升,进入海冰的表面热通量增加。同时,强降雪造成海冰表面新雪累积,隔绝了融化的海冰与上方较冷的空气进行热量交换,进一步阻止了海冰的重新冻结,最终触发1973年与2017年威德尔冰间湖开启。研究认为,如果没有大气河事件在前期使海冰密集度减小,那么气旋将无法单独将冬季结实的海冰吹散、开启冰间湖(Francis et al.,2020)。大气河在引起大气异常的同时,也会导致海洋异常。2019年4—5月威德尔海区域出现了8次爆发性气旋,其伴随的大气河事件引发的大气异常与威德尔海冰间湖开启事件相似,且受大气河向岸强风的作用,海冰向岸漂移、海冰边缘减退。结合大气河的母气旋向海洋表面施加风应力,引起次表层暖水抽吸、混合层增暖超过2 ℃;冰缘处波高异常达到4 m以上,进而加剧了海冰破碎。在大气与海洋异常的共同作用下,一天之内海冰边缘密集度可以下降接近50%,最终导致该区域海冰范围低于气候态约22%。
上述个例研究表明大气河可导致急剧的海冰减少,并描述了大气河对海冰的热力与动力作用:暖湿水汽加剧海冰融化,同时强风将海冰向岸漂移。但大气河对海冰密集度变化的总体贡献与其热力和动力作用对海冰变化的相对贡献尚不清晰。Liang et al.(2023)对1979—2020年大气河对南极海冰变化的总体影响进行了评估,结果表明大气河可为海冰边缘带来超过10%/d的海冰密集度下降,海冰的热力过程主导海冰边缘密集度的急剧减小;而动力作用使海冰向南极沿岸平流,且对密集度变化的贡献较小。海冰变化与大气河引起的大气异常相联系,但在不同季节大气河导致的大气异常对海冰变化的影响不一致(图5):冬季,大气河伴随的高水汽输运量为冰区带来暖湿且多云的天气,感热通量异常主导着表面热通量的显著正异常,同时海冰边缘受风浪破碎影响,侧向融化较海冰内部更加剧烈;而夏季,多云天气阻隔强的太阳短波辐射入射,净短波辐射的异常减少远超其余能量组分的增加,使海冰得到的融化能量减少。因此就气候态而言,对比非大气河情况,大气河在夏季对海冰几乎不会产生额外融化,甚至会起到减缓表面融化的作用。夏季异常强的降水部分补偿了大气河削弱融化的作用。
4 总结与展望
大气河作为暖湿平流进入南极区域的重要途径,会对南极冰盖、海冰造成显著影响。在南极,大气河通常形成在高压脊(阻塞高压)向极气流一侧,也常伴随于爆发性气旋发生;在对流层低层存在低空急流。有多种方法对南极区域大气河进行识别,不同方法得到的大气河频率分布、大小有所不同,因而南极冰盖、海冰与大气河的关系受识别方法的影响。南极区域大气河的年频率随纬度增高而递减、纬向分布不均一,而季节频率在冬春季较高;这样的时空特征主要受地理环境与南极地区天气系统分布的影响。大气河的年际变率可能受南极环状模等大尺度环流的影响,也受如厄尔尼诺-南方涛动、印度洋偶极子等热带海表面温度模态的遥相关作用的影响。大气河对南极大陆冰盖质量平衡同时存在正、负异常贡献:大气河携带大量水汽为南极大陆带来充沛降雪的同时,也会造成表面融化、冰架崩解与极端高温,对冰盖的稳定性存在潜在威胁。而大气河通过热力与动力作用协同对海冰进行影响:大气河输运的暖湿水汽导致气温、表面热通量正异常,增强了海冰融化,热力融化的作用在冬季最显著;而强风将海冰向岸吹移,引发的海浪加速海冰破碎,进而加剧侧向融化。虽然对南极区域大气河的研究已从多个角度开展,但仍存在以下问题:
1)大气河对冰盖与海冰影响的评估依赖于大气河算法的选取。目前主流的南极区域大气河识别算法为Wille et al.(2021)开发的阈值判别法,但由于阈值的选取具有主观性,所以阈值的调整直接影响着大气河的数量与范围;利用图像特征识别对大气河进行判别的方法虽然避免了阈值选取的不确定性问题(Xu et al.,2020),但其在南极的判别结果与阈值判别法差异较大,不同方法间难以互相验证研究结论的准确性(Liang et al.,2023)。同时,选取不同时间分辨率的资料对大气河识别也存在影响,时间分辨率更高的大气资料能提供生命周期较短的大气河信息,但也可能高估水汽的瞬时作用对冰盖和海冰的影响。因此,可考虑使用如机器学习的方法进一步提取大气河的时空特征,以形成更普适且稳健的南极大气河客观识别算法。
2)大气河液态降水对冰盖与海冰的直接影响仍不清晰。大气河输运足够暖湿的水汽为南极沿岸区域带来绝大部分的液态降水(Wille et al.,2021),但由于液态降水量较少,其作用常常被忽略。液态降水直接为冰盖与海冰提供融化能量,这一部分能量的忽略可能导致大气河的影响被低估。同时,降雨可以提供大量液态水,通过水力压裂直接促进冰架缝隙发育、引发冰架崩解。这些过程需要通过现场观测与模式模拟确认,以进一步准确量化大气河对冰盖与海冰的作用。
3)大气河与南大洋的相互作用对冰盖与海冰的影响仍不明晰。一方面,大气河通过降水与融化海冰为海洋提供淡水,增强海洋层化(Edholm et al.,2022);另一方面,其风应力对海水的扰动可能使次表层暖水上翻,在加剧海冰融化的同时,也会带来冰架的底部融化。冰架的底部融化是南极冰盖物质损失的另一重要途径,但大气河对这一过程的影响仍不清晰。此外,天气活动导致的南大洋区域海冰-海洋变化也可能通过增强大气温度梯度与斜压性反馈影响风暴轴的强度(Zhang et al.,2023),而风暴轴与大气河有密切联系(Guan and Waliser,2015;Park et al.,2021)。因此,应进一步探究大气河与海洋的相互作用,加深极端大气条件对海洋-海冰-冰架系统影响的认识。
4)预估未来大气河对南极冰盖物质平衡的影响。一方面,大气河通过极端的降雪为南极大陆带来质量输入;另一方面,大氣河会导致南极大陆的冰架崩解与表面融化,而它们是南极大陆质量损失的重要与潜在途径。虽然目前大气河主要带来质量输入,但在全球变暖的背景下,大气河这两个途径的影响可能会发生动态变化。因此,对南极区域大气河未来趋势进行预估有助于我们更好认识南极冰盖质量平衡的未来变化。
参考文献(References)
Adusumilli S,Fish M A,Fricker H A,et al.,2021.Atmospheric river precipitation contributed to rapid increases in surface height of the West Antarctic ice sheet in 2019[J].Geophys Res Lett,48(5):e2020GL091076.doi:10.1029/2020gl091076.
Baiman R,Winters A C,Lenaerts J,et al.,2023.Synoptic drivers of atmospheric river induced precipitation near dronning maud land,Antarctica[J].J Geophys Res:Atmos,128(7):e2022JD037859.doi:10.1029/2022jd037859.
Boening C,Lebsock M,Landerer F,et al.,2012.Snowfall-driven mass change on the East Antarctic ice sheet[J].Geophys Res Lett,39(21):L21501.doi:10.1029/2012gl053316.
Bozkurt D,Rondanelli R,Maríin J C,et al.,2018.Foehn event triggered by an atmospheric river underlies record-setting temperature along continental Antarctica[J].J Geophys Res:Atmos,123(8):3871-3892.doi:10.1002/2017JD027796.
Bronselaer B,Winton M,Griffies S M,et al.,2018.Change in future climate due to Antarctic meltwater[J].Nature,564:53-58.doi:10.1038/s41586-018-0712-z.
Clem K R,Bozkurt D,Kennett D,et al.,2022.Central tropical Pacific convection drives extreme high temperatures and surface melt on the Larsen C Ice Shelf,Antarctic Peninsula[J].Nat Commun,13(1):3906.doi:10.1038/s41467-022-31119-4.
Davison B J,Hogg A E,Rigby R,et al.,2023.Sea level rise from West Antarctic mass loss significantly modified by large snowfall anomalies[J].Nat Commun,14(1):1479.doi:10.1038/s41467-023-36990-3.
Djoumna G,Holland D M,2021.Atmospheric rivers,warm air intrusions,and surface radiation balance in the Amundsen Sea embayment[J].J Geophys Res:Atmos,126(13):e2020JD034119.doi:10.1029/2020JD034119.
Eayrs C,Li X C,Raphael M N,et al.,2021.Rapid decline in Antarctic Sea ice in recent years hints at future change[J].Nat Geosci,14:460-464.doi:10.1038/s41561-021-00768-3.
Edholm J M,Swart S,Plessis M D,et al.,2022.Atmospheric rivers contribute to summer surface buoyancy forcing in the Atlantic sector of the southern ocean[J].Geophys Res Lett,49(17):e00149.doi:10.1029/2022GL100149.
Espinoza V,Waliser D E,Guan B,et al.,2018.Global analysis of climate change projection effects on atmospheric rivers[J].Geophys Res Lett,45(9):4299-4308.doi:10.1029/2017gl076968.
Fahnestock M A,Abdalati W,Shuman C A,2002.Long melt seasons on ice shelves of the Antarctic Peninsula:an analysis using satellite-based microwave emission measurements[J].Ann Glaciol,34:127-133.doi:10.3189/172756402781817798.
Francis D,Mattingly K S,Temimi M,et al.,2020.On the crucial role of atmospheric rivers in the two major Weddell Polynya events in 1973 and 2017 in Antarctica[J].Sci Adv,6(46):eabc2695.doi:10.1126/sciadv.abc2695.
Francis D,Mattingly K S,Lhermitte S,et al.,2021.Atmospheric extremes caused high oceanward sea surface slope triggering the biggest calving event in more than 50 years at the Amery Ice Shelf[J].Cryosphere,15(5):2147-2165.doi:10.5194/tc-15-2147-2021.
Gorodetskaya I V,Tsukernik M,Claes K,et al.,2014.The role of atmospheric rivers in anomalous snow accumulation in East Antarctica[J].Geophys Res Lett,41(17):6199-6206.doi:10.1002/2014GL060881.
Gorodetskaya I V,Silva T,Schmithüsen H,et al.,2020.Atmospheric river signatures in radiosonde profiles and reanalyses at the dronning maud land coast,East Antarctica[J].Adv Atmos Sci,37(5):455-476.doi:10.1007/s00376-020-9221-8.
Guan B,Waliser D E,2015.Detection of atmospheric rivers:evaluation and application of an algorithm for global studies[J].J Geophys Res:Atmos,120(24):12,514-12,535.doi:10.1002/2015JD024257.
Hepworth E,Messori G,Vichi M,2022.Association between extreme atmospheric anomalies over Antarctic Sea ice,Southern Ocean polar cyclones and atmospheric rivers[J].J Geophys Res:Atmos,127(7):e2021JD036121.
Hu X M,Sejas S,Cai M,et al.,2019.Atmospheric dynamics footprint on the January 2016 ice sheet melting in West Antarctica[J].Geophys Res Lett,46:2829-2835.doi:10.1029/2018GL081374.
Ionita M,Scholz P,Grosfeld K,et al.,2018.Moisture transport and Antarctic Sea ice:Austral spring 2016 event[J].Earth Syst Dyn,9(3):939-954.doi:10.5194/esd-9-939-2018.
Jena B,Bajish C C,Turner J,et al.,2022.Record low sea ice extent in the Weddell Sea,Antarctica in April/May 2019 driven by intense and explosive polar cyclones[J].NPJ Clim Atmos Sci,5:19.doi:10.1038/s41612-022-00243-9.
Lamjiri M A,Dettinger M D,Ralph F M,et al.,2017.Hourly storm characteristics along the U.S. West Coast:role of atmospheric rivers in extreme precipitation[J].Geophys Res Lett,44(13):7020-7028.doi:10.1002/2017gl074193.
Lavers D A,Villarini G,2013.The nexus between atmospheric rivers and extreme precipitation across Europe[J].Geophys Res Lett,40(12):3259-3264.doi:10.1002/grl.50636.
Lenaerts J T M,Medley B,van den Broeke M R,et al.,2019.Observing and modeling ice sheet surface mass balance[J].Rev Geophys,57(2):376-420.doi:10.1029/2018RG000622.
Leung L R,Qian Y,2009.Atmospheric rivers induced heavy precipitation and flooding in the western U.S. simulated by the WRF regional climate model[J].Geophys Res Lett,36(3):L03820.doi:10.1029/2008GL036445.
Li W Y,Wu Y T,Hu X M,2023.The processes-based attributes of four major surface melting events over the Antarctic ross ice shelf[J].Adv Atmos Sci,40(9):1662-1670.doi:10.1007/s00376-023-2287-3.
Liang K X,Wang J F,Luo H,et al.,2023.The role of atmospheric rivers in Antarctic sea ice variations[J].Geophys Res Lett,50(8):e2022GL102588.doi:10.1029/2022gl102588.
Liu J P,Zhu Z,Chen D K,2023.Lowest Antarctic sea ice record broken for the second year in a row[J].Ocean-Land-Atmos Res,2.doi:10.34133/olar.0007.
MacLennan M L,Lenaerts J T M,Shields C,et al.,2022.Contribution of atmospheric rivers to Antarctic precipitation[J].Geophys Res Lett,49(18):e2022GL100585.doi:10.1029/2022gl100585.
MacLennan M L,Lenaerts J T M,Shields C A,et al.,2023.Climatology and surface impacts of atmospheric rivers on West Antarctica[J].Cryosphere,17(2):865-881.doi:10.5194/tc-17-865-2023.
Marsland S J,Church J A,Bindoff N L,et al.,2007.Antarctic coastal polynya response to climate change[J].J Geophys Res:Oceans,112(C7):C07009.doi:10.1029/2005JC003291.
Newell R E,Newell N E,Zhu Y,et al.,1992.Tropospheric rivers?:a pilot study[J].Geophys Res Lett,19(24):2401-2404.doi:10.1029/92gl02916.
Nicolas J P,Bromwich D H,2011.Climate of West Antarctica and influence of marine air intrusions[J].J Climate,24(1):49-67.doi:10.1175/2010JCLI3522.1.
Nicolas J P,Bromwich D H,2014.New reconstruction of Antarctic near-surface temperatures:multidecadal trends and reliability of global reanalyses[J].J Climate,27(21):8070-8093.doi:10.1175/JCLI-D-13-00733.1.
Park C,Son S W,Kim H,2021.Distinct features of atmospheric rivers in the early versus late East Asian summer monsoon and their impacts on monsoon rainfall[J].J Geophys Res:Atmos,126(7):e2020JD033537.doi:10.1029/2020JD033537.
Pohl B,Favier V,Wille J,et al.,2021.Relationship between weather regimes and atmospheric rivers in East Antarctica[J].J Geophys Res:Atmos,126(24):e2021JD035294.doi:10.1029/2021jd035294.
Ralph F M,Neiman P J,Wick G A,2004.Satellite and CALJET aircraft observations of atmospheric rivers over the eastern North Pacific Ocean during the winter of 1997/98[J].Mon Wea Rev,132(7):1721-1745.doi:10.1175/1520-0493(2004)132<1721:sacaoo>2.0.co;2.
Ralph F M,Neiman P J,Wick G A,et al.,2006.Flooding on Californias Russian River:role of atmospheric rivers[J].Geophys Res Lett,33(13):L13801.doi:10.1029/2006gl026689.
Ralph F M,Iacobellis S F,Neiman P J,et al.,2017.Dropsonde observations of total integrated water vapor transport within North Pacific atmospheric rivers[J].J Hydrometeorol,18(9):2577-2596.doi:10.1175/JHM-D-17-0036.1.
Reid P,Massom R A,2015.Successive Antarctic sea ice extent records during 2012,2013,and 2014[J].Bull Amer Meteor Soc,96(7):S163-S164.
Rignot E,Jacobs S,Mouginot J,et al.,2013.Ice-shelf melting around Antarctica[J].Science,341(6143):266-270.doi:10.1126/science.1235798.
Riihel A,Bright R M,Anttila K,2021.Recent strengthening of snow and ice albedo feedback driven by Antarctic sea-ice loss[J].Nat Geosci,14:832-836.doi:10.1038/s41561-021-00841-x.
Scambos T A,Hulbe C,Fahnestock M,et al.,2000.The link between climate warming and break-up of ice shelves in the Antarctic Peninsula[J].J Glaciol,46(154):516-530.doi:10.3189/172756500781833043.
Shepherd A,Ivins E,Rignot E,et al.,2018.Mass balance of the Antarctic ice sheet from 1992 to 2017[J].Nature,558(7709):219-222.
Shields C A,Wille J D,Marquardt Collow A B,et al.,2022.Evaluating uncertainty and modes of variability for Antarctic atmospheric rivers[J].Geophys Res Lett,49(16):e2022GL099577.doi:10.1029/2022gl099577.
Simmonds I,2015.Comparing and contrasting the behaviour of Arctic and Antarctic sea ice over the 35 year period 1979—2013[J].Ann Glaciol,56(69):18-28.doi:10.3189/2015AoG69A909.
Terpstra A,Gorodetskaya I V,Sodemann H,2021.Linking sub-tropical evaporation and extreme precipitation over East Antarctica:an atmospheric river case study[J].J Geophys Res Atmos,126(9):e2020JD033617.doi:10.1029/2020JD033617.
Trusel L D,Frey K E,Das S B,et al.,2015.Divergent trajectories of Antarctic surface melt under two twenty-first-century climate scenarios[J].Nat Geosci,8:927-932.doi:10.1038/ngeo2563.
Turner J,Hosking J S,Phillips T,et al.,2013.Temporal and spatial evolution of the Antarctic sea ice prior to the September 2012 record maximum extent[J].Geophys Res Lett,40(22):5894-5898.doi:10.1002/2013gl058371.
Turner J,Lu H,King J,et al.,2021.Extreme temperatures in the Antarctic[J].J Climate,34(7):2653-2668.
Turner J,Lu H,King J C,et al.,2022.An extreme high temperature event in coastal East Antarctica associated with an atmospheric river and record summer downslope winds[J].Geophys Res Lett,49(4):e97108.doi:10.1029/2021GL097108.
van den Broeke M,2005.Strong surface melting preceded collapse of Antarctic Peninsula ice shelf[J].Geophys Res Lett,32(12).doi:10.1029/2005gl023247.
Waliser D,Guan B,2017.Extreme winds and precipitation during landfall of atmospheric rivers[J].Nat Geosci,10(3):179-183.doi:10.1038/ngeo2894.
Wang S,Ding M H,Liu G,et al.,2023a.New record of explosive warmings in East Antarctica[J].Sci Bull,68(2):129-132.doi:10.1016/j.scib.2022.12.013.
Wang S,Liu J P,Cheng X,et al.,2023b.Contribution of the deepened Amundsen Sea low to the record low Antarctic Sea ice extent in February 2022[J].Environ Res Lett,18(5):054002.doi:10.1088/1748-9326/acc9d6.
Wille J D,Favier V,Dufour A,et al.,2019.West Antarctic surface melt triggered by atmospheric rivers[J].Nat Geosci,12:911-916.doi:10.1038/s41561-019-0460-1.
Wille J D,Favier V,Gorodetskaya I V,et al.,2021.Antarctic atmospheric river climatology and precipitation impacts[J].J Geophys Res:Atmos,126(8):8476.doi:10.1029/2020jd033788.
Wille J D,Favier V,Jourdain N C,et al.,2022.Intense atmospheric rivers can weaken ice shelf stability at the Antarctic Peninsula[J].Commun Earth Environ,3:90.doi:10.1038/s43247-022-00422-9.
Xu G Z,Ma X H,Chang P,et al.,2020.Image-processing-based atmospheric river tracking method version 1 (IPART-1)[J].Geosci Model Dev,13(10):4639-4662.doi:10.5194/gmd-13-4639-2020.
Xu M,Yu L J,Liang K X,et al.,2021.Dominant role of vertical air flows in the unprecedented warming on the Antarctic Peninsula in February 2020[J].Commun Earth Environ,2:133.doi:10.1038/s43247-021-00203-w.
Zhang L,Ren X Y,Wang C Y,et al.,2023.An observational study on the interactions between storm tracks and sea ice in the Southern Hemisphere[J].Clim Dyn.doi:10.1007/s00382-023-06894-5.
Zhu Y,Newell R E,1994.Atmospheric rivers and bombs[J].Geophys Res Lett,21(18):1999-2002.doi:10.1029/94gl01710.
Zhu Y,Newell R E,1998.A proposed algorithm for moisture fluxes from atmospheric rivers[J].Mon Wea Rev,126(3):725.doi:10.1175/1520-0493(1998)1260725:APAFMF>2.0.CO;2.
Zou X,Bromwich D H,Montenegro A,et al.,2021.Major surface melting over the Ross Ice Shelf part Ⅱ:surface energy balance[J].Quart J Roy Meteor Soc,147(738):2895-2916.doi:10.1002/qj.4105.
·ARTICLE·
The impacts of atmospheric rivers on Antarctic ice sheet and sea ice
LIANG Kaixin1,2,WANG Jinfei1,2,YANG Qinghua1,2,HU Xiaoming1,2,LIU Jiping1,2
1School of Atmospheric Sciences,Sun Yat-sen University,Zhuhai 519082,China;
2Southern Marine Science and Engineering Guangdong Laboratory (Zhuhai),Zhuhai 519082,China
Abstract Atmospheric rivers (ARs) are characterized as long,narrow,and transient channels of strong horizontal water vapor transport.Previous studies have primarily focused on their impact on mid-latitudes,emphasizing the potential risks of deleterious hazards and financial losses.However,less attention has been given to ARs in the Antarctic region,despite they account for over 90% of moisture transport into the high latitudes.
ARs typically originate in the robust poleward meridional transport flank within ridges (blocking highs) and explosive extratropical cyclones in the Antarctic region,facilitating the substantial moisture transport through a vigorous low-level jet.Three widely-used metrics for characterizing the moisture intrusion state are integrated water vapor,v-component of integrated water vapor and integrated water vapor.An AR is detected when the enclosed shape of the extremely high moisture intrusion path is adequately elongated.The frequency of ARs varies across different AR detection algorithms based on diverse metrics and distinct extremity thresholds.
The annual frequency of ARs decreases with latitude,exhibiting a zonally asymmetric pattern that show higher seasonal frequencies in austral winter and spring.These spatial and temporal features are shaped by the geographical environment and the distribution of synoptic systems in the Antarctic region.The annual variability of AR frequency appears to be associated with dominant atmospheric modes in southern high latitudes,such as the Southern Annular Mode.Additionally,it is also modulated by the natural variability of sea surface temperature modes,including El Nio Southern Oscillation and Indian Ocean Dipole.
ARs have significant impacts on the Antarctic ice sheet and sea ice.ARs contribute both positively and negatively to the Antarctic ice sheet.On one hand,the intense snowfall during ARs constitutes a major portion of the total precipitation over the ice sheet,favoring its mass gain.Conversely,warm-moist air intrusions accompanying ARs induce surface melting and extremely high temperatures due to foehn winds and anomalously high net surface energy flux.Moreover,surface meltwater during ARs promotes hydraulic fracturing on the ice shelves and trigger their disintegration by removing sea ice through strong winds.These processes pose a substantial threat to the ice sheet mass balance.Meanwhile,the warm-moist air and strong winds during ARs thermodynamically and dynamically reduce sea ice.ARs lead to anomalously high temperatures and net surface heat flux,intensifying sea ice thermodynamically melting,especially in winter.The strong winds dynamically drift the sea ice onshore,accelerating ice breaking through powerful waves and further enhancing lateral melting.
Though ARs in the Antarctic region have been subject to various analyses,certain questions persist.The evaluation on ARs impact on Antarctic ice sheet and sea ice remain contingent on the chosen detection algorithm,necessitating the development of a more universal and robust approach.Implementing machine learning to extract the spatial and temporal features of ARs could offer such an approach.Moreover,although the fact that most liquid precipitation is attributed to ARs,its influence on the ice sheet and sea ice is often overlooked,despite its potential to enhance melting and destabilize ice shelves.In addition,ARs may exert a profound influence on the ocean,subsequently providing feedback to the atmosphere.However,the interaction between ARs and the Southern Ocean is not well understood.Therefore,further research imperative to elucidate these mechanisms and evaluate the future changes in Antarctic ice sheet mass balance and sea ice influenced by ARs.
Keywords Atmospheric river;Antarctic;ice sheet;sea ice
doi:10.13878/j.cnki.dqkxxb.20230916001
(責任编辑:张福颖)