Anthropogenic Influence on Decadal Changes in Concurrent Hot and Dry Events over China around the Mid-1990s※
2024-04-11QinSUBuwenDONGFangxingTIANandNicholasKLINGAMAN
Qin SU,Buwen DONG,Fangxing TIAN,and Nicholas P.KLINGAMAN
1Yunnan Key Laboratory of Meteorological Disasters and Climate Resources in the Great Mekong Subregion,Yunnan University, Kunming 650500, China
2Department of Atmospheric Sciences, Yunnan University, Kunming 650500, China
3National Centre for Atmospheric Science,Department of Meteorology,University of Reading,Reading,RG6 6BB,UK
4Geofysisk Institut, University of Bergen, Bergen 5007, Norway
5Citadel Investment Group,Moor House,120 London Wall,London,RG6 6BB,UK
ABSTRACT The frequency and duration of observed concurrent hot and dry events (HDEs) over China during the growing season(April-September) exhibit significant decadal changes across the mid-1990s.These changes are characterized by increases in HDE frequency and duration over most of China,with relatively large increases over southeastern China (SEC),northern China (NC),and northeastern China (NEC).The frequency of HDEs averaged over China in the present day (PD,1994-2011) is double that in the early period (EP,1964-81);the duration of HDEs increases by 60%.Climate experiments with the Met Office Unified Model (MetUM-GOML2) are used to estimate the contributions of anthropogenic forcing to HDE decadal changes over China.Anthropogenic forcing changes can explain 60%-70% of the observed decadal changes,suggesting an important anthropogenic influence on HDE changes over China across the mid-1990s.Single-forcing experiments indicate that the increase in greenhouse gas (GHG) concentrations dominates the simulated decadal changes,increasing the frequency and duration of HDEs throughout China.The change in anthropogenic aerosol (AA) emissions significantly decreases the frequency and duration of HDEs over SEC and NC,but the magnitude of the decrease is much smaller than the increase induced by GHGs.The changes in HDEs in response to anthropogenic forcing are mainly due to the response of climatological mean surface air temperatures.The contributions from changes in variability and changes in climatological mean soil moisture and evapotranspiration are relatively small.The physical processes associated with the response of HDEs to GHG and AA changes are also revealed.
Key words: concurrent hot and dry events,decadal variation,greenhouse gases,aerosol emissions
1.Introduction
Flash droughts are rapidly developing extreme dry events on subseasonal to seasonal scales,accompanied by abnormally high temperatures (Svoboda et al.,2002).Though different from conventional,slowly evolving droughts,flash droughts also have devastating impacts on ecosystem productivity,food security,and water supply(Yuan et al.,2015;Lesk et al.,2016;Zhang and Yuan,2020),and can cause substantial economic losses (Wallander et al.,2013).For example,the extreme flash drought event over South China in the autumn of 2019 affected crop productivity in an area of 2.35 million hectares,led to water shortages for residents and livestock,and caused an economic loss of 15.08 billion yuan (Wang et al.,2020).
Flash droughts are categorized into two types according to their causes: heatwave and precipitation-deficit flash droughts (Wang and Yuan,2018).Heatwave flash droughts are driven by high surface air temperature anomalies,which lead to sharp increases in evapotranspiration and rapid reductions in soil moisture (Otkin et al.,2015;Ford and Labosier,2017;Wang and Yuan,2018).Heatwave flash droughts are also named concurrent hot and dry extreme events (HDEs;Zhang et al.,2019;Tian et al.,2021).These compound extreme events are always related to more severe heatwaves with higher intensity and longer duration than hot extremes only (Shi et al.,2021).HDEs have become more frequent worldwide owing to more frequent temperature extremes in a warming climate (Hao et al.,2013;Wu et al.,2022),thereby raising the risk of disaster and exposure of populations (Liu et al.,2021).HDE occurrence in China increased by 109% from 1979 to 2010,with warming temperatures being the main contributor to this increase (Wang et al.,2016;Zhang et al.,2022).The population exposure to HDEs in East China more than doubled after the late 1990s(Yu and Zhai,2020).
There are significant decadal changes in high temperature extremes and heatwaves over China across the mid-1990s in observations,including a rapid increase in frequency(Chen and Dong,2019;Su and Dong,2019).Thus,it is important to understand whether these decadal changes in heat extremes affect decadal changes in HDEs across the mid-1990s,as well as the mechanisms of these decadal changes.Previous studies have revealed the driving processes of HDEs over China (Tian et al.,2021).For instance,it has been demonstrated that subsidence anomalies,associated with the Silk Road pattern and the boreal summer intraseasonal oscillation,are responsible for the occurrence of HDEs over China (Tian et al.,2021;Liu and Zhou,2021).The trends (Wang et al.,2016;Zhang et al.,2019) and prediction performance (Yuan et al.,2019;Zhang et al.,2019;Wu et al.,2021) have also been investigated.However,the decadal changes in and drivers responsible for these changes have not been explored.Therefore,this work aims to investigate the decadal changes in HDEs over China,explore the drivers of those changes,and understand the physical processes that link those drivers to HDE changes.
Modeling results suggest that the response to anthropogenic forcing plays a dominant role in the decadal changes in the East Asian summer monsoon (EASM),temperature extremes,and heatwaves over China across the mid-1990s (Tian et al.,2018;Chen and Dong,2019;Su and Dong,2019).Both the changes in greenhouse gas (GHG) concentrations and anthropogenic aerosol (AA) emissions make significant contributions.However,the physical mechanisms associated with the response to GHG and AA changes differ.The increased GHG concentrations have enhanced the southern part of the EASM circulation (Lau and Kim,2017;Lau et al.,2017) and increased the frequency and intensity of heatwaves over China (Su and Dong,2019).The increased AA emissions have weakened the EASM circulation and rainfall(Tian et al.,2018),increased the frequency and intensity of daytime heatwaves over northeastern China,and decreased them over southeastern China (Su and Dong,2019).Wu et al.(2022) suggested that anthropogenic forcings have contributed a lot to the variability of HDEs over China in recent decades.Thus,this study investigates the individual roles of anthropogenic forcings in decadal changes in HDEs over China,including the associated physical processes.
The structure of this paper is as follows.The decadal changes in HDEs over China in observations are presented in section 2.Section 3 describes the model and experiments.The HDE changes in response to anthropogenic forcing are assessed in section 4.The associated physical processes are illustrated in section 5.Conclusions are summarized in section 6.
2.Observed decadal changes in concurrent hot and dry events over China
2.1.Observational and reanalysis data
Homogenized data of daily mean temperature over China are used in this study (Li et al.,2016).The daily soil moisture (SM) and evapotranspiration (ET) data are from the Japanese 55-year Reanalysis (JRA-55;Kobayashi and Iwasaki 2016).
2.2.Definition of HDEs
We adopt the same definition of HDEs as Mo and Lettenmaier (2015) and compute them from pentad data.The HDE analysis in this study is focused on the growing season(April-September),during which HDEs are most likely to occur (Hunt et al.,2009).An HDE pentad is defined when all three of the following requirements are satisfied: (1)Tano>1 Std;(2) ETano>0;(3) SM% <40%,whereTanois anomalies of surface air temperature,Std is standard deviation,ETanois anomalies of ET,and SM% is SM percentile relative to its record.For each pentad and each grid point,the standard deviation of surface air temperature,the climatological mean ET,and the SM percentile are computed based on the period 1960-2016.An HDE event consisting of one or more consecutive pentads meeting the above HDE criteria is obtained from the HDE pentad data.Frequency and duration diagnostics are applied to measure the HDE activity in each year.The frequency is obtained by accumulating the occurrence number of HDE events within a year (yr-1),noting that a single event may last more than one pentad.The duration is calculated by averaging the duration of all HDE events within a year (pentad).
2.3.Observed decadal changes
Figures 1a and b show that the frequency and duration of HDEs averaged across China abruptly increase after the mid-1990s.The decadal changes in this study are represented by the differences between a “present day” period (PD;1994-2011) and an early period (EP;1964-1981).The HDE frequency is 1.33 yr-1in PD,double the value of 0.64 yr-1in EP.The duration averaged over China increases by 60% from 0.45 pentads in EP to 0.73 pentads in PD.It is interesting to note that the frequency and duration of HDEs averaged over China are highly correlated.The correlation coefficient is 0.95.However,this interannual correlation is not discussed,because this study focuses on the decadal changes in HDEs.
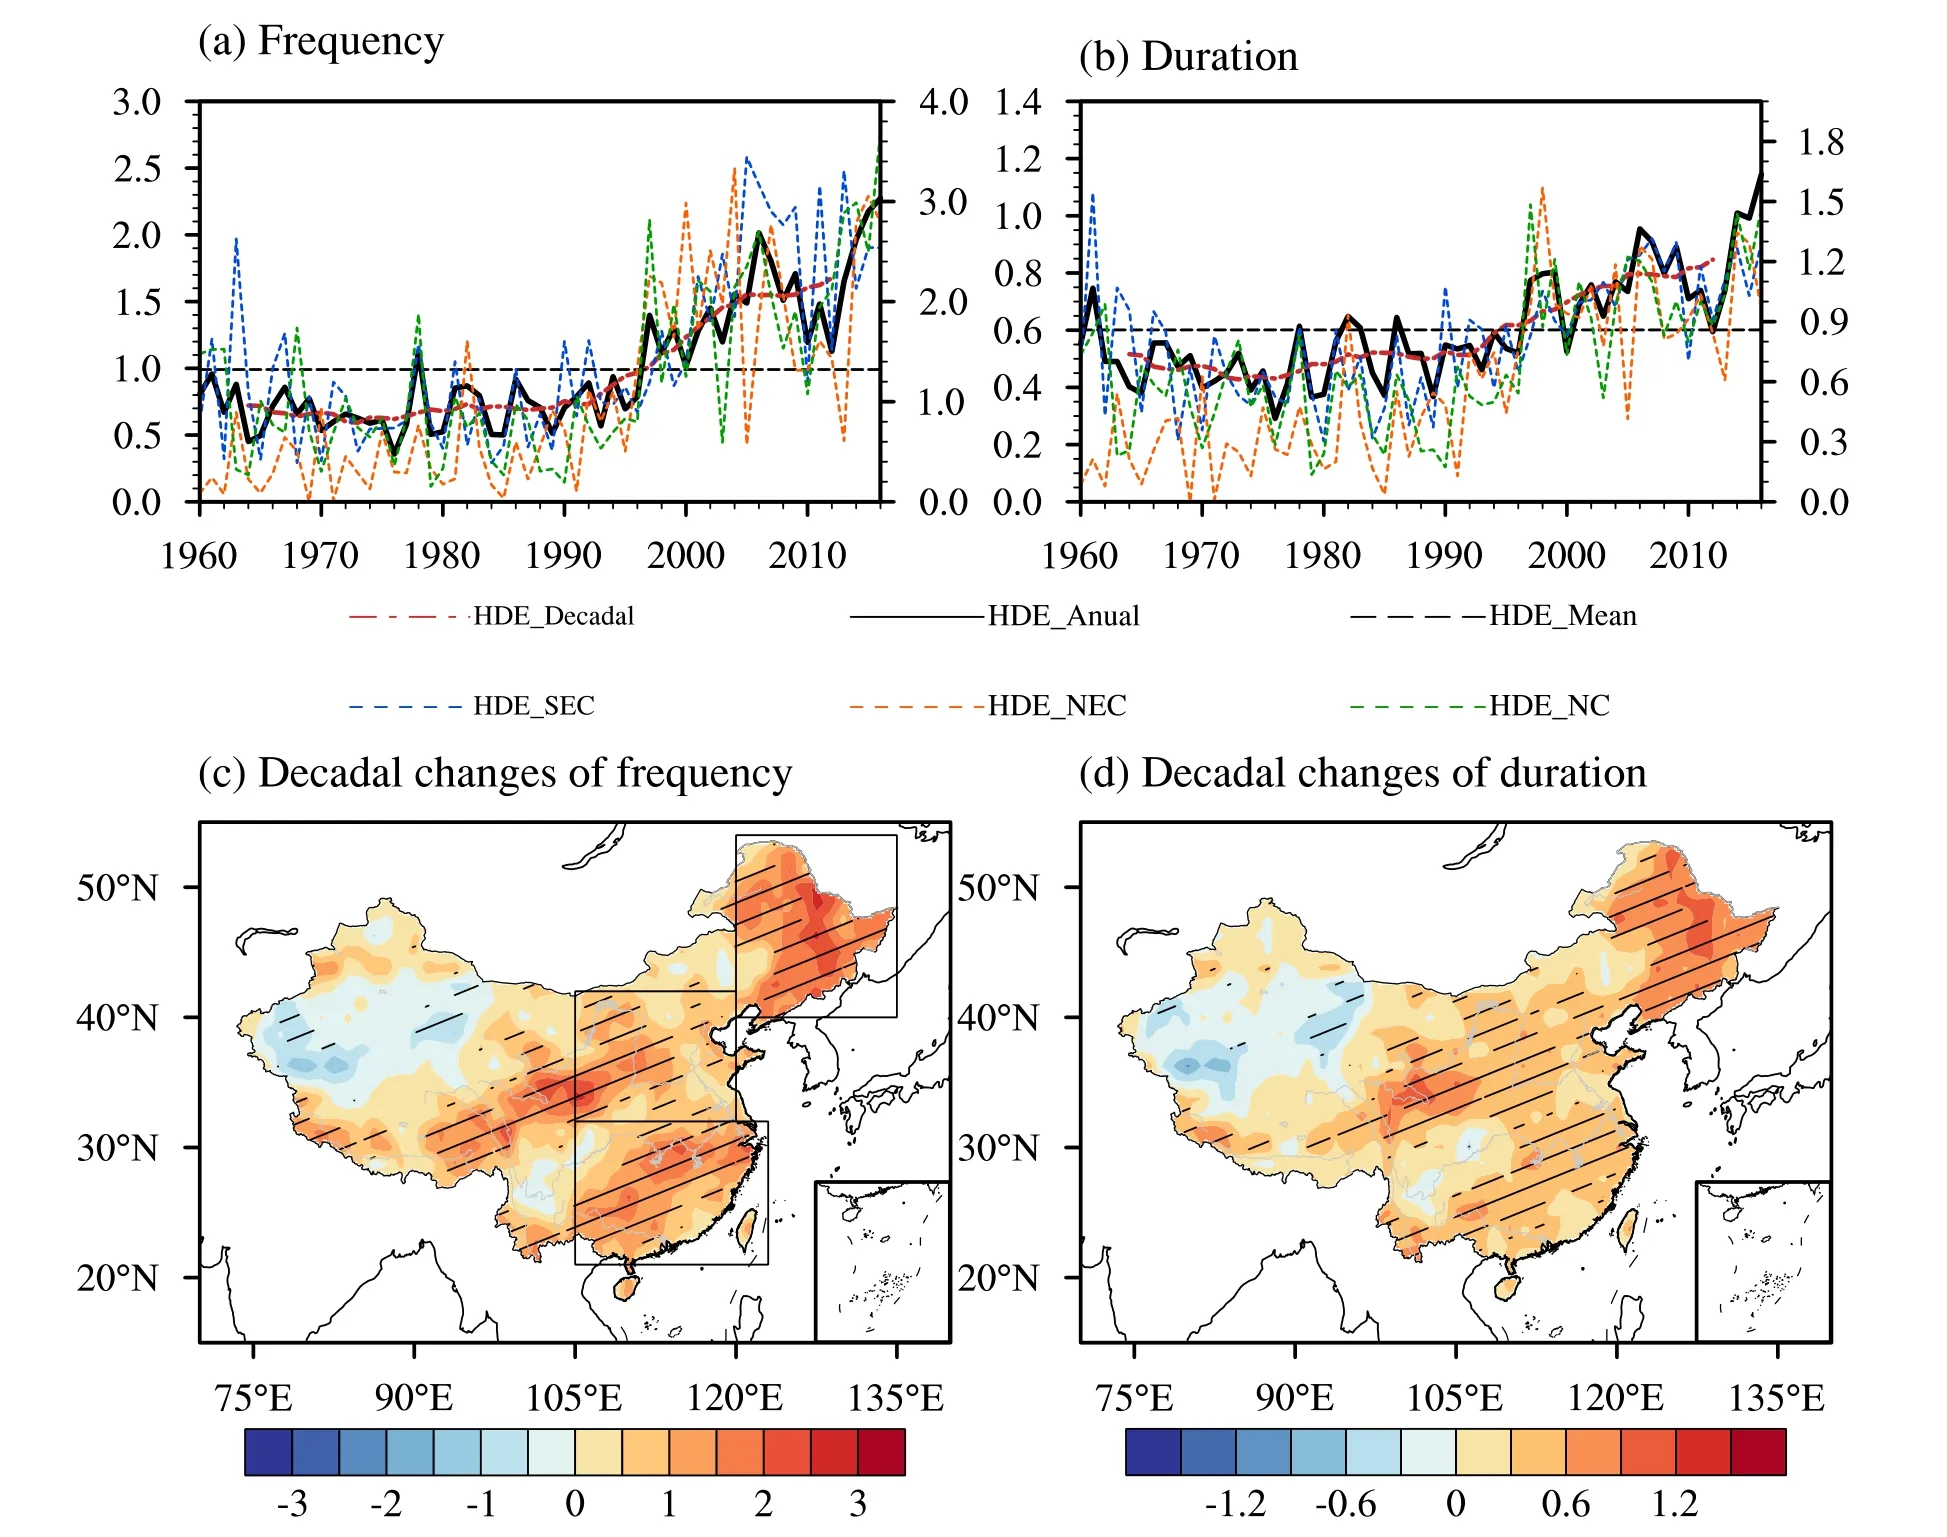
Fig.1.(a,b) Time series of area-averaged (a) frequency (units: yr-1) and (b) duration (units: pentads) of HDEs in the growing season over mainland China (black solid lines),SEC (blue dashed lines),NEC (orange dashed lines),and NC (green dashed lines).Black dashed lines in (a,b) denote the time means of area-averaged metrics.Red solid lines in (a,b) represent the decadal variations in area-averaged metrics,obtained with a 9-year running average.The black solid and dashed,as well as the red solid lines in (a,b) use the left-hand y-axis,while the dashed blue,orange and green lines use the right-hand y-axis.(c,d) Spatial patterns of differences in HDE (c) frequency (units: yr-1) and (d)duration (units: pentads) between PD and EP.The slashes in (c,d) highlight the regions where the changes are statistically significant at the 90% confidence level,based on a two-tailed Student’s t-test.The boxes in (c) represent the sub-regions of SEC,NC and NEC,respectively.
Figures 1c and d illustrate the spatial patterns of the decadal changes in HDE frequency and duration over China across the mid-1990s in observations.The spatial patterns are quite similar.The HDE frequency and duration increase over most of China,with relatively large increases over northeastern China (NEC;40°-54°N and east of 120°E),northern China (NC;32°-42°N,105°-120°E),and southeastern China (SEC;21°-32°N,east of 105°E),but decrease over northwestern China,which may be related to the increase in SM in situ (Hu et al.,2019),since HDEs are associated with increased temperature and ET and decreased SM.Among the three sub-regions in eastern China,HDEs change most dramatically over NEC,with the frequency increasing by a factor of five and the duration by a factor of three in PD compared to EP.The changes in HDE frequency and duration over NC and SEC are also remarkable,but smaller than those over NEC.The HDE frequency over NC and SEC in PD doubles that in EP;the duration over these two subregions increases by 60%-80%.Although HDEs change significantly over the Tibetan Plateau,these changes are not discussed further because the SM in JRA-55 (as well as in other reanalyses) used to define the HDEs is not reliable in this region (Xu et al.,2018).
3.Model experiments and performance
The above results indicate that HDEs over China exhibited significant decadal changes across the mid-1990s in observations.Numerical experiments are performed to estimate the contribution of anthropogenic forcing to these decadal changes,including changes in GHG concentrations and AA emissions,and to reveal the associated physical processes.
3.1.Model and experimental design
A set of numerical experiments performed by the Global Ocean Mixed Layer 2.0 configuration of the Met Office Unified Model (MetUM-GOML2;Hirons et al.,2015;Peatman and Klingaman,2018),which is an atmosphere-ocean-mixed-layer coupled model,is used to assess the contribution of the combined and individual GHG and AA forcings to the decadal changes in climate.The model is the same as that employed by Luo et al.(2019).The experimental setup [Table 1;same as Table 1 in Luo et al.(2019)]is the same as that in previous studies that investigated the decadal changes in the South Asian summer monsoon (Luo et al.,2019) and South China Sea summer monsoon (Lin et al.,2020).The decadal changes in summer precipitation over East Asia (Tian et al.,2018),temperature extremes over China (Chen and Dong,2019),and heatwaves over China (Su and Dong,2019) were investigated by performing the same experiments using an earlier configuration,MetUM-GOML1.The advantages of MetUM-GOML2 are its computational efficiency and its smaller biases in simulated sea surface temperature (SST) than coupled models with dynamic oceans.However,its lack of internal variability modes,such as El Nino-Southern Oscillation,may complicate the analysis of the response to prescribed forcing(Hirons et al.,2015;Dong et al.,2017;Luo et al.,2019).

Table 1.Summary of numerical experiments.
The HDE events in the model are defined according to the same criteria as in observations,except that the standard deviation of surface air temperature,the climatological mean ET,and SM percentile are computed based on both the C-EP and C-PD experiments.
The difference between any one of the PD experiments forced by a particular forcing and the C-EP experiment indicates the response to that forcing.The combined impact of changes in GHGs and AAs (hereafter ALL forcing),the individual impact of GHG changes (hereafter GHG forcing),and the individual impact of AA changes (hereafter AA forcing) are all examined.A two-tailed Student’st-test is applied to assess the statistical significance of the mean changes.
3.2.Model performance in simulating HDEs during PD
The HDE frequency and duration in the C-PD experiment are compared with those in observations for PD (Fig.2).In observations,the HDE frequency and duration share similar spatial patterns,with relatively high values over SEC,NC and NEC (Figs.2a and c),and relatively low values over western China.The spatial patterns of observed HDE frequency and duration are reproduced by MetUM-GOML2 (Figs.2b and d),though the frequency and duration over NC are underestimated and the duration over SEC is overestimated.The area-averaged quantities of the HDE frequency and duration across China in the C-PD experiment (1.09 yr-1and 0.61 pentads) are close to those observed (0.90 yr-1and 0.51 pentads).The simulated area-averaged HDE frequency and duration over NEC (1.68 yr-1and 0.87 pentads) and the HDE frequency over SEC (1.76 yr-1) are also similar to observations(1.56 yr-1,0.81 pentads,and 1.53 yr-1).These agreements in the spatial pattern and area-averaged HDE frequency and duration between MetUM-GOML2 and observations indicate the model can capture the main observed features of HDEs over China.
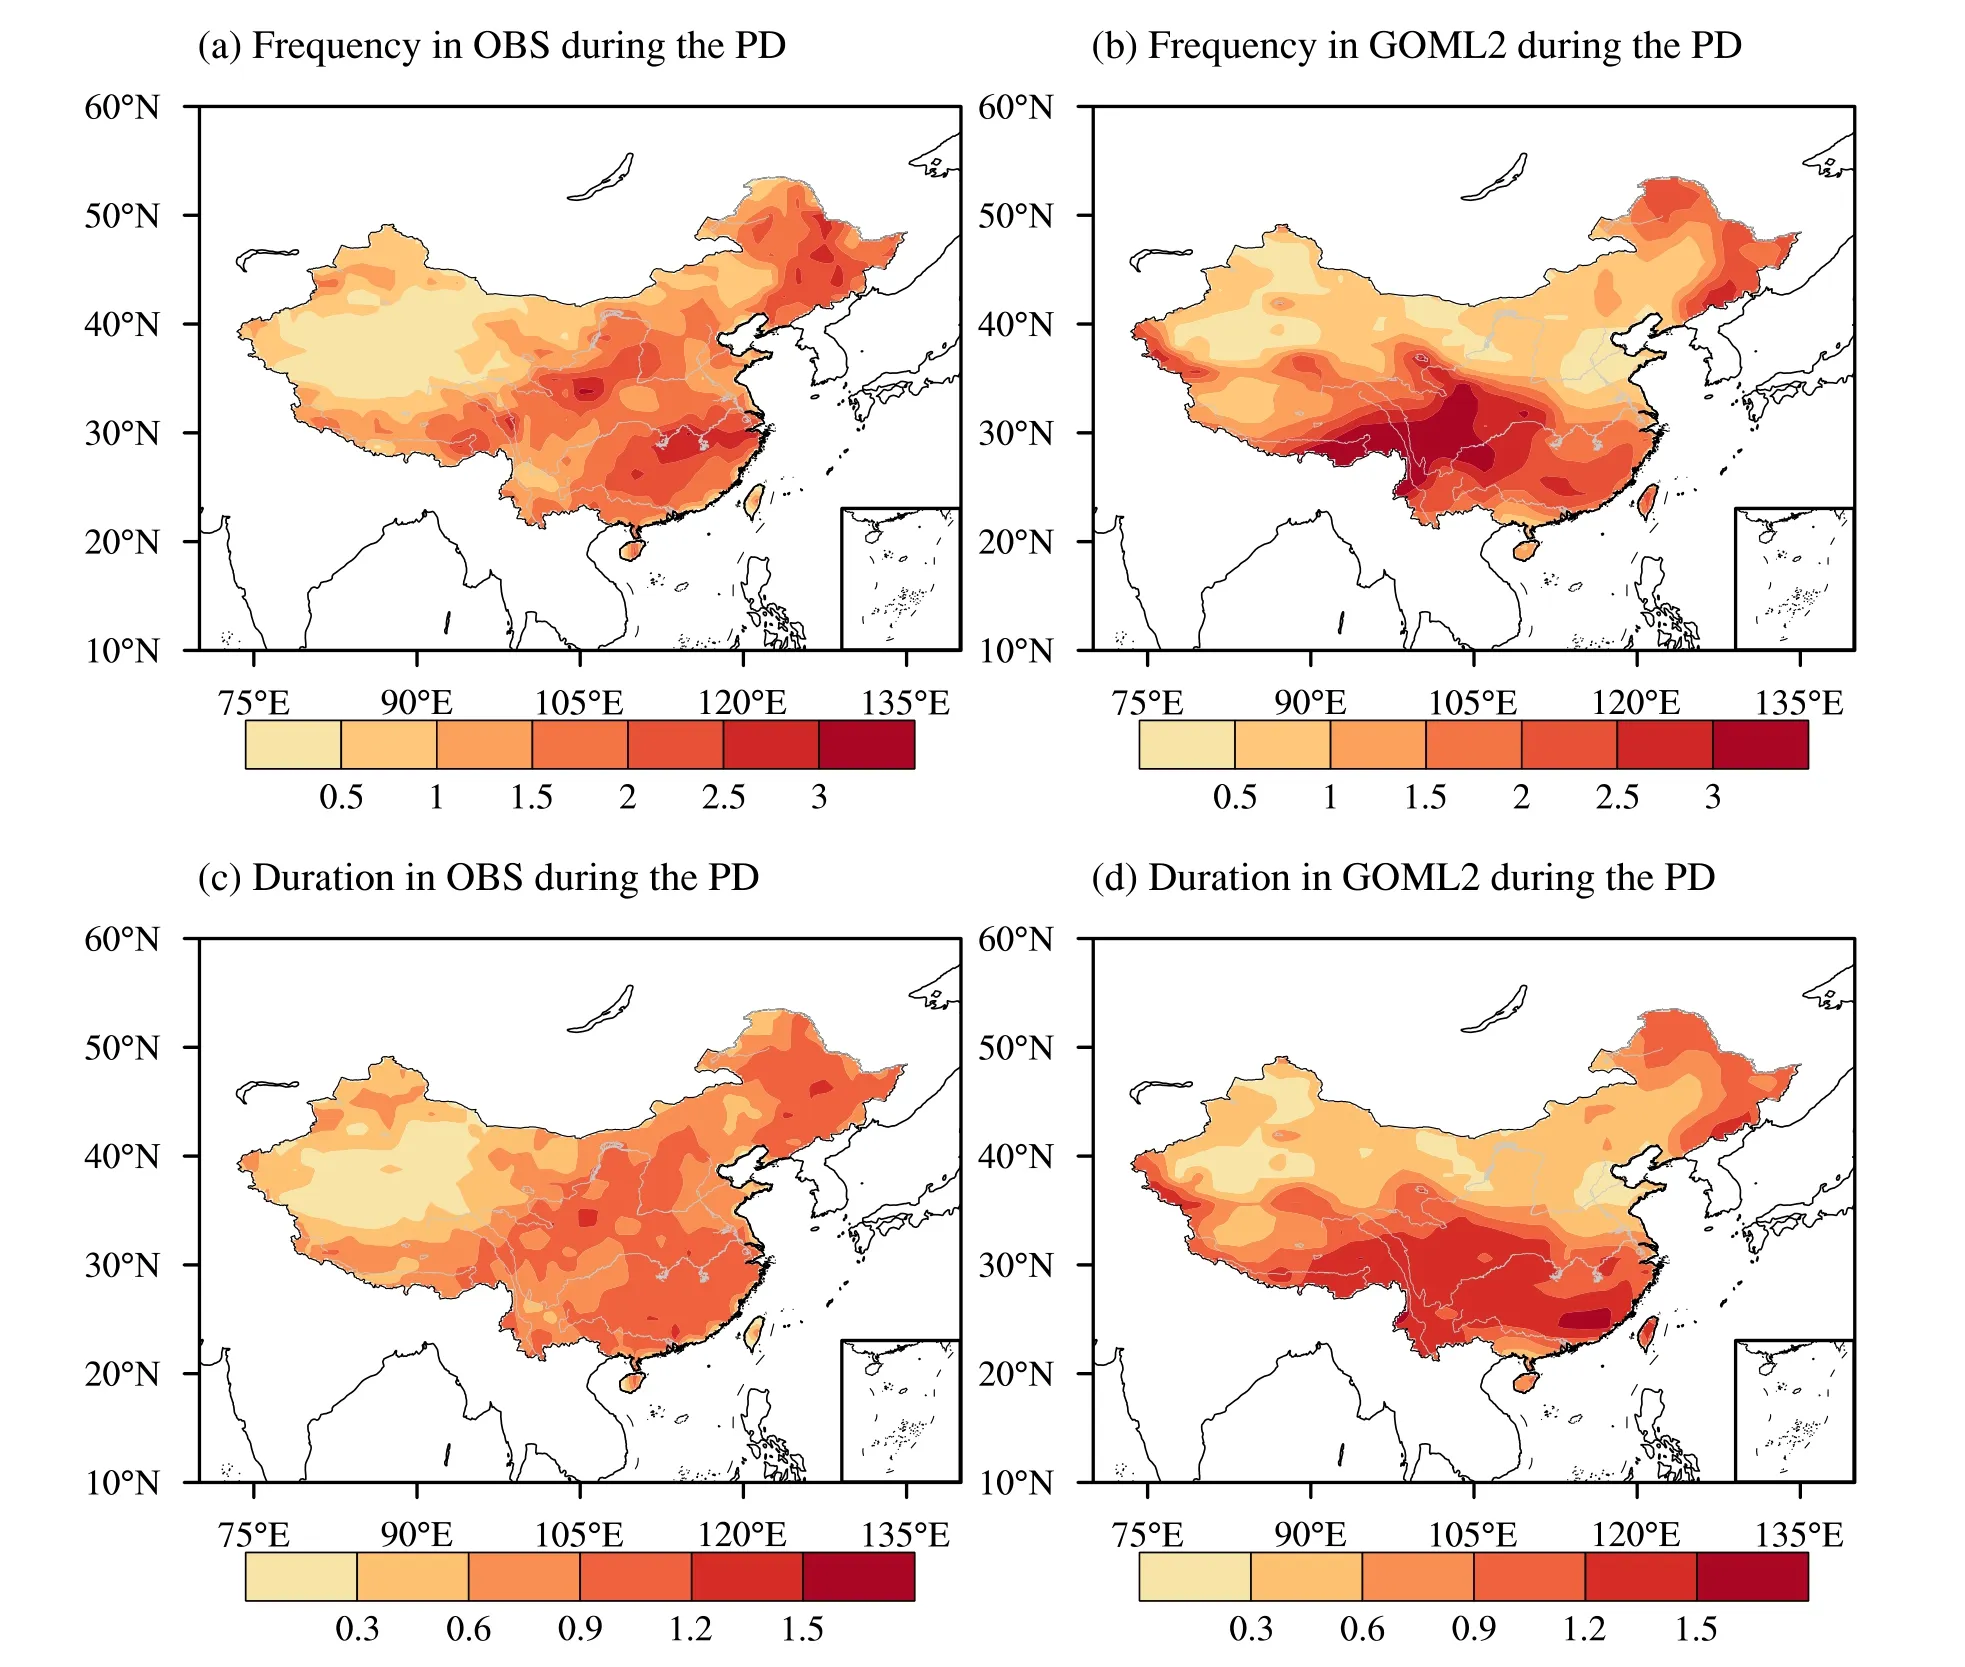
Fig.2.Climatological means of the HDE frequency (units: yr-1) and duration (units: pentads) during PD (1994-2011)in (a,c) observations and (b,d) the C-PD experiment.
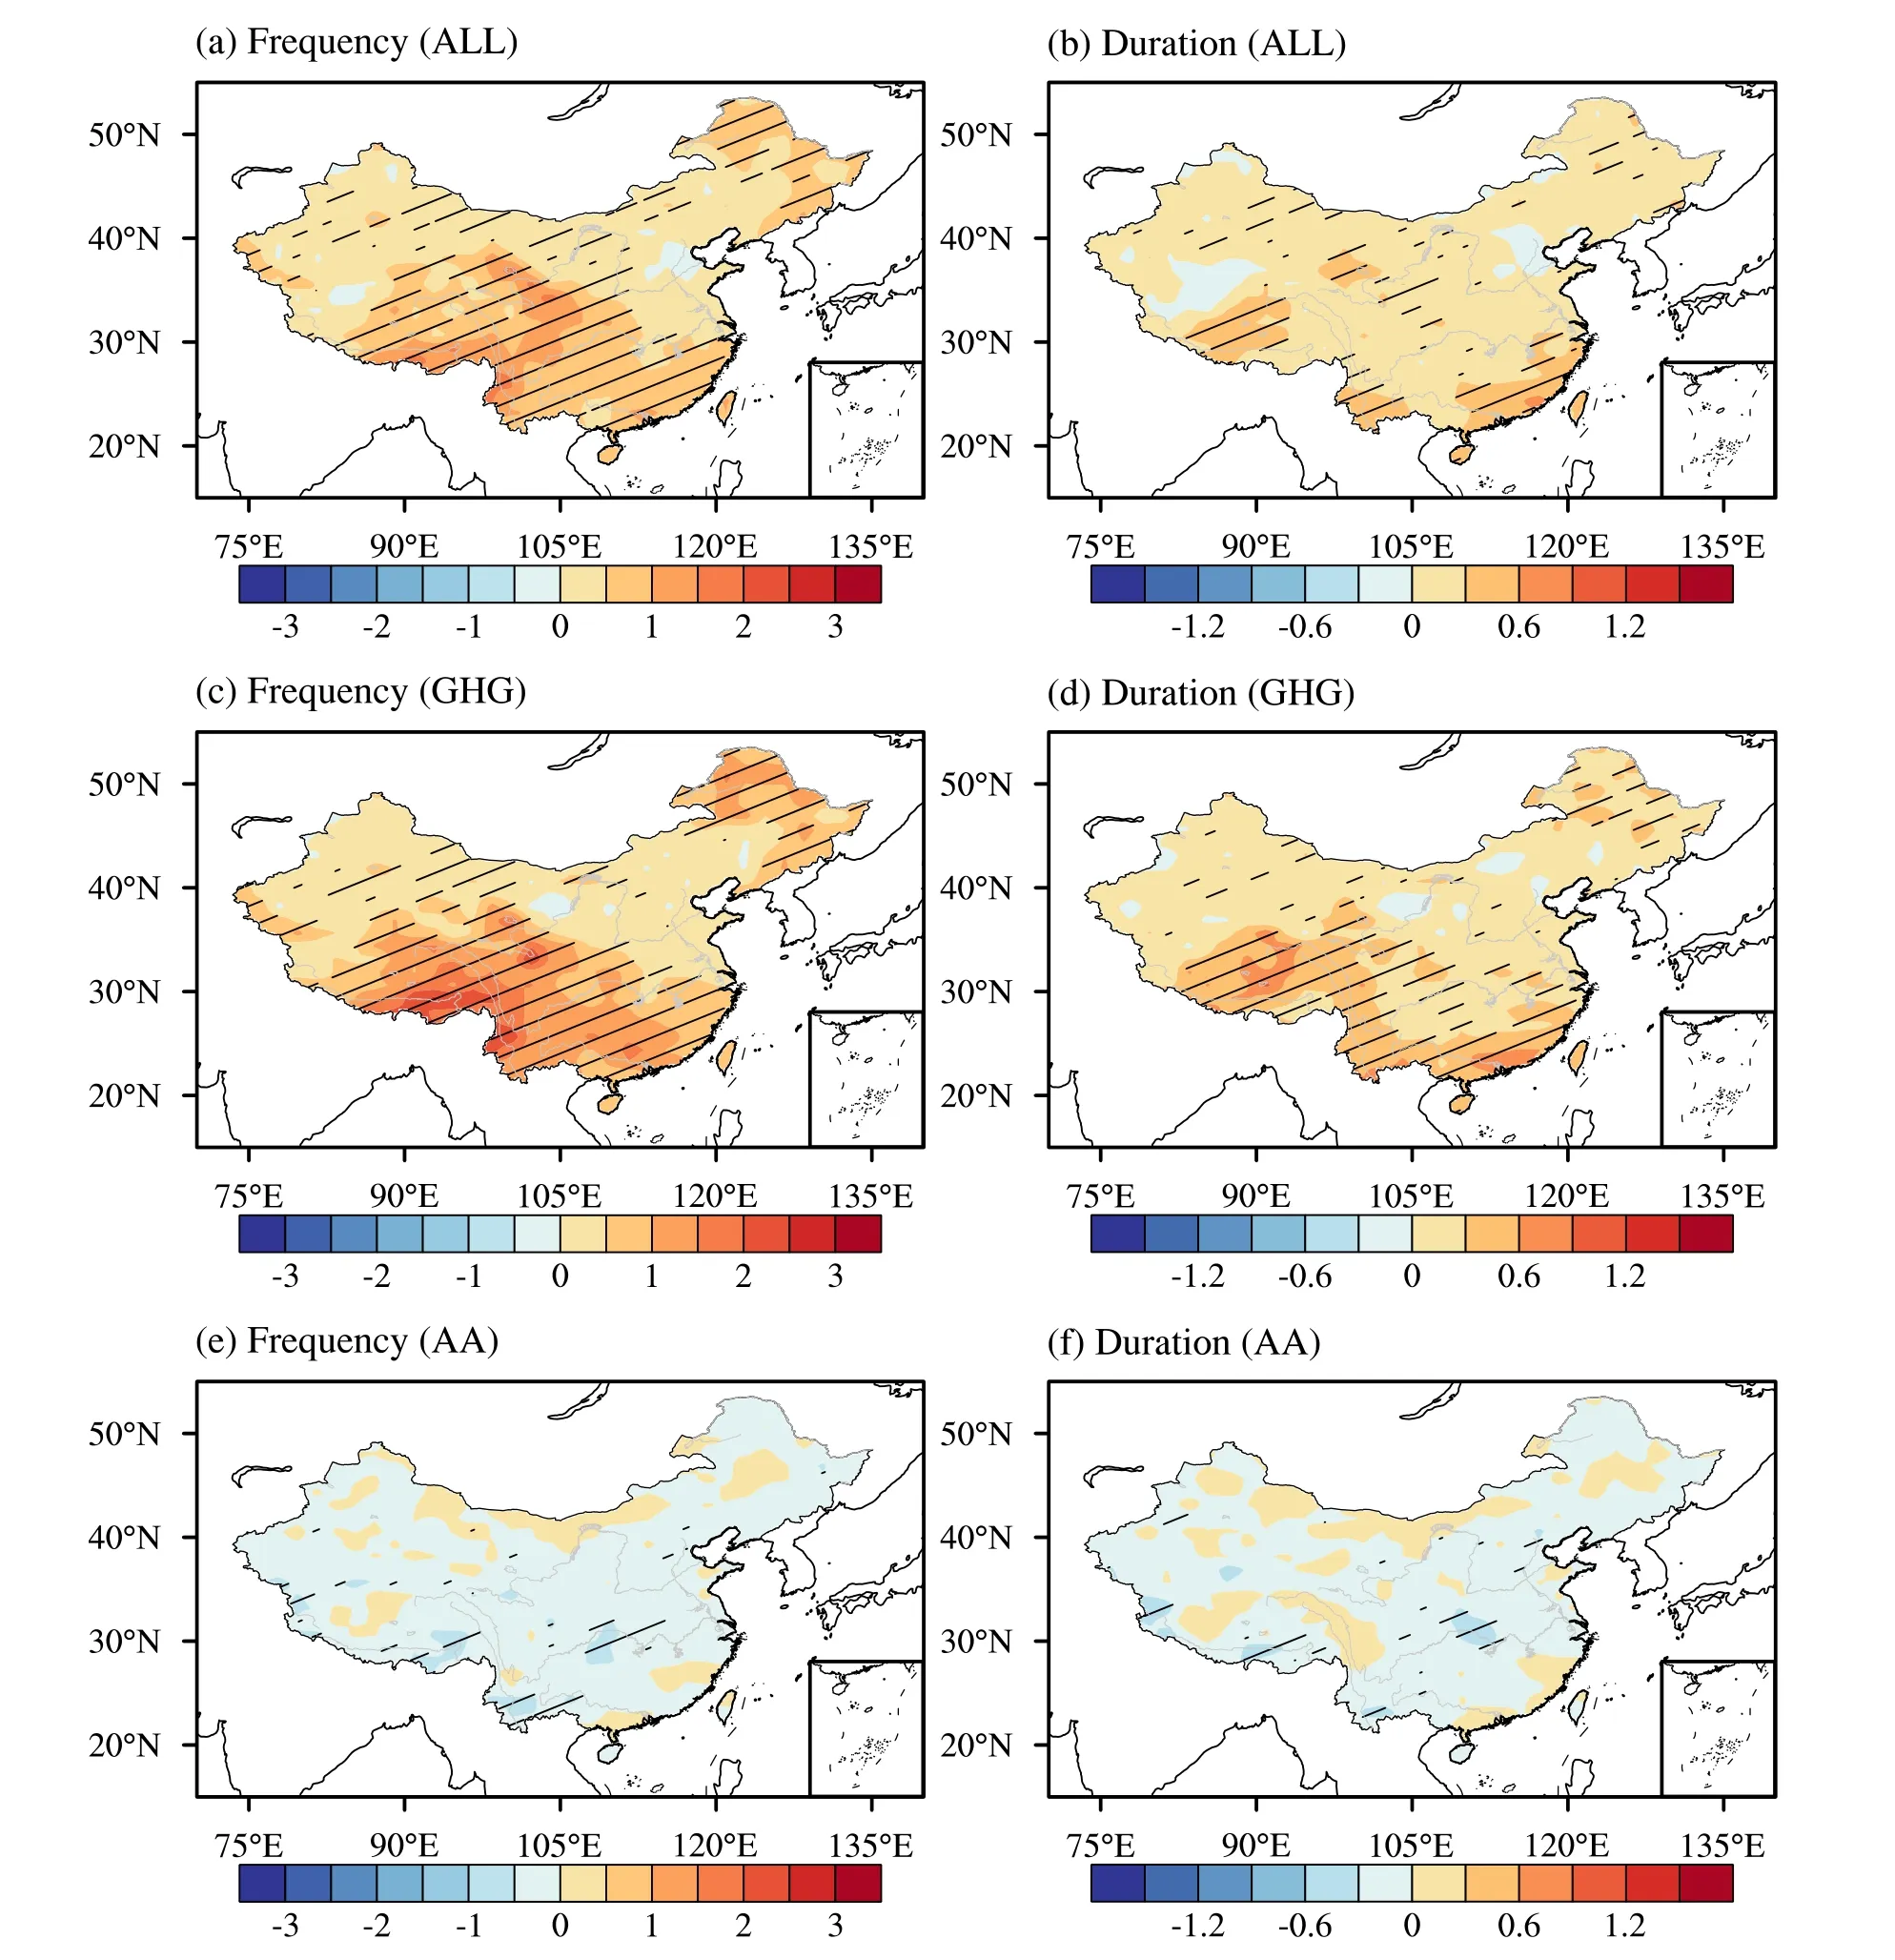
Fig.3.Spatial patterns of changes in HDE (a,c,e) frequency (units: yr-1) and (b,d,f) duration (units: pentads) in the growing season in response to changes in (a,b) ALL forcing,(c,d) GHG forcing,and (e,f) AA forcing,from EP to PD,masked by China’s boundary.The slashes highlight the regions where the differences are statistically significant at the 90% confidence level,based on a two-tailed Student’s t-test.
4.Model-simulated responses to different anthropogenic forcings
4.1.Spatial pattern of responses to different forcings
Figure 3 shows the spatial patterns of changes in HDE frequency and duration in response to different anthropogenic forcings in MetUM-GOML2 experiments.The HDE frequency and duration significantly increase over most of China in response to ALL forcing (Figs.3a and b);the changes in frequency and duration share similar spatial patterns,with relatively large increases over SEC and NEC.The ALL-forced HDE changes are consistent with the observed changes (Figs.3c and d),though the simulated response is weaker than the observed changes,especially over NC.
Comparing the changes forced by GHG and AA forcings shows that the GHG changes cause the increase in HDE frequency and duration.The spatial patterns of these changes in response to GHG forcing are similar to those in response to ALL forcing (Figs.3c and d),but the magnitude of the GHG-forced changes is slightly larger than the ALL-forced ones.The AA-forced changes are weak,but local decreases in HDE frequency and duration are significant over SEC and NC (Figs.3e and f).
4.2.Area-averaged responses to different forcings
Figure 4 illustrates the area-averaged changes in HDE frequency and duration throughout China and the three subregions of NEC,NC and SEC in observations and model experiments.The exact quantities are summarized in Table 2.The averaged responses of HDEs to ALL forcing basically agree with observations throughout China and the three sub-regions.The increases in China-averaged HDE frequency and duration in the ALL forcing experiment are 0.53 yr-1(77% of the observed 0.69 yr-1) and 0.17 pentads(61% of the observed 0.28 pentads),respectively.In the subregions,the ALL-forced changes in HDE frequency and duration over SEC are similar to observed.These results suggest that the observed decadal changes in HDE frequency and duration across the mid-1990s throughout China and over SEC can be primarily attributed to anthropogenic forcing.However,the simulated changes in frequency and duration over NC and NEC are much weaker than the observed changes.On the one hand,these regional discrepancies between model-simulated changes and observed changes might reflect model deficiencies in responses to anthropogenic forcing or a missing external forcing,such as volcanic forcing or solar forcing (e.g.,Song et al.,2014;Shim et al.,2019),which are not included in our model experiments.On the other hand,decadal SST variability,such as the Pacific Decadal Oscillation (e.g.,Qian and Zhou,2014;Zhang et al.,2020) and the Atlantic Multidecadal Oscillation (e.g.,Qian et al.,2014;Zhang et al.,2020),might also be an important factor for the observed decadal changes.These modes of variability are not simulated in MetUM-GOML2,because the model lacks ocean dynamics.

Table 2.Area-averaged HDE changes in observations and model experiments.
The GHG and AA changes have opposite effects on HDEs (Figs.3 and 4).GHG forcing increases the HDE frequency and duration across China and the three sub-regions,but AA forcing significantly decreases them,except over NC.The magnitude of GHG-forced changes is much larger than the AA-forced changes,indicating the dominant role of GHG forcing in anthropogenically forced increases in HDE frequency and duration over China.
5.Physical processes responsible for the simulated decadal changes in HDEs
5.1.Role of mean state changes in decadal changes in HDEs over China
Since HDEs vary in timescale from subseasonal to seasonal,decadal changes in HDEs could be influenced by any combination of changes in the mean state or variability of the three variables in the HDE criteria (temperature,SM,and ET).In this section,we first explore their relative contributions to the changes in HDE frequency and duration.New temperature,SM,and ET time series are constructed by adding the climatological differences between the C-PD and C-EP experiments to the time series in the C-EP experiment.The differences between the HDE properties in the newly constructed time series and those in the C-EP experiment are the changes in HDEs due to the mean state changes.The changes in HDEs due to the variability changes are the differences between the forced HDE changes and the changes in HDEs due to the mean state changes.The climatological differences between the C-PD and C-EP experiments are calculated on different timescales,such as six months (April-September),three months (April-June and July-September),and one month,to examine the sensitivity of the results to the timescale of the mean state.
Figure 5 shows the area-averaged changes in HDE frequency and duration across China and the three sub-regions due to mean state changes.These mean state changes cause increases in the China-averaged HDE frequency and duration comparable to those in the ALL forcing experiment(Figs.5a and b),indicating that the changes in HDEs in response to anthropogenic forcing are mainly due to mean state changes,not changes in variability.The changes in HDE frequency and intensity due to mean state changes on different timescales are quite similar,demonstrating that the HDE changes due to mean state changes are not very sensitive to the timescales of mean state changes (Figs.5a and b).Changes in mean temperature are responsible for most of the increase in HDE frequency and duration,while the influence of mean SM changes and mean ET changes are very weak and insignificant (Figs.5c and d).The results above suggest that,in these model experiments,anthropogenic forcing affects HDEs over China mainly through changing mean temperature.
The contributions of mean climate changes and variability changes to the observed decadal changes in HDEs are also estimated (Fig.6).In observations,it is also the mean changes that predominantly induce the decadal changes in HDEs.However,HDE changes result not only from changes in mean temperature but also from changes in mean SM and ET (Fig.6).The changes in mean temperature and ET result in the decadal changes in China-averaged HDEs.The changes in mean temperature and SM determine the decadal changes in HDEs over NEC and NC.The changes in mean temperature play an important part in the decadal changes in HDEs over SEC,while the roles of changes in mean SM and ET are also substantial.
The above results suggest that the roles of SM and ET in the HDE changes simulated by MetUM-GOML2 are very different from those observed.This inconsistency is caused by the very weak responses of both SM and ET to anthropogenic forcing simulated by the model.The smaller changes in HDEs in the ALL forcing experiment relative to the observed ones (Fig.4) are possibly also due to the weak responses of SM and ET,since the ALL-forced changes in HDE frequency and duration (Fig.5) are very close to the HDE changes only induced by the mean temperature changes in observations (Fig.6).These weak responses might be a model deficiency in response to anthropogenic forcing or missing external forcing changes,such as volcanic forcing and solar forcing (e.g.,Song et al.,2014;Shim et al.,2019),or other factors,such as the Pacific Decadal Oscillation and Atlantic Multidecadal Oscillation,which might have played a role in the observed decadal changes (e.g.,Qian and Zhou,2014;Qian et al.,2014;Zhang et al.,2020).
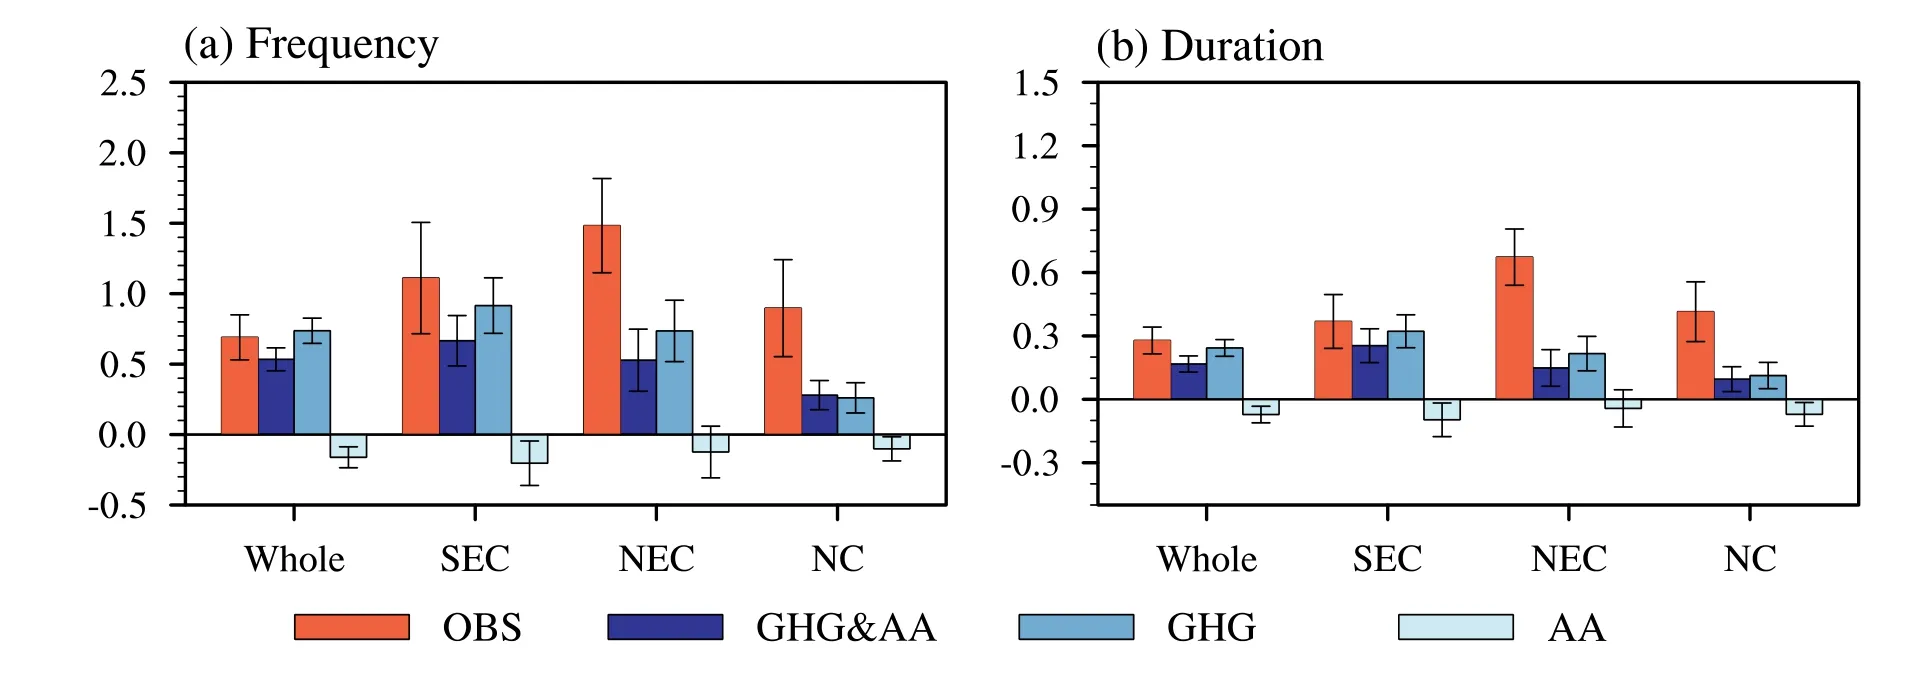
Fig.4.Area-averaged changes in HDE (a) frequency (units: yr-1) and (b) duration (units: pentads) in the growing season averaged over China,SEC,NC,and NEC,in observations and simulations forced by ALL forcing,GHG forcing,and AA forcing.The error bars indicate the 90% confidence intervals based on a two-tailed Student’s t-test.

Fig.5.Area-averaged changes in HDE (a,c) frequency (units: yr-1) and (b,d) duration (units: pentads),due to (a,b)mean changes on different timescales and (c,d) three-month mean changes in different variables,averaged over China,SEC,NC and NEC,in simulations forced by ALL forcing.The error bars indicate the 90% confidence intervals based on a two-tailed Student’s t-test.

Fig.6.Area-averaged changes in HDE (a) frequency (units: yr-1) and (b) duration (units: pentads),due to threemonth mean changes in different variables,averaged over China,SEC,NC and NEC,in observations.Red bars indicate the HDE changes due to all the mean changes in temperature,SM and ET.Orange bars indicate the HDE changes due to both mean changes in temperature and SM.Yellow bars indicate the HDE changes due to both mean changes in temperature and ET.Dark blue,sky blue and light blue bars indicate the HDE changes due to individual mean changes in temperature,SM and ET.The error bars indicate the 90% confidence intervals based on a two-tailed Student’s t-test.
5.2.Physical processes for changes induced by GHG forcing
The associated physical processes are investigated by examining the changes in the mean state.The three-month timescale is chosen to calculate the mean state changes,because the HDE changes related to the three-month mean state changes are relatively close to those in the ALL forcing experiment,compared to the one-and six-month mean state changes (Figs.4a and b).Then,the mean responses in April-May-June (AMJ) and July-August-September (JAS)are diagnosed separately.
Figure 7 illustrates the mean changes during AMJ and JAS in some key variables in response to GHG changes.The increased surface air temperature over China is related to increased downward surface longwave (LW) radiation during AMJ and JAS (Figs.7a and b),via the enhanced Greenhouse Effect and related feedbacks associated with the GHG-induced increases in atmospheric water vapor(Figs.7c and d).
The relatively large increase in the downward surface LW radiation over NC during AMJ and over SEC during JAS are both related to the increase in atmospheric water vapor (Figs.7c and d).During AMJ,the increased water vapor over NC results from more moisture transport from the ocean via the easterly and southeasterly anomalies over NC (Fig.7e).These easterly and southeasterly anomalies are associated with the anticyclonic circulation anomalies centered over NEC,likely resulting from the East Asia/Pacific teleconnection exerted by positive precipitation anomalies over the Philippine Sea (Huang and Sun,1992) due to local warmer SSTs (not shown) and enhanced convection characterized by increased cloud cover and decreased surface shortwave (SW) radiation (Figs.7g and h).During JAS,the increased atmospheric water vapor over SEC (Fig.7d) can be attributed to more moisture transport from the South China Sea to SEC,which is partly due to increased evaporation under a warming climate and partly due to anomalous moisture transport via the southwesterly anomalies along the coast of SEC,resulting in anomalous moisture convergence over SEC.These southwesterly anomalies are related to the enhanced western North Pacific subtropical high(Fig.7f) in response to GHG changes (Lau and Kim,2017;Lau et al.,2017;Tian et al.,2018).
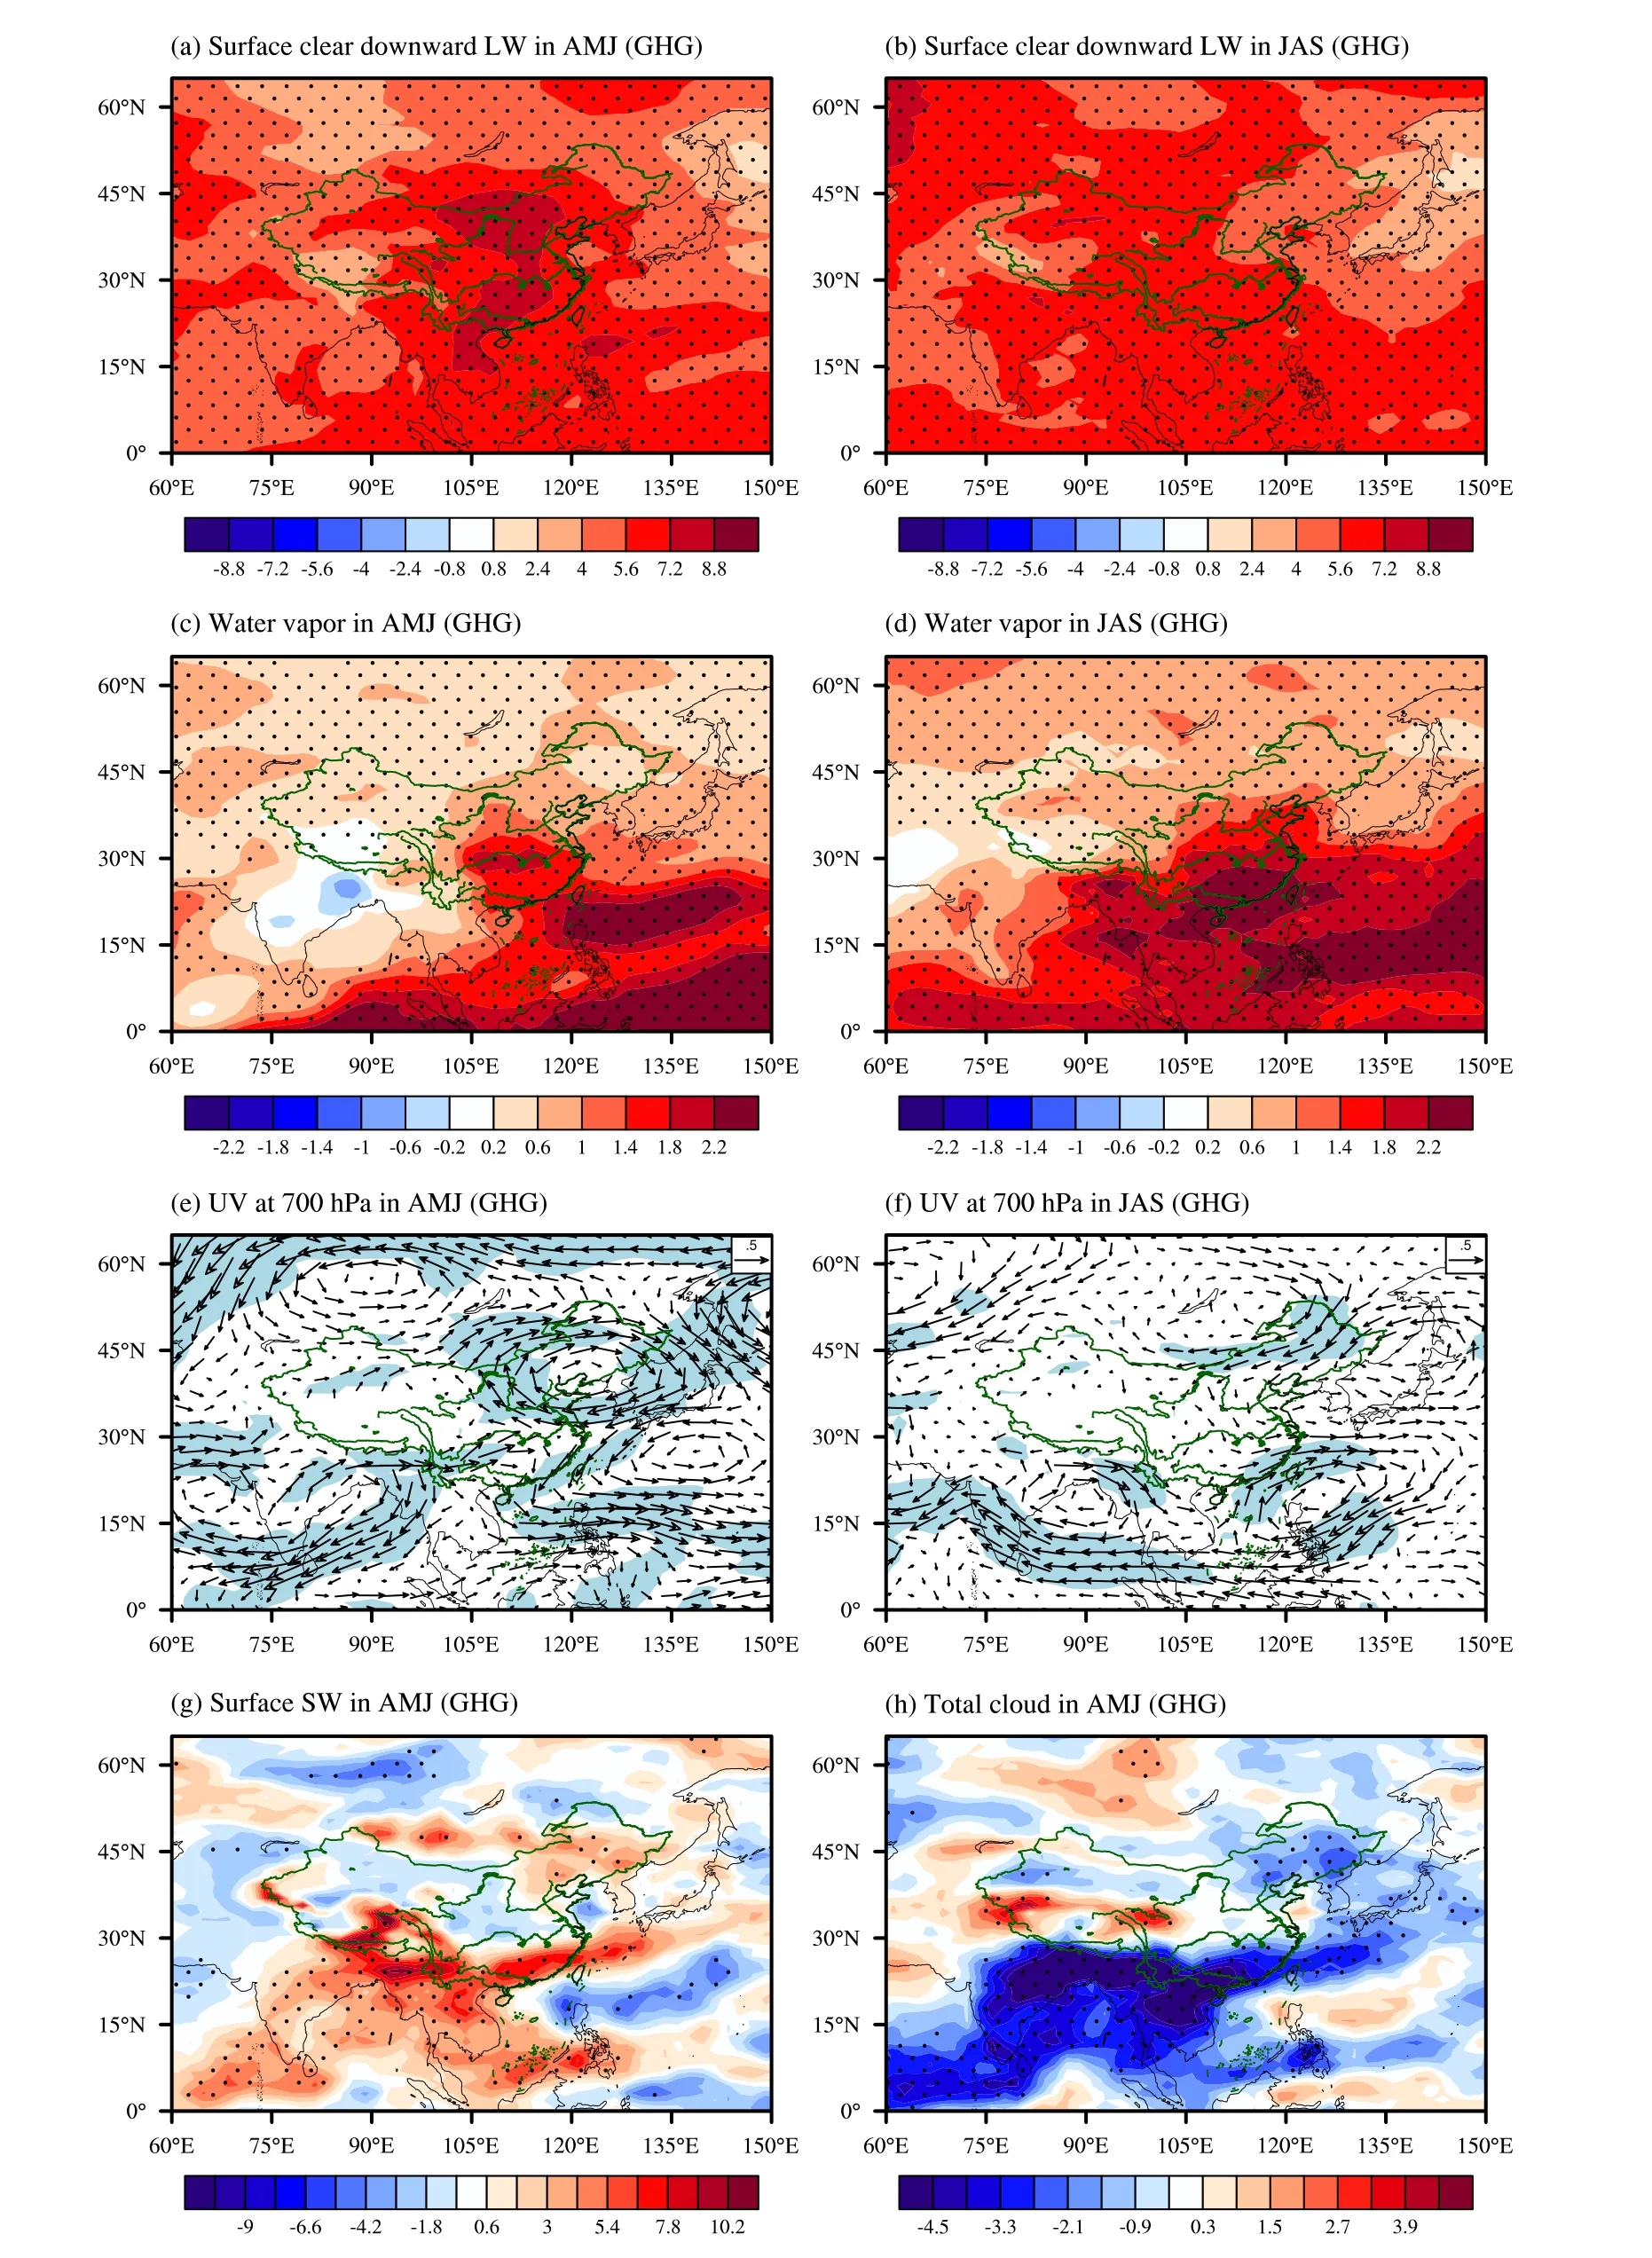
Fig.7.Spatial patterns of the mean response to changes in GHG forcing (C-PD-GHG minus C-EP):surface clear-sky downward LW radiation during (a) AMJ and (b) JAS;water vapor during (c) AMJ and(d) JAS (units: kg m-2);horizontal wind at 700 hPa during (e) AMJ and (f) JAS (units: m s-1);(g) net surface SW radiation during AMJ;and (h) total cloud cover during AMJ (%).Positive values of radiation indicate downward fluxes,and the unit is W m-2.The black dots in (a-d) and (g-h) and the blue shading in (e,f) highlight regions where the changes are statistically significant at the 90% confidence level based on a two-tailed Student’s t-test.
Specifically,net surface SW radiation increases over the southern part of NEC and SEC during AMJ (Fig.7g).These increases in SW radiation are associated with a decrease in cloud cover (Fig.7h).There are anticyclonic circulation anomalies over SEC and NEC (Fig.7e),favoring descent,which decreases cloud cover (Fig.7h).Besides,the northeasterly anomalies along the coast of SEC,restricting moisture transport from the South China Sea to SEC(Fig.7e),also contribute to lower relative humidity and reduced cloud cover.
In summary,the increase in the seasonal mean surface air temperature during AMJ and JAS is induced partly by the enhanced Greenhouse Effect over China during both AMJ and JAS,and partly by the positive feedback of increased atmospheric water vapor over NC during AMJ and over SEC during JAS,due to the circulation and SST changes in response to GHG increases.In addition,the increase in SW radiation over SEC and NEC during AMJ,resulting from the decrease in cloud cover,which is also related to the circulation and SST changes in response to GHG changes,plays a role in surface warming in these regions.Because of the increased seasonal mean surface air temperature,both the frequency and duration of HDEs increase over most of China.
5.3.Physical processes for changes induced by AA forcing
Figure 8 illustrates the mean changes during JAS in some key variables in response to AA changes.Since the HDE changes over China during AMJ in response to AA changes are small (not shown) but the HDE frequency and duration over SEC and NC decrease significantly during JAS,only the physical mechanisms associated with HDE changes during JAS are discussed.
The significant decrease in net surface SW radiation(Fig.8a) leads to surface cooling over SEC and NC (Fig.8b).The decreased net surface SW radiation over most parts of China is mainly due to the decrease in net surface clear-sky SW radiation (Fig.8c),resulting from the increased total aerosol optical depth (AOD) (Fig.8d) via aerosol-radiation interaction (Boucher et al.,2013).In addition,the increased cloud cover over SEC and NC contributes to decreased surface net SW radiation,partly due to aerosol-cloud interaction(Albrecht,1989;Boucher et al.,2013) and partly due to aerosol changes induced by atmospheric feedbacks resulting from circulation changes (Fig.8e) (e.g.,Dong et al.,2019).The southwesterly anomalies over SEC and NC (Fig.8f),conveying more water vapor transport from the South China Sea and favoring more precipitation (not shown),are partly responsible for the increased cloud cover over SEC and NC(Fig.8g).The southwesterly anomalies are on the western flank of the anticyclonic circulation anomalies over the northwestern Pacific,which is associated with anomalously cool SSTs over the tropical western Pacific.Therefore,the reduced surface clear-sky SW radiation due to the increased AOD,and the increase in cloud cover,related to aerosol-cloud interaction and the surface and atmospheric feedbacks resulted from AA-forced circulation changes,jointly result in the decrease in the surface air temperature over eastern China,which decreases the HDE frequency and duration over SEC and NC during JAS.

Fig.8.Spatial patterns of the mean response to changes in AA forcing (C-PD-AA minus C-EP) during JAS: (a) net surface SW radiation;(b) surface air temperature (units: °C);(c) net surface clear-sky SW radiation;(d) total AOD at 0.55 μm;(e) total cloud cover (%);and (f) horizontal wind at 700 hPa.Positive values of radiation indicate downward fluxes,and the unit is W m-2.The black dots in (a-e) and the blue shading in (f) highlight regions where the changes are statistically significant at the 90% confidence level based on a two-tailed Student’s t-test.
In response to AA forcings,the surface air temperature over NC is decreased during JAS but increased during AMJ(not shown),albeit leading to negligible HDE changes.The AA-forced increase in surface air temperature during AMJ agrees with the previous findings of Su and Dong (2019),who reported that the surface air over NC is warmed by the increased surface net SW radiation induced by the AAforced circulation changes during the extended summer(May-September).Comparing those responses,it is suggested that the circulation changes induced by the surface air temperature increase over NC in response to AA forcings occur primarily in early summer but not in late summer.
6.Conclusions
(1) Significant decadal changes in HDE frequency and duration during the growing season (April-September) over China were observed in the mid-1990s.These decadal changes are assessed here by comparing the HDEs in PD(1994-2011) to those in EP (1964-81).The frequency and duration of HDEs increase over most of China,with relatively larger increases over SEC,NC and NEC.The frequency of HDEs averaged over China in PD is double that in EP;the duration of HDEs increases by 60%.Over NEC,the frequency in PD is five times that in EP;the duration increases more than threefold.The HDE frequency over NC and SEC in PD is double that in EP;the duration over these two sub-regions increases by 60%-80%.
(2) Model experiments indicate that anthropogenic forcing can explain 60%-70% of the observed decadal changes in HDEs,suggesting an important anthropogenic influence.The increase in GHG concentrations increases the HDE frequency and duration across China.Although the increase in AA emissions over China significantly decreases the HDE frequency and duration over SEC and NC,the magnitude of the decrease is much smaller.
(3) The changes in mean state play a dominant role in simulated HDE decadal changes over China.The mean temperature changes induce nearly all the HDE changes,while the changes in mean SM and ET contribute little,because of the weak simulated responses of SM and ET to anthropogenic forcing.These weak responses are inconsistent with observed changes,which may lead to the weaker simulated decadal changes in HDEs.The weak responses of SM and ET,and therefore HDEs,might be a model deficiency in response to anthropogenic forcing,or due to missing external forcing changes,such as volcanic forcing and solar forcing,or other factors,such as the Pacific Decadal Oscillation and Atlantic Multidecadal Oscillation,which might have played a role in observed decadal changes.
(4) The increased GHG concentrations increase the HDE frequency and duration over most of China.GHG forcing increases the seasonal mean surface air temperature during AMJ and JAS,via the enhanced Greenhouse Effect during both periods;the moistened atmosphere over NC during AMJ,and over SEC during JAS,associated with the circulation and SST in response to GHG changes;and the increase in SW radiation over SEC and NEC during AMJ,resulting from decreased cloud cover,which is also related to the circulation and SST responses to GHG changes.
(5) The increase in AA emissions reduces the HDE frequency and duration over SEC and NC during JAS by cooling the surface,through reducing the net surface SW.The decrease in net surface SW is jointly induced by the aerosol-radiation interaction and the increased cloud cover,which is related to both aerosol-cloud interaction and the circulation and SST changes in response to AA changes.
Although the simulated responses to anthropogenic forcing appear to capture some features of observed decadal changes in HDE frequency and duration over China,it is important to note that the results may be sensitive to the model or experimental design.For example,this work is based on time-slice experiments forced by changes in GHG concentrations and AA emissions.External forcing changes associated with volcanic forcing and solar variability are not considered.Additionally,the oceanic component of the model used is a mixed-layer model,in which the ocean dynamic processes are not fully considered.Therefore,the simulated changes in SST and some other variables may not be the same as those in fully coupled general circulation models (CGCMs).Hence,the conclusions of this study should be tested in different models.It would be worth comparing our results with CGCM simulations that consider the temporal evolution of the climate changes,such as CMIP6 historical simulations (Eyring et al.,2016) and DAMIP (Detection and Attribution Model Intercomparison Project) simulations(Gillett et al.,2016).Additionally,the roles of low-frequency SST mode variability over different ocean basins should also be assessed in order to fully understand observed decadal changes in HDEs over China.
Acknowledgements.This study was carried out during Qin Su’s academic visit to the University of Reading,funded by the UK-China Research and Innovation Partnership Fund through the Met Office Climate Science for Service Partnership (CSSP) China as part of the Newton Fund.QS is also supported by the National Natural Science Foundation of China (Grant Nos.42030603 and 42175044).BD and FT are also supported by CSSP-China.NPK was supported by an Independent Research Fellowship from the Natural Environment Research Council (Grant No.NE/L010976/1).BD and NPK are additionally supported by the National Centre for Atmospheric Science via the NERC/GCRF programme “Atmospheric hazards in developing countries: risk assessment and early warnings ” (ACREW).MetUM-GOML2 simulations were performed on ARCHER,the UK national supercomputing facility.We would like to thank the two anonymous reviewers for their constructive comments and suggestions on the original version of this paper.
Open AccessThis article is licensed under a Creative Commons Attribution 4.0 International License,which permits use,sharing,adaptation,distribution and reproduction in any medium or format,as long as you give appropriate credit to the original author(s) and the source,provide a link to the Creative Commons licence,and indicate if changes were made.The images or other third party material in this article are included in the article’s Creative Commons licence,unless indicated otherwise in a credit line to the material.If material is not included in the article’s Creative Commons licence and your intended use is not permitted by statutory regulation or exceeds the permitted use,you will need to obtain permission directly from the copyright holder.To view a copy of this licence,visit http://creativecommons.org/licenses/by/4.0/.
杂志排行
Advances in Atmospheric Sciences的其它文章
- Circulation Pattern Controls of Summer Temperature Anomalies in Southern Africa
- Impacts of Ice-Ocean Stress on the Subpolar Southern Ocean:Role of the Ocean Surface Current
- The Spatiotemporal Distribution Characteristics of Cloud Types and Phases in the Arctic Based on CloudSat and CALIPSO Cloud Classification Products
- Attribution of Biases of Interhemispheric Temperature Contrast in CMIP6 Models
- Two-Stream Approximation to the Radiative Transfer Equation:A New Improvement and Comparative Accuracy with Existing Methods
- Impact of Sky Conditions on Net Ecosystem Productivity over a “Floating Blanket” Wetland in Southwest China
