YOLO-DD:Improved YOLOv5 for Defect Detection
2024-03-12JinhaiWangWeiWangZongyinZhangXueminLinJingxianZhaoMingyouChenandLufengLuo
Jinhai Wang ,Wei Wang ,Zongyin Zhang ,Xuemin Lin ,Jingxian Zhao ,Mingyou Chen and Lufeng Luo
1School of Electronic and Information Engineering,Foshan University,Foshan,528000,China
2School of Mechatronic Engineering and Automation,Foshan University,Foshan,528000,China
ABSTRACT As computer technology continues to advance,factories have increasingly higher demands for detecting defects.However,detecting defects in a plant environment remains a challenging task due to the presence of complex backgrounds and defects of varying shapes and sizes.To address this issue,this paper proposes YOLO-DD,a defect detection model based on YOLOv5 that is effective and robust.To improve the feature extraction process and better capture global information,the vanilla YOLOv5 is augmented with a new module called Relative-Distance-Aware Transformer(RDAT).Additionally,an Information Gap Filling Strategy(IGFS)is proposed to improve the fusion of features at different scales.The classic lightweight attention mechanism Squeeze-and-Excitation(SE)module is also incorporated into the neck section to enhance feature expression and improve the model’s performance.Experimental results on the NEU-DET dataset demonstrate that YOLO-DD achieves competitive results compared to state-of-the-art methods,with a 2.0%increase in accuracy compared to the original YOLOv5,achieving 82.41%accuracy and 38.25 FPS(frames per second).The model is also tested on a self-constructed fabric defect dataset,and the results show that YOLO-DD is more stable and has higher accuracy than the original YOLOv5,demonstrating its stability and generalization ability.The high efficiency of YOLO-DD enables it to meet the requirements of industrial high accuracy and real-time detection.
KEYWORDS YOLO-DD;defect detection;feature fusion;attention mechanism
1 Introduction
Surface defect detection is a crucial aspect of computer vision(CV)tasks[1].In manufacturing environments,various defects such as crazing,scratches,and others can occur in the products due to production conditions.These defects can impact the product lifespan [2] and can even cause safety concerns[3].Initially,most factories relied on manual inspection,which was not only time-consuming and labor-intensive but also particularly inefficient.
Currently,methods for defect detection can be broadly categorized into traditional feature extraction methods and deep learning feature extraction methods.Traditional machine learning algorithms can be broadly classified into three categories: texture feature-based methods,color feature-based methods,and shape feature-based methods.Wang et al.[4]used the entity sparse pursuit(ESP)method to segment images,resulting in a significant improvement in computational efficiency.Liu et al.[5]employed the non-subsampled shearlet transform and the kernel locality preserving projection(NSSTKLPP) to identify surface defects in aluminum strips.Li et al.[6] statistically analyzed saliency features of defective and defect-free areas in cloths and utilized support vector machines(SVM)[7]for classification,resulting in high detection accuracy.However,traditional feature extraction methods require manual feature design,making the model heavily dependent on the environment and weak in generalization.Traditional methods are also not suitable for handling large amounts of data and information.In contrast,deep learning-based methods have shown significant improvements in defect detection.
With advancements in CV[8,9],Convolutional Neural Networks(CNN)have been widely applied in the field of CV.Deep learning-based approaches can be classified into image classification networks and object detection networks,depending on the function of the selected neural network [10].The classical classification networks are ResNet [11],Visual Geometry Group (VGG) [12],etc.Object detection networks can be classified into two categories:one-stage detect models and two-stage detect models.The two-stage algorithm first utilizes selective search[13]or region proposal network(RPN)to predict region images and then merges the Region Of Interestes(ROIs)after extracting the features of each ROI.Afterward,the features of ROIs are subjected to object classification and bounding box regression.The current state-of-the-art two-stage detection models are R-CNN[14],Fast R-CNN[15],and Faster R-CNN [16].The most outstanding representatives of the single-stage detection models are the You Only Look Once (YOLO) series [17–21],and Single Shot Detector (SSD) [22],among others.These approaches formulate the detection task as a unified,end-to-end regression problem,which only necessitates a single image processing step to detect the target.Thus,it is considerably faster than the two-stage detection model.Despite the improved accuracy and efficiency brought about by CNN,there are still some limitations in object detection.Most CNN-structured [23,24]models are good at extracting local features but have difficulty capturing global relationships.For industrial defect detection,single-stage object detection networks are better suited to the real-time inspection requirements in factories,but the detection accuracy is not high enough.In contrast,while the two-stage detection model achieves high accuracy,it is often slow and cannot meet the realtime requirements of industrial applications.With the continuous development of CV and natural language processing(NLP)[25],the Transformer[26]has become an increasingly popular and effective structure.It has a powerful global capture capability and can dynamically focus on regions of interest,making object detection more efficient and effective.However,industrial defect detection poses several challenges,such as complex backgrounds and defects of varying sizes and shapes [27],requiring a model with adaptive dynamic adjustment capabilities.Naseer et al.[28]demonstrated the effectiveness and flexibility of the Transformer in this context.Vision Transformer (ViT) [29] directly uses the Transformer encoder structure for image classification.Detection Transformer (DETR) [30] uses CNN to process the image and obtain the feature map,which is then put into the Transformer for object detection.The Swin Transformer [31] employs a hierarchical feature representation with a shifted window,reducing computational overhead and improving detection efficiency.While these methods have their advantages,they are often less effective in dealing with small datasets and can be computationally expensive to train and deploy.Additionally,the structure of the vanilla transformer is better at extracting global information,while the ability to extract local details is relatively weak.To address this issue,a combination of the Transformer module and CNN can leverage the local modeling capability of CNN and the global capture capability of the Transformer module,significantly improving detection efficiency.
Based on the aforementioned challenges in industrial defect detection,this study proposes the YOLO-DD,which utilizes YOLOv5 as its base model.Relatvie-Distance-Aware Transformer(RDAT)replaces the last layer of the CSP1_1 to improve feature extraction and preserve both local and global representations.Information Gap Filling Strategy(IGFS)is incorporated in the neck to address the loss of detailed information caused by an increasing number of convolution layers.Additionally,a lightweight attention module Squeeze-and-Excitation (SE) is added to enhance the overall defect detection performance of the model.Experimental results indicate that the YOLO-DD structure is highly efficient and meets real-time requirements while achieving high accuracy in defect detection.In summary,the main contributions of this work are as follows:
• A novel defect detection model,YOLO-DD,has been designed by modifying the vanilla YOLOv5 model.The model significantly improves the performance of defect detection.
• A new module RDAT is designed to take advantage of the global modeling capabilities of the Improved Swin Transformer Block and improve feature extraction.
• The YOLO-DD model incorporates an improved neck that enhances the feature fusion ability.IGFS is introduced to compensate for the information loss caused by upsampling and downsampling,while the SE module adaptively highlights important regions to enhance feature representation.
• The effectiveness of the YOLO-DD model is experimentally verified,and its performance is compared with other state-of-the-art models.Additionally,ablation experiments are conducted to demonstrate the usability of the proposed RDAT,IGFS,and SE modules.
2 Related Work
In this section,the work related to the model proposed in this paper is reviewed,which includes the defect detection network,the attention mechanism module,and Transformer.
2.1 Defect Detection Network
In industrial defect detection applications,workers often use generic object detection networks and adapt them to fit their specific industrial data.However,these networks may not perform well in detecting defects under certain challenging conditions such as complex backgrounds or similar foreground and background textures.To improve the real-time performance of the detection model,several researchers have proposed modifications to the base models.Tao et al.[32] used a cascaded two-stage Faster R-CNN model to locate insulator defects accurately in aerial images.Zhao et al.[33]used multiscale fusion and deformable convolution to reconstruct Faster R-CNN,achieving 75.2%on the NEU-DET dataset.Li et al.[34] improved the detection of small defects by using an improved end-to-end YOLO model to detect steel surface defects.Similarly,Zhao et al.[35] improved the YOLOv5 model using Res2Net block,dual feature pyramids and dual decoupling heads,and achieved 81.1% accuracy on the NEU-DET dataset.Chen et al.[36] proposed an adaptive convolutional anchor network for surface defect detection,which achieved 76.4% on the NEU-DET dataset.Yu et al.[37]used aggregated feature guidance module,efficient stair pyramid and dynamic scale-aware head to improve the detection capability of YOLOv4,achieving 79.1% on the NEU-DET dataset.Zhang et al.[38]improved the detection of solar cell surface defects by adding a variable convolution to the backbone of YOLOv5 and a detection head for shallow features in feature fusion.In this paper,the vanilla YOLOv5 is chosen as the base model because of its speed,accuracy,and lightweight design,making it suitable for meeting real-time industrial requirements.
2.2 Attention Mechanism Module
The attention mechanism module is a technique that selectively focuses on the most important areas,similar to how the human eye selectively focuses on specific objects or details.This module works by adaptively assigning higher weights to important parts of the feature map and lower weights to less important parts.It was first introduced in NLP before gaining popularity in CV research.In the context of defect detection,the attention mechanism can be leveraged to focus on critical regions of a complex background.By doing so,the network can better differentiate defects from the background areas in an image,leading to improved detection accuracy.This approach enhances the representation of important features,leading to more precise localization of defects and reduced false positives.Ultimately,the attention mechanism module is a powerful tool that improves the robustness of the defect detection network,making it more effective in challenging industrial environments.
Currently,the mainstream attention mechanism modules used in CV research include SE [39],Convolutional Block Attention Module(CBAM)[40],and Efficient Channel Attention(ECA)[41],among others.The SE module performs average pooling to encode all spatial features on the channels as global features,obtaining the global features at the channel level.Then,the Excitation operation is performed on the global features to learn the relationship between the channels and obtain the weights of different channels.Finally,the weights of different channels are multiplied by the original input to get the final result.The CBAM utilizes two modules,Channel Attention Module(CAM)and Spatial Attention Module (SAM),to implement the attention mechanism.The CAM module aggregates spatial information through parallel max pooling and average pooling and obtains the channel’s attention through the shared network.The SAM module uses the output feature map of the CAM module as the input feature map and applies global maximum and average pooling to obtain two sets of results,which are then combined using the Concat operation.Finally,it multiplies the result with the original feature map after dimensionality reduction and sigmoid operations to obtain the final result.The ECA uses a local cross-channel interaction strategy with an adaptive selection of convolutional kernels.It can be combined with convolutional neural networks to achieve excellent results.These attention mechanism modules are designed to enhance the representation of important features in an image and to focus on critical regions of the image,improving the accuracy and robustness of the defect detection network.
2.3 Transformer
The transformer was originally developed for NLP but has since been applied to CV due to its remarkable success.For example,the ViT breaks down images into patches and directly feeds them into the transformer structure for classification.Similarly,DETR combines CNN with Transformer to treat object detection as an ensemble prediction problem,achieving impressive results.The Swin Transformer,on the other hand,employs shifted windows to construct a hierarchical CNN structure and has shown great performance in various tasks such as classification,detection,and segmentation.In this paper,we propose a Swin Transformer block with 2D relative-distance-aware position encodings,which is integrated into the vanilla YOLOv5 model to enhance its global perception ability.
3 Methods
In this section,the YOLO-DD model will be described in detail.The model in this paper is based on the YOLOv5_l network.Vanilla YOLOv5 uses CSPDarknet [42] and Spatial Pyramid Pooling(SPP) [43] as the backbone,PANet [44] as the neck,and YOLO head as the detection head.In ourexperiments,YOLOv5 was chosen as the base model because of its lightweight design and real-time detection capabilities.
3.1 YOLO-DD
Fig.1 shows the overall architecture.YOLO-DD consists of three parts: backbone,neck,and YOLO head.In the proposed YOLO-DD model,the CSP1_1 in the last stage of the Darknet structure is replaced with the novel-designed RDAT structure in the backbone.To solve the issue of data misalignment,PatchEmbedding,and Post-processing techniques are employed.A detailed description of the RDAT structure can be found in Section 3.2.
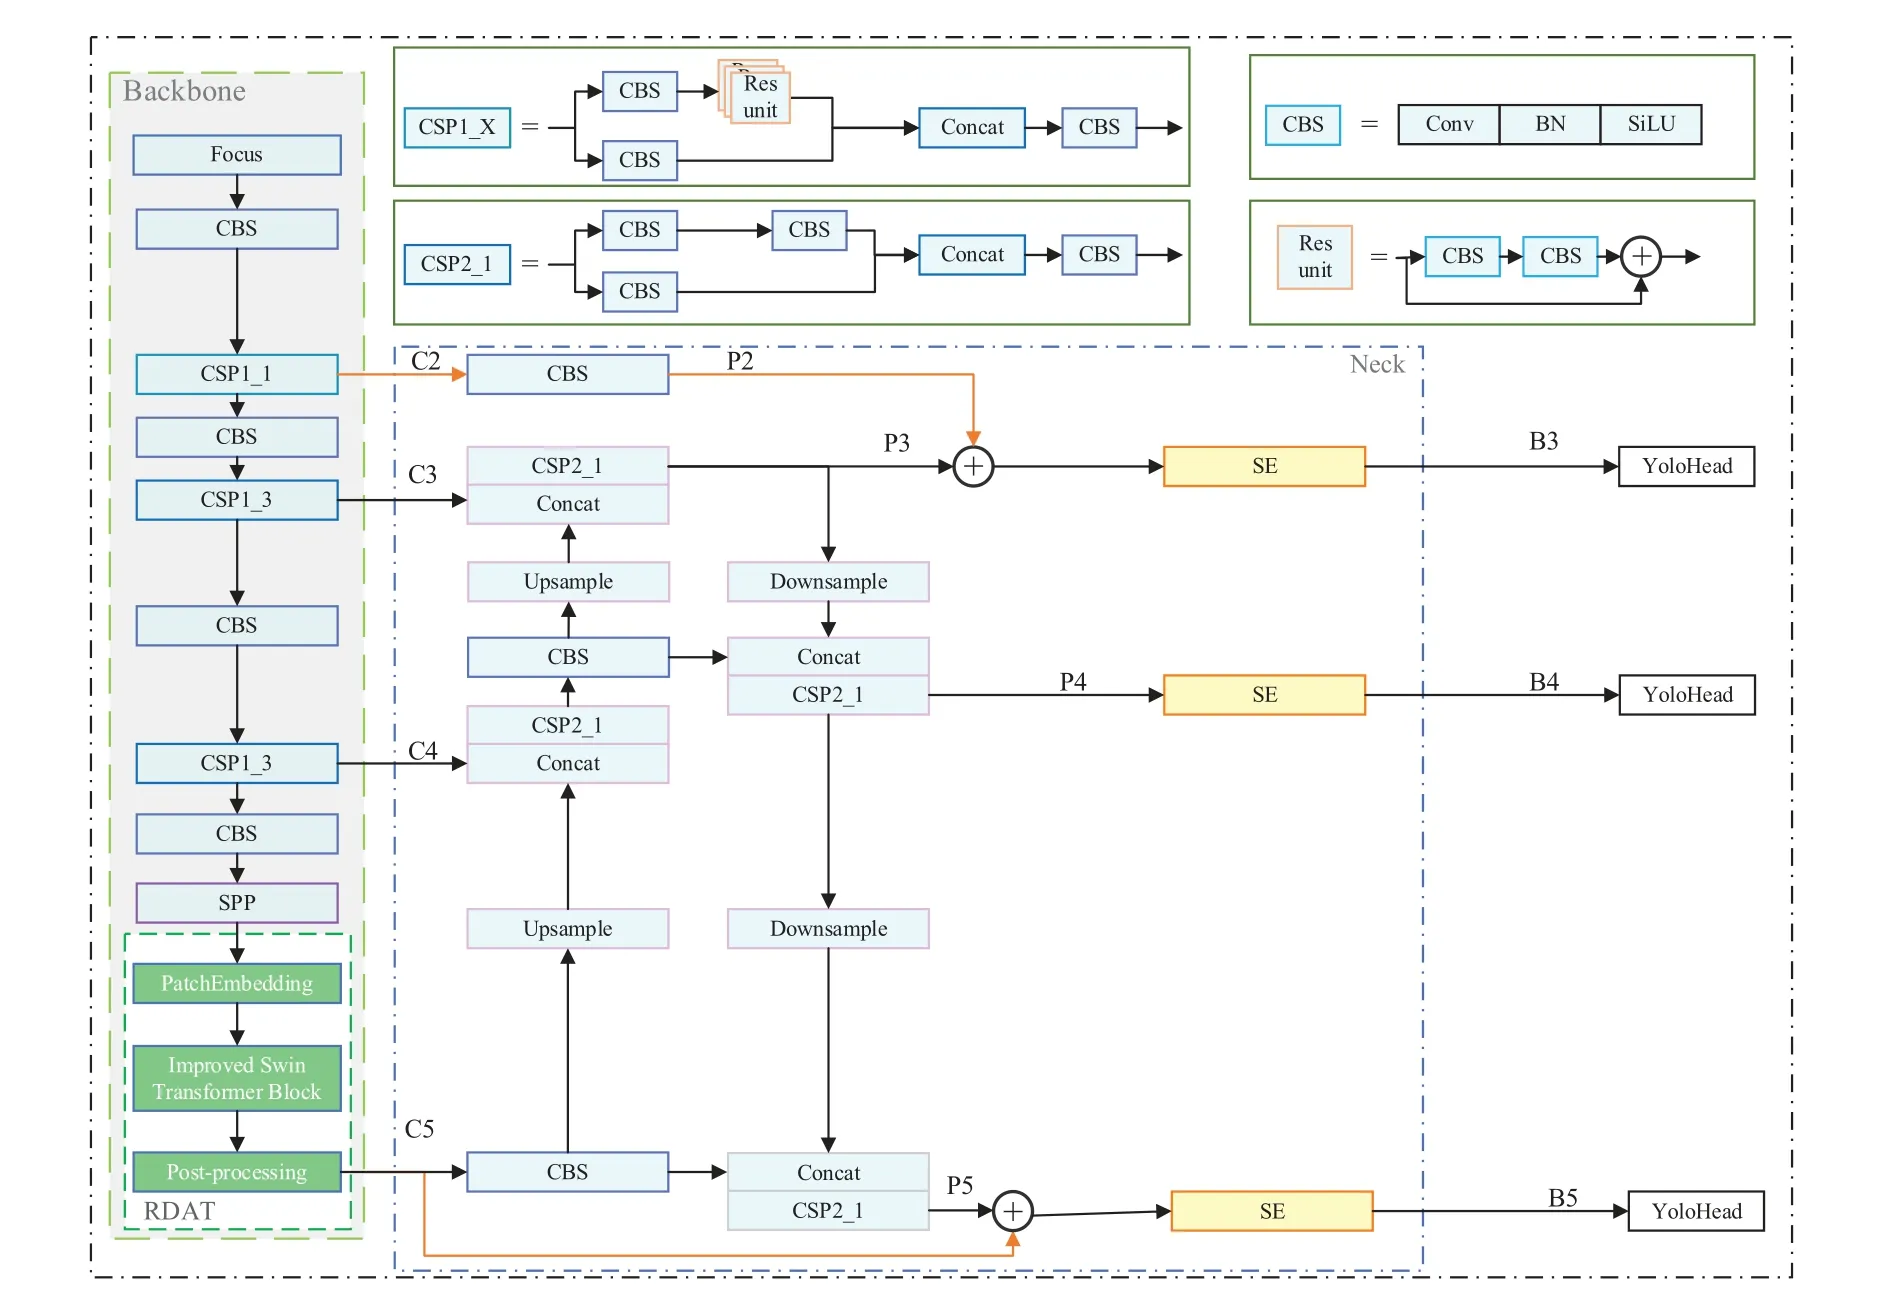
Figure 1:The structure of the YOLO-DD.RDAT represents relative-distance-aware transformer.SE represents squeeze-and-excitation
To compensate for the loss of detailed information that occurs during up-sampling and downsampling,IGFS is employed.Additionally,the SE module is utilized to enable the model to selectively focus on regions with high importance,which is especially beneficial for defect detection tasks.More information about IGFS and the SE module can be found in Section 3.3.Finally,the detection head structure from vanilla YOLOv5 is retained for the YOLO-DD model.
For a given input image I,the backbone network outputs four feature maps of different sizes,as shown in Eq.(1).In the original YOLOv5 neck stage,the output feature map is denoted as P,which contains three different sizes of feature maps,as shown in Eq.(2).After that,P is fed into the SE module for feature focus calculation,and the output result is expressed as B,as shown in Eq.(3).
3.2 Relative-Distanse-Aware Transformer(RDAT)
In the realm of defect detection,CNN networks have proven effective in extracting features and visual structures from images.However,Transformers have shown superior performance in handling relationships between visual elements.This is where RDAT comes in,as it can leverage the strengths of Transformers in addressing relationships between visual elements and objects to achieve even better results.
RDAT is composed of three parts:PatchEmbedding,the Improved Swin Transformer Block,and Post-processing.The architecture is depicted in Fig.2.In the vanilla YOLOv5 model,the feature map data output by SPP is in the format of C × H × W,where C is the dimension of the feature map and H and W are the height and width of the feature map,respectively.On the other hand,the Improved Swin Transformer Block requires the input data to be in the format of K × C,where K represents the size of patch embeddings and C represents the dimension of the patch embeddings.The PatchEmbedding module can convert the original two-dimensional image into a series of onedimensional patch embeddings.It mainly comprises Flatten and Transpose operations,as shown in the orange rectangular box in Fig.2.Specifically,it flattens the feature map to combine the width and height of the feature map into one dimension and then uses the Transpose operation to adjust the position of the dimensions.The calculation process can be expressed in Eq.(4)as follows:
whereyprepresents the output of PatchEmbedding.xrepresents the output of SPP.
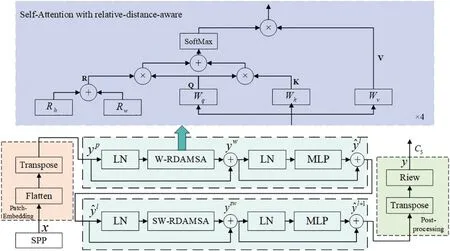
Figure 2: RDAT Block.LN means LayerNorm.W-RDAMSA and SW-RDAMSA denote windowbased multi-head self-attention using regular and shifted window partitioning configurations with 2D relative position-aware position encoding,respectively
The structure of the Improved Swin Transformer Block,illustrated in Fig.2,is composed of several components:LayerNorm(LN),Window Multi-Head Self-Attention module with 2D relativedistance-aware position encodings (W-RDAMSA),2D relative-distance-aware position-encoding Multi-Head Self-Attention module with shifted window (SW-RDAMSA),residual connections and the Multi-Layer Perception (MLP) with Gaussian Error Linear Unit (GELU) nonlinearity.The Improved Swin Transformer Block is calculated as follows:
whereywandyswrepresents the output features of the W-RDAMSA and SW-RDAMSA,represents the output of the MLP module for block l,W-RDAMSA,and SW-RDAMSA denote window-based Multi-Head Self-Attention using regular and shifted window partitioning configurations with 2D relative position-aware position encoding,respectively.
Post-processing plays an important role in converting the data output from the Improved Swin Transformer Block to the data format required by the YOLO network.There are two operations involved in post-processing.The first operation is Transpose,which exchanges the position of two dimensions.The second operation is View,which converts the one-dimensional patch embedding format into a two-dimensional image format.The specific operation is shown in Eq.(9).Transpose changes the data format from K×C to C×K,and the View operation changes C×K to C×H×W.Although RDAT uses 4 heads,they are not shown in Fig.2 for simplicity.
In the field of CV,there are two common methods for position encoding in transformer-based models: relative position encoding and absolute position encoding.The encoding in BETR [45] is simple and achieves remarkable results by initializing the position embedding and then by training the absolute position vector for each position.Swin Transformer generates weights based on the position relationship between patches,i.e.,relative position coding.However,for CV tasks [46,47],many studies have found that position encoding using relative-distance-aware location coding [48]is more appropriate.The attention mechanism used in RDAT is shown in the purple rectangular box in Fig.2.RDAT utilizes 2D relative-distance-aware position encodings to put into the attention mechanism,which can effectively combine location information with content information and focus on both content and location features.The attention mechanism replaces the one used in the original Swin Transformer block and allows the model to focus on content information along with location information.The formulation of the attention mechanism is described as follows:
where Q,K,V,and R represent query,key,value,and position encodings,respectively,and d indicates the dimension of the query or key.Additionally,RhandRwrepresent the relative positions of 2D feature maps encoded in height and width,respectively.
3.3 Improved Neck
Semantic information can be lost during the feature fusion stage due to repeated upsampling and downsampling operations.To mitigate the loss of information,IGFS was proposed.As the size of the feature map becomes smaller and smaller,the information on small defects will be lost continuously.To make up for this deficiency,the high-resolution feature maps in the backbone are introduced into the neck to retain semantic information about small target objects.And this method can reduce the loss of small object feature information.In the IGFS,the resolution feature C2 is first adjusted to the same resolution size as C3 by a 3×3 convolution layer.The adjusted feature map is called P2.P2 is then appended to P3 via element-wise addition.After going through the SE module,the final output B3 is obtained.The specific calculation method is shown in Eqs.(12)and(13).PANet addresses the issue of information loss during feature fusion by utilizing the pyramid feature hierarchy.Since C5 contains significant semantic information,simply upsampling and downsampling it during feature fusion may lead to substantial information loss.To make the most of the strong semantic information in C5,the features of C5 and P5 are connected and element-wise addition is performed to obtain a new feature map.This fused feature map is then fed into the SE module to obtain the final output feature map,B5.The operation is shown in Eq.(14).
To improve the accuracy of defect detection,SE modules with an attention mechanism are integrated into all three different scales of the feature maps before the output of the neck.The SE module can enhance the feature expression of the input feature maps by adaptively rescaling channelwise features based on the importance of each channel,thus allowing the model to focus on the most informative features for detecting defects.The attention mechanism of the SE module further improves the feature expression by weighting the channel-wise rescaled features based on their relevance to the defective area.This enables the model to prioritize attention to channels associated with defect regions,improving the accuracy of defect detection.The SE module mainly consists of the Global Average Pooling (GAP) layer,Linear layer,activation function ReLU,activation function Sigmoid,and dot product operation Scale.The operation is shown in Eq.(15).The format of the original PANet output dataPis C×H×W.First,the feature map is compressed to C×1×1 after the compression operation by GAP.The excitation operation consists of two Linear layers.The first one incorporates the compression parameter r,which is done to reduce the number of channels and thus the number of parameters.After the first layer,the feature map becomes C/r×1×1.The second layer recovers the number of channels and the feature map reverts to C×H×W.The activation functions used in the first and second layers are different,ReLU and Sigmoid,respectively.Finally,the Scale operation is performed.The original feature map C×H×W is multiplied by the weight C×1×1 to obtain the final outputB.
wherePandBdenote input and output,respectively.L(),S(),and R()indicate Linear operation,Scale operation,and ReLU operation,respectively.
4 Experiments
In this section,the experimental environment,configuration,data sets used,and experimental evaluation criteria are described.
4.1 Environments
This article uses the framework of PyTorch to train the model.The computer configuration used in this experiment includes a GeForce RTX 2080Ti GPU and an i5-7400 CPU,with 11 GB of memory allocated to the GPU and 64 GB of memory allocated to the CPU.The operating system used for the computer was Ubuntu 18.04 LTS.The optimization strategy chosen for training was Stochastic Gradient Descent(SGD).The parameters used in the experiments were the initial learning rate was set to 0.01,the momentum to 0.937,and the weight decay to 1e-4.After that,the model is trained for 300 epochs.The pre-trained weights used in the experiments are trained from the coco dataset.And the batch size was set to 4 for the consideration of computer hardware in this work.
4.2 Dataset
In this work,the NEU-DET[49]dataset was used.It is a publicly available dataset that contains six defect types,which include Patches(Pa),Rolled-in Scale(RS),Crazing(Cr),Inclusion(In),Pitted Surface(PS),and Scratches(Sc).300 images are available for each defect,for a total of 1800 images,each with a resolution of 200 × 200.Some examples of defect images are shown in Fig.3.In this experiment,the data set is divided into the training set and the validation set with the radio of 8:2.It means that the training set contains 1440 images and the validation set contains 360 images.The data set was mosaicked and mixed up at a scale of 0.5.In addition,since the training images generated by these two data enhancements are far from the real distribution of natural images,enhancement was turned on for the first 210 epochs of the experimental training and turned off for the last 90 epochs.
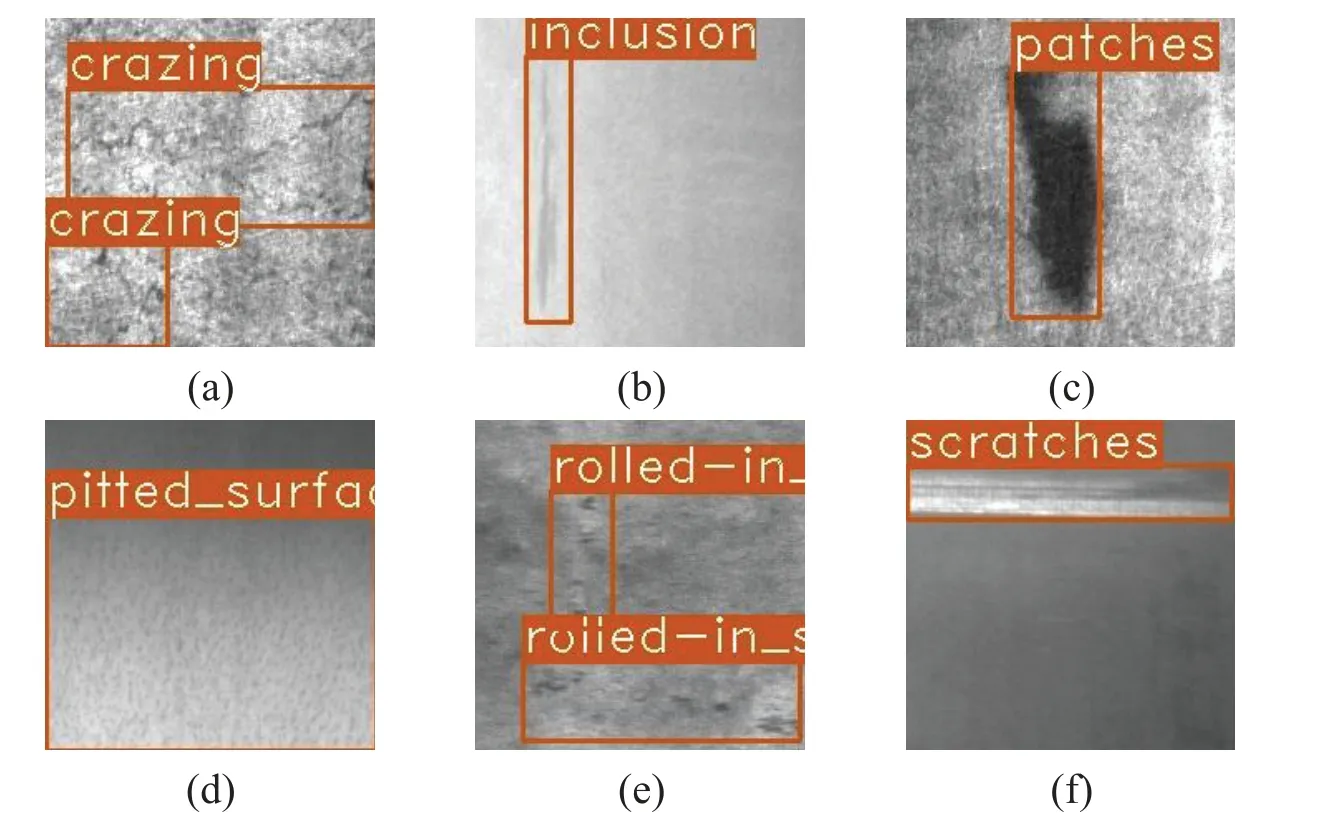
Figure 3:Defect images in NEU-DET.(a)Cr.(b)In.(c)Pa.(d)PS.(e)RS.(f)Sc
In addition,to prove the validity of the model,a self-constructed fabric defect dataset was used for training.A portion of the images in the ALTEX dataset was filtered and transformed by cropping to obtain new defective images.The self-constructed dataset contains 97 fabric defect images,and the image size is 224 ∗224.To prevent data leakage,the dataset was first divided in the ratio of 8:2.After that,the number of each image was enlarged by data enhancement such as rotation,Gaussian blur,and size transformation.Finally,the training set contains 1241 defective images and the validation set contains 311 defective images.Fig.4 shows some of the enhanced defect images.

Figure 4:Defect images in self-constructed fabric defect dataset.(a,c)represent the original image.(b,d)represent the enhanced image
4.3 Evaluation
In this paper,Recall,Precision,Average Precision (AP),mean Average Precision (mAP),and Frames Per Second(FPS)are considered the main measures to verify the validity of the experiment.The Intersection over Union(IoU)refers to the percentage of the area where the true box intersects the predicted box.It is defined in Eq.(16).A detection map will be considered to be TP when the IoU exceeds the given threshold(e.g.,0.5).Precision(P)denotes the percentage of samples recalled as positive samples that are truly positive.The details are given in Eq.(17).Recall(R)is the percentage of all positive samples that are correctly identified as positive samples.The R is defined in Eq.(18).The AP value is the area of the P-R curve.The AP is shown in Eq.(19).The mAP is obtained by averaging the average accuracy of the six defects.And the higher AP value represents higher identification accuracy.It is calculated as in Eq.(20).The FPS indicates the number of images per second that can be processed by the object detection model and allows evaluation of the real-time performance of the detection method.It is calculated as shown in Eq.(21).The Params indicate the number of parameters of the model,which can reflect the lightness of the model.Floating Point Operations(FLOPs)refer to the number of floating point operations,which can be understood as the level of computation.It can be used to measure the complexity of a model.
where A and B are the ground truth and the predicted box,the area indicates the calculated area function.TP,FP,and FN represent the number of true positives,false positives,and false negatives of defects,respectively.In this article,IoU ≥0.5 represents the true positive,and IoU<0.5 represents the false positive.N denotes the number of defect categories in the dataset,and in this study,the NEUDET dataset is used which has six types of defects,so the value of N is 6.n expresses the number of images to be detected and t indicates the time taken to detect an image.In this experiment,the value of n is 100.
5 Results
In this section,several state-of-the-art models are compared with YOLO-DD to demonstrate the feasibility of the designed model.Then the usability of each module in the model is demonstrated by ablation experiments.Finally,the results of the experiment are discussed.
5.1 Comparison with State-of-the-Art Models
To verify the validity of the proposed model,comparative experiments were performed between the proposed model and other state-of-the-art models.In real-world industrial production,defect detection requires not only high accuracy but also real-time performance.So in this part of the exposition,both the mAP and the FPS will be used for a comprehensive evaluation of the defect detection model.In this experiment,the models that are compared with the proposed model are the two-stage detection model like the Faster R-CNN,and the single-stage detection models like SSD,YOLOv3,YOLOv5,YOLOv7,YOLOv8.The results of the evaluation of the above models on the NEU-DET dataset and the self-constructed dataset are shown in Tables 1 and 2.
From Table 1,it is clear to observe that the proposed model in the paper achieves 82.4%accuracy on mAP value,achieving the best results and far exceeding the performance of other methods.At the same time,it achieves a speed of 38.25 FPS which can meet the actual industrial factory detection requirements.YOLOv3 has the fastest detection speed(83.06 FPS)among all models,but the accuracy is the lowest among them.Faster R-CNN,as a representative of the two-stage detection model,has the slowest detection speed compared to other detection models.Besides,its accuracy is also 5.2%lower than that of YOLO-DD.Compared with the vanilla YOLOv5,the accuracy of each category of defects has improved.And the biggest improvement is in Cr,which improves by 8%.YOLOv7 and YOLOv8 are not only less accurate than YOLO-DD,but also the model calculation speed will be slower than YOLO-DD.Finally,through comparative tests,it can be concluded that the YOLO-DD detection model can effectively detect steel defects and achieve the best detection performance.
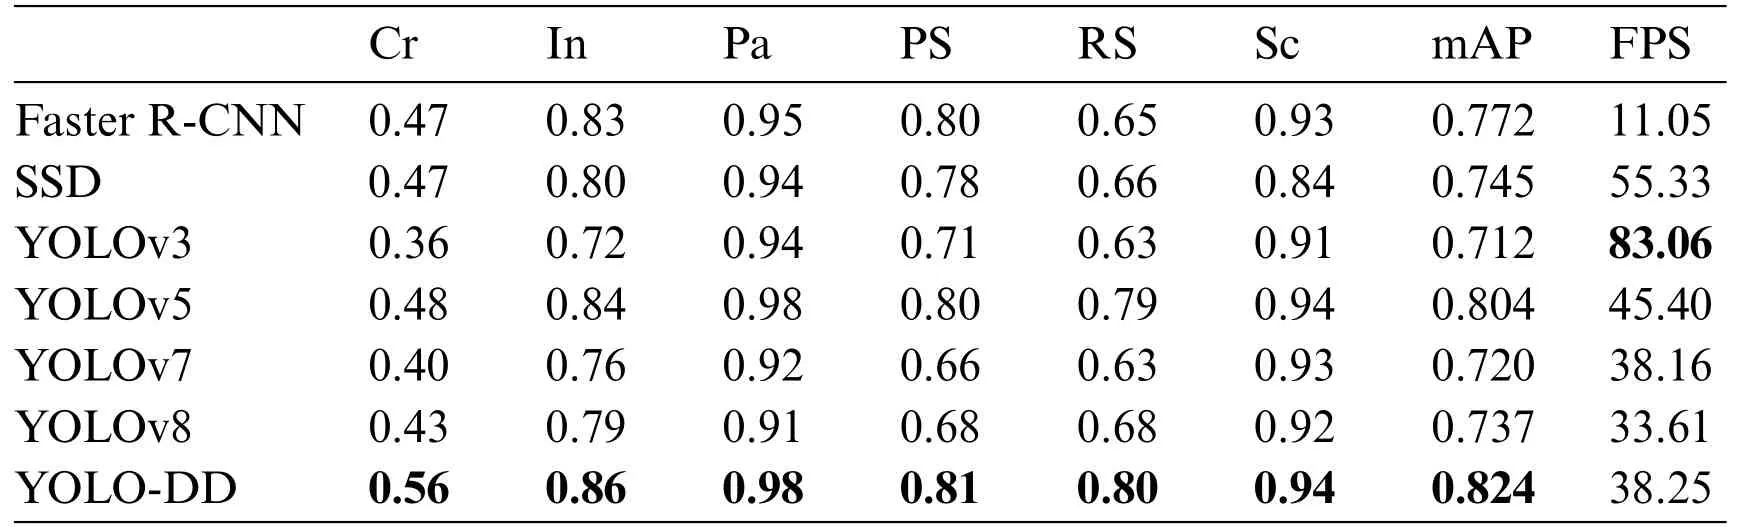
Table 1: The results of different models on the NEU-DET dataset
As shown in Table 2,our model achieves a higher accuracy of 85.5% on the self-constructed dataset.Among the models,Faster R-CNN performs the worst with the lowest mAP value and the slowest detection speed.When compared to the original YOLOv5 model,YOLO-DD shows a 0.6%improvement in accuracy.However,the accuracy of the proposed model in this paper is 3.1% lower compared to the latest release of YOLOv8.Nevertheless,YOLO-DD exhibits a higher FPS,indicating faster detection speed.
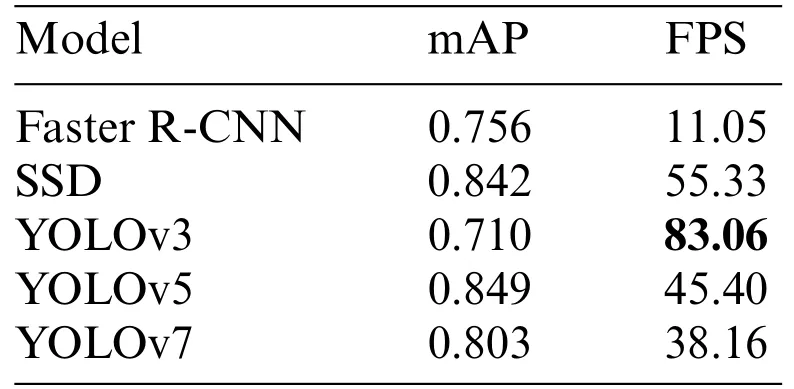
Table 2: The results of different models on the self-constructed dataset
5.2 Ablation Study
For the ablation study,YOLOv5 was chosen as the base model for this experiment,which includes CSPDarknet as the backbone,PANet as the neck,and YOLO head as the detection head.To verify the feasibility of each improved module in the network model,combined experiments were conducted using RDAT,IGFS,and SE block.To rationally determine whether the proposed improvements have application value for defect detection,ablation experiments were conducted on the NEU-DET dataset and the self-constructed dataset in this paper.And the experimental results are listed in Tables 3 and 4.“RDAT”means replacing the last CSP1_1 in CSPDarknet with an RDAT module.“IGFS”indicates that the Information Gap Filling Strategy is used in the neck.“SE”means the SE block used in the neck.And“ECA”means replacing the SE block with the structure of ECA.
As shown in Table 3,it is clear to observe that the use of the RDAT structure in the backbone can improve the accuracy from 80.4% to 81.3%.It indicates that RDAT can play the advantage of the Improved Swin Transformer Block for defect detection with more complex backgrounds.With the addition of IGFS as well as the attention module,the accuracy changes from 81.3%to 82.4%,a further point improvement in accuracy.It shows that the designed improved neck structure can utilize the information from the high-resolution feature maps to compensate for the loss of detailed information of small defects deep in the convolutional layers.Additionally,by utilizing the SE module,the model can focus more on the defects themselves,resulting in a 0.9%improvement in detection accuracy when combined with the IGFS.In addition,the experimental results show a slight decrease in accuracy and FPS when the SE module is replaced by the ECA module.From the experimental data,the SE module is more suitable for defect detection than the ECA module.So the SE module is used in the network designed in this paper.
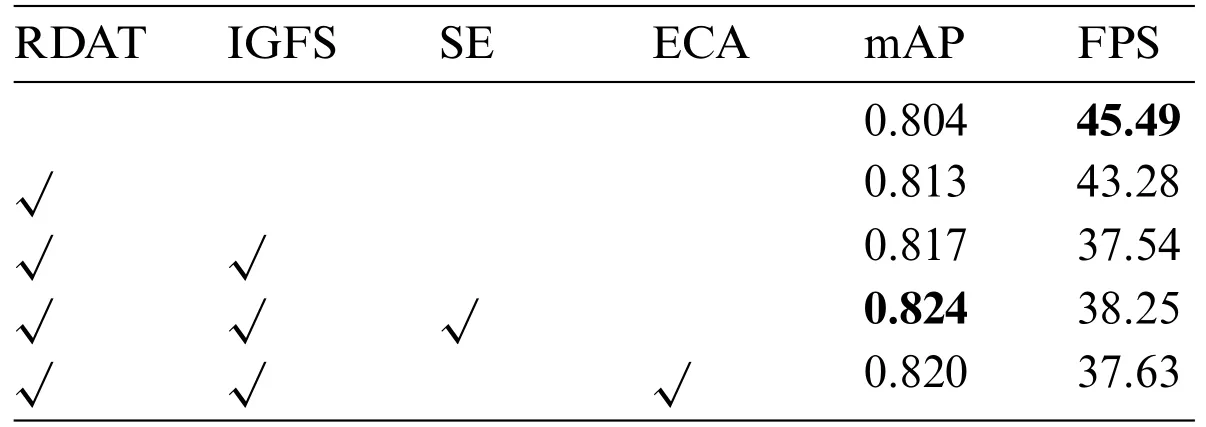
Table 3: Results of the ablation experiments on the NEU-DET dataset
Validation of the ablation experiments was performed on the self-constructed dataset,and the results are shown in Table 4.The original YOLOv5 model achieved an accuracy of 84.9%.The addition of the RDAT module improved the model’s accuracy by 0.5%,but it led to a reduction in detection speed.Introducing the IGFS module resulted in a slightly lower accuracy compared to the original YOLOv5 model,which may be attributed to the introduction of some noise in the shallow feature maps.However,the inclusion of the SE module improved the model’s accuracy to 85.6%.Additionally,the ECA module was explored as an alternative to the SE module,and it was found to enhance accuracy by 0.2%.It is worth noting that using the ECA module comes at the expense of decreased detection speed compared to the SE module.
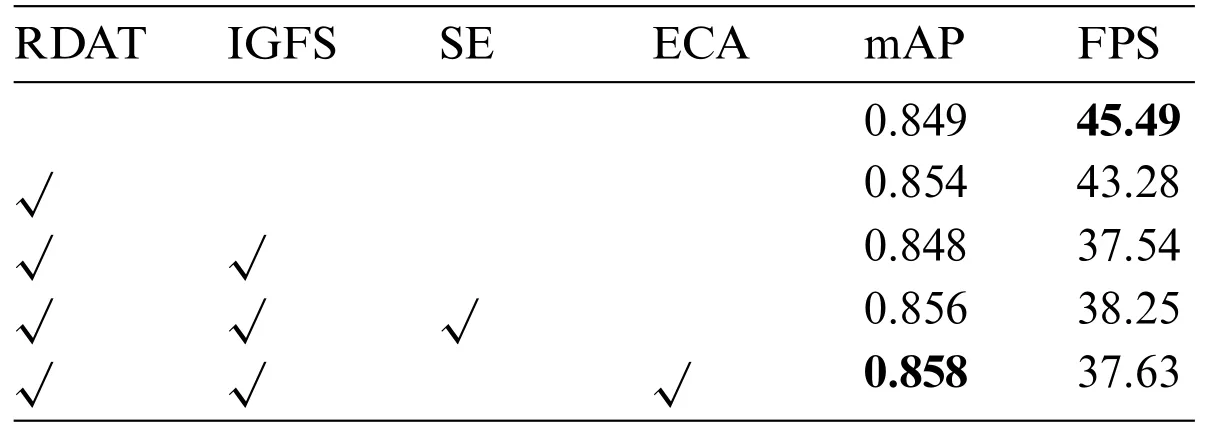
Table 4: Results of the ablation experiments on the self-constructed dataset
5.3 Analysis of Experimental Results
The accuracy curves of each model in the training process are shown in Fig.5a.It can be observed that the YOLO-DD model (red line) exhibits significant accuracy improvement after approximately 100 epochs and maintains a stable lead after 160 epochs.Ultimately,the YOLO-DD model achieves an accuracy of 75.76%.Moreover,the accuracy curve of the YOLO-DD model appears to be relatively smooth,indicating a relatively stable model.As depicted in Fig.5a,YOLOv8 maintains the lead from 50 epochs to 150 epochs.However,beyond 150 epochs,the model’s accuracy experiences a significant decline,with a final training accuracy of only 70.6%.The YOLOv7 model starts converging around 50 epochs and eventually reaches a model accuracy of 75.45%,which differs by only 0.31%from YOLODD.Conversely,the SSD model represented by the orange line demonstrates the lowest accuracy among all models,reaching a final accuracy of only 68%.Faster R-CNN with a blue line in Fig.5a,as a representative of the two-stage detection network,can not achieve the best results on the NEUDET dataset.From Fig.5a,it can be observed that the accuracy curve of the Faster R-CNN wobble amplitude is the largest among all models throughout the training process.That means the model is not stable enough.
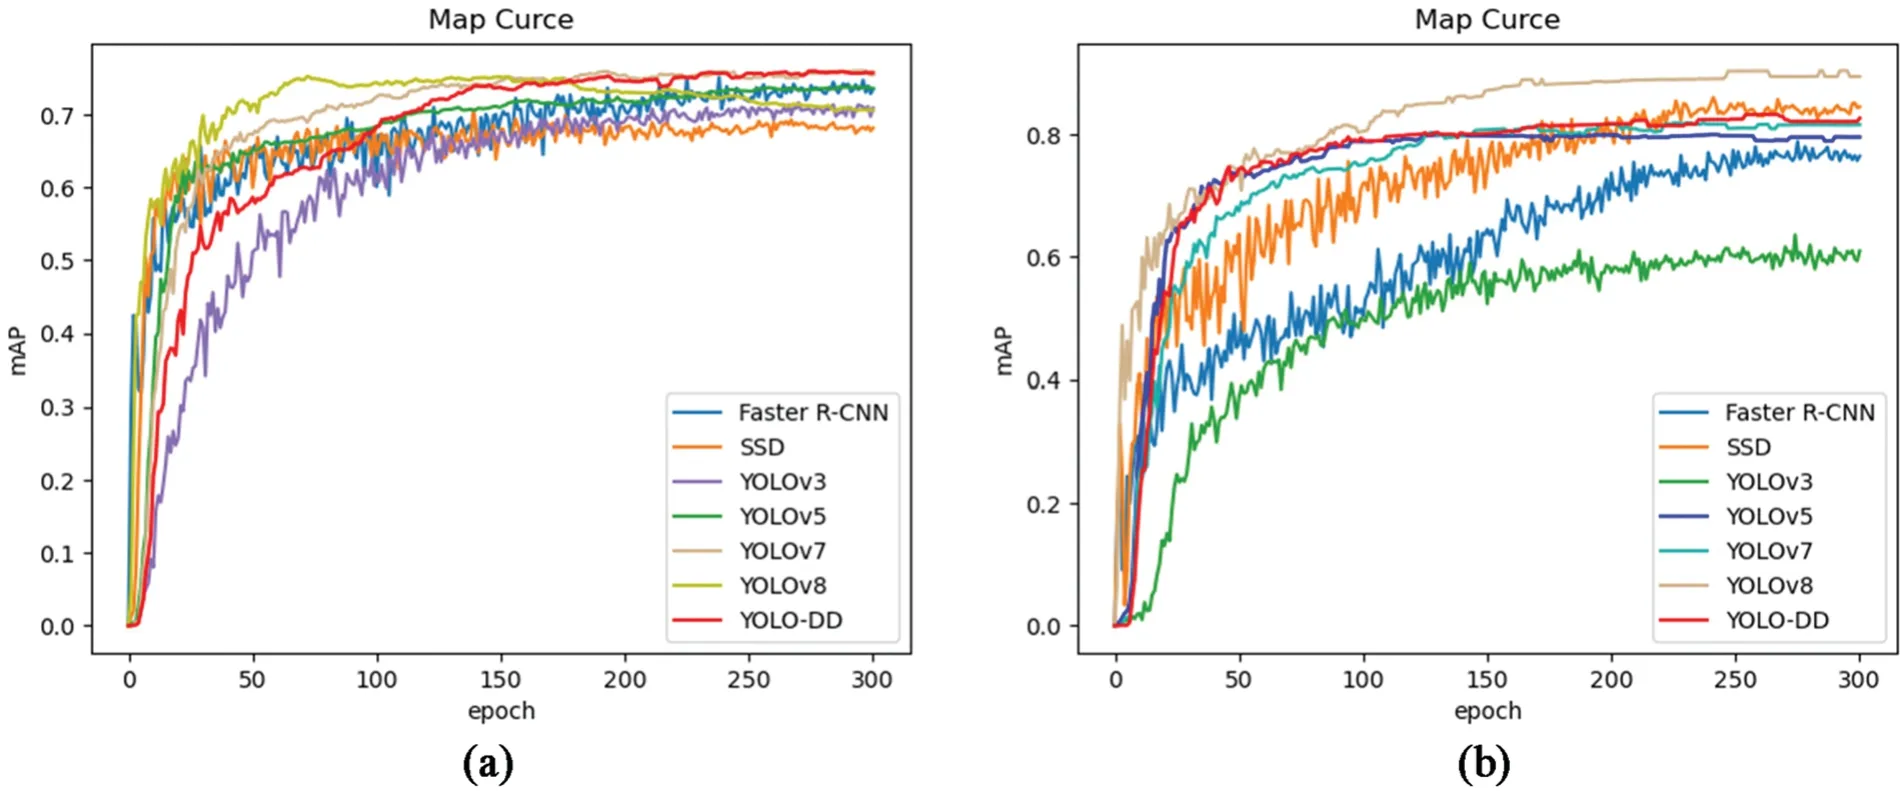
Figure 5: Accuracy curves of each model during the training process.(a) Comparison of results on NEU-DET dataset.(b)Comparison of results on self-constructed fabric dataset
For the self-constructed fabric defect dataset,the training results are shown in Fig.5b.Due to the limited size of the dataset,all models exhibit significant fluctuations during training.However,YOLO-DD demonstrates a smoother curve compared to the other models,indicating its superior stability.YOLO-DD shows convergence after approximately 50 epochs and maintains a relatively stable performance,achieving a final training accuracy of 82.62%.On the other hand,YOLOv3 exhibits slower convergence and lower accuracy compared to the other models.Both SSD and Faster R-CNN have the slowest convergence rates,requiring around 220 epochs to converge.Notably,the SSD model surpasses YOLO-DD in terms of final training accuracy.YOLOv8 achieves the highest training accuracy among all models,although its convergence rate is relatively slower.YOLOv7 consistently performs less accurately than YOLOv5 throughout training.In summary,YOLOv8 and SSD demonstrate the best performance on the self-constructed fabric defect dataset,followed by YOLO-DD,which exhibits faster convergence and relatively higher model accuracy.
5.4 Analysis of Detection Results
To validate the effectiveness of the YOLO-DD model,it performs defect detection and visualization on six different types of defects and compares the results with other state-of-the-art models.Fig.6 shows the detection results of seven different models for a defect Cr.Faster R-CNN predicts a large number of overlapping rectangular boxes,indicating redundant detection.The detection results of SSD and YOLOv8 are similar,predicting three defects,but lacking confidence in accurately estimating the defect sizes.While YOLOv5,YOLOv3,and YOLOv7 predict only two defects and miss one.In contrast,YOLO-DD successfully predicts three defects,demonstrating the effectiveness of the proposed model.These results further confirm the feasibility and validity of the YOLO-DD model.
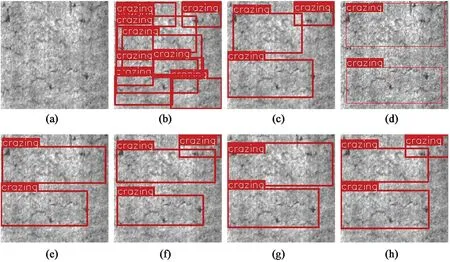
Figure 6:Defect results for Cr on the NEU-DET dataset.(a)Original image.(b)The detection result of the Faster R-CNN.(c) The detection result of the SSD.(d)The detection result of the YOLOv3.(e) The detection result of YOLOv5.(f) The detection result of YOLO-DD.(g) Detection results of YOLOv7.(h)Detection results of YOLOv8
The defect results of In are shown in Fig.7.It can be observed that Faster R-CNN detects five defects,making it the best detection among all models.SSD,YOLOv3,and YOLOv5 all detect only three defects.All of them are missed.For SSD,the rectangular box does not completely enclose the defects,making it the worst detection of all models.YOLO-DD,YOLOv7,and YOLOv8 all detected four defects,with the YOLOv7 model combining two defects into one defect detection,and the remaining two models showing one defect not detected.Compared with the original YOLOv5 model,YOLO-DD improves the ability to predict small defects.
It is evident from Fig.8 that the detection results of YOLOv3 are poor.The defects cannot be accurately marked out,especially in places where the features are not very obvious,resulting in missed defects.Although YOLOv5 predicts three boxes,two of them are overlapping,and it fails to detect light-colored defects.The Faster R-CNN model detects the most number of defects,but it cannot adapt to the shape of the defects and the defect content overflows the rectangular box.YOLOv7,YOLOv8 and SSD both mark four defects,but they have overlapping boxes like YOLOv5.On the other hand,YOLO-DD only marks three rectangular boxes,but it detects essentially all defective areas,including areas where features are not obvious,thus showing its high detection ability.
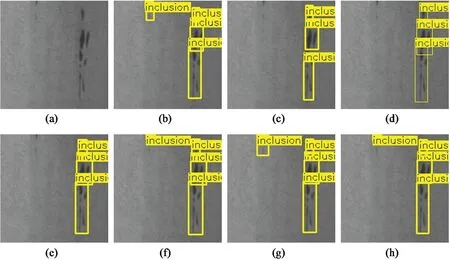
Figure 7:Defect results for In on the NEU-DET dataset.(a)Original image.(b)The detection result of the Faster R-CNN.(c) The detection result of the SSD.(d) The detection result of the YOLOv3.(e) The detection result of YOLOv5.(f) The detection result of YOLO-DD.(g) Detection results of YOLOv7.(h)Detection results of YOLOv8
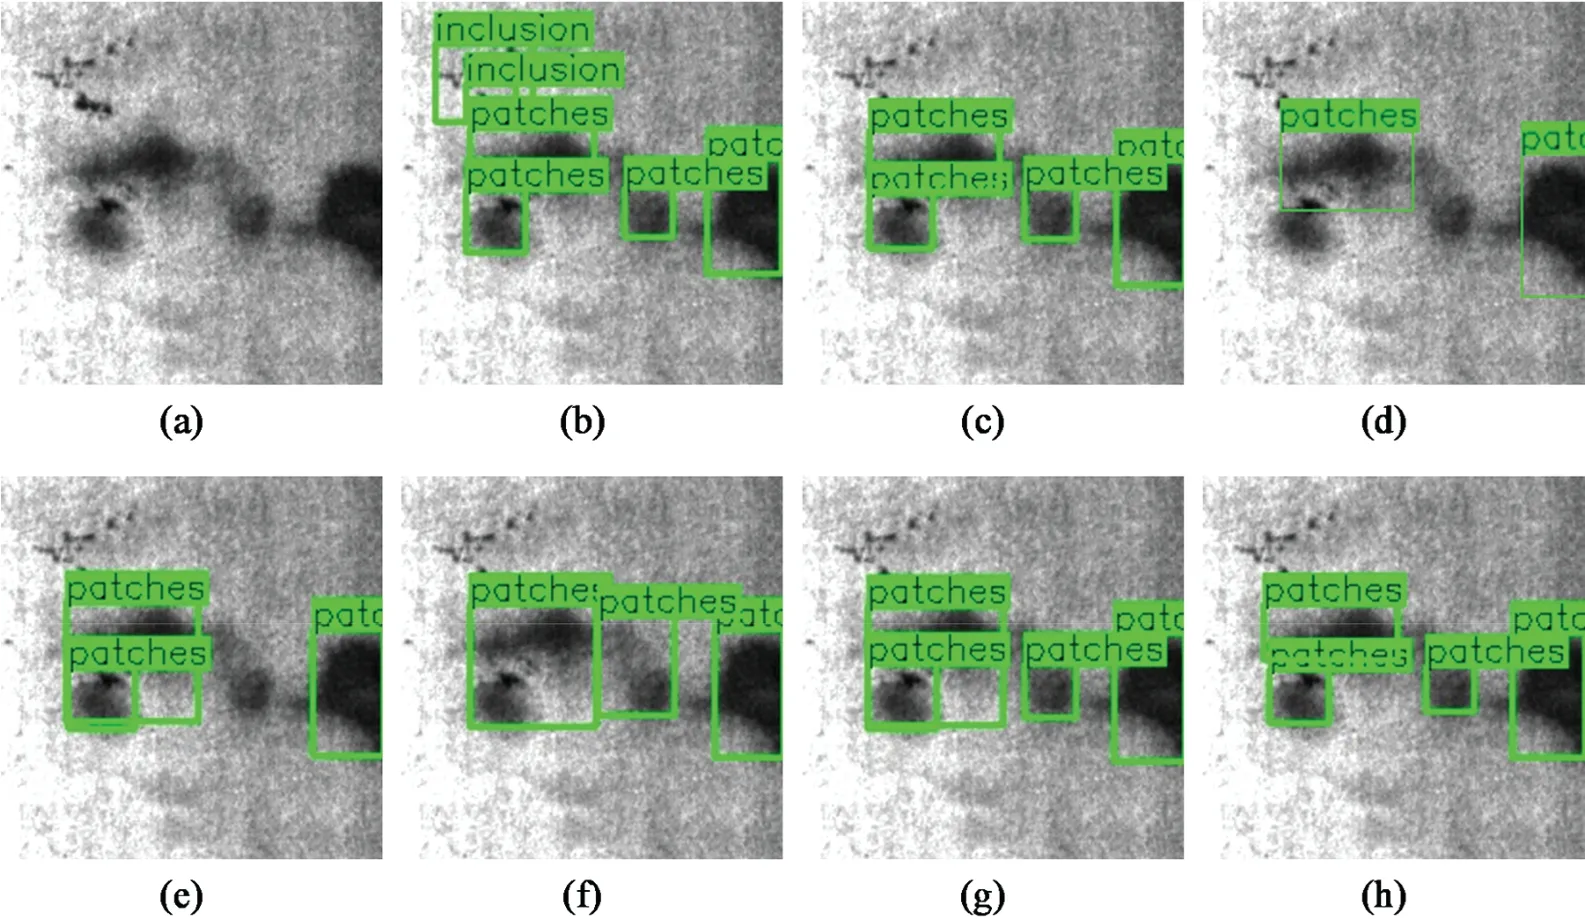
Figure 8:Defect results for Pa on the NEU-DET dataset.(a)Original image.(b)The detection result of the Faster R-CNN.(c) The detection result of the SSD.(d) The detection result of the YOLOv3.(e) The detection result of YOLOv5.(f) The detection result of YOLO-DD.(g) Detection results of YOLOv7.(h)Detection results of YOLOv8
The YOLOv5,YOLOv7,and YOLO-DD detections of PS defects are similar,as shown in Fig.9.All three models successfully detect all defects.YOLOv3 is the only one of all models that shows a missed detection and has the worst results.Both Faster R-CNN and SSD models detected four defects,appeared to have overlapping detection regions for the same Pa defect,and did not accurately identify the size of the PS defect.YOLOv8 detects the correct number of defects but does not correctly label the size of defects using rectangular boxes.

Figure 9:Defect results for PS on the NEU-DET dataset.(a)Original image.(b)The detection result of the Faster R-CNN.(c) The detection result of the SSD.(d)The detection result of the YOLOv3.(e) The detection result of YOLOv5.(f) The detection result of YOLO-DD.(g) Detection results of YOLOv7.(h)Detection results of YOLOv8
Fig.10 shows the detection results for the RS defect.It can be observed that Faster R-CNN has mislabeled the background region as defects and some of the predicted boxes overlap with each other.SSD,YOLOv3,YOLOv7,and YOLOv8 all missed some defects,with YOLOv3 detecting only one defect,the worst result of all the models.For SSD and YOLOv8,the defects are split into multiple boxes rather than detected as a whole.In contrast,both YOLOv5 and YOLO-DD can detect the most complete number of defects and can detect the whole defect without splitting it into multiple boxes.
Fig.11 displays the results of Sc detection,demonstrating that the proposed model in this paper achieves the best detection performance among all the models tested.YOLOv3 has the worst detection effect among all models,only detecting three large defects.For small defects,as shown in the lower left corner of Fig.11a,Faster R-CNN,SSD,YOLOv7,and YOLOv8 failed to detect them.In comparison to these two models,YOLO-DD can detect some small defects that were previously missed.The SSD and YOLOv3 models demonstrate the worst detection performance,where even slightly smaller defects were undetected.
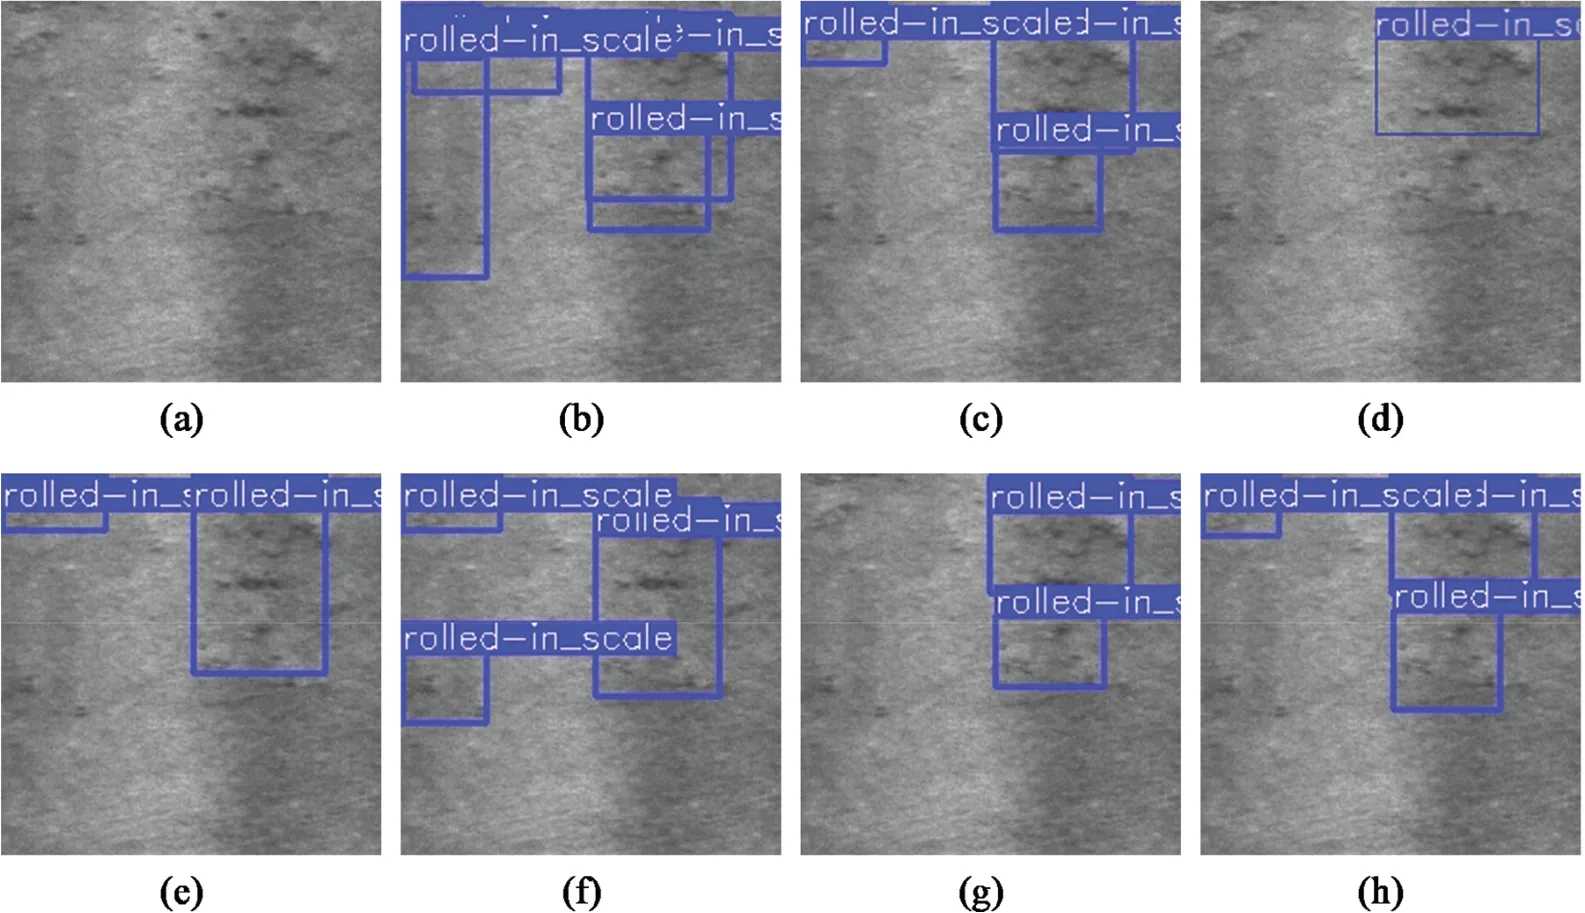
Figure 10:Defect results for RS on the NEU-DET dataset.(a)Original image.(b)The detection result of the Faster R-CNN.(c) The detection result of the SSD.(d) The detection result of the YOLOv3.(e) The detection result of YOLOv5.(f) The detection result of YOLO-DD.(g) Detection results of YOLOv7.(h)Detection results of YOLOv8
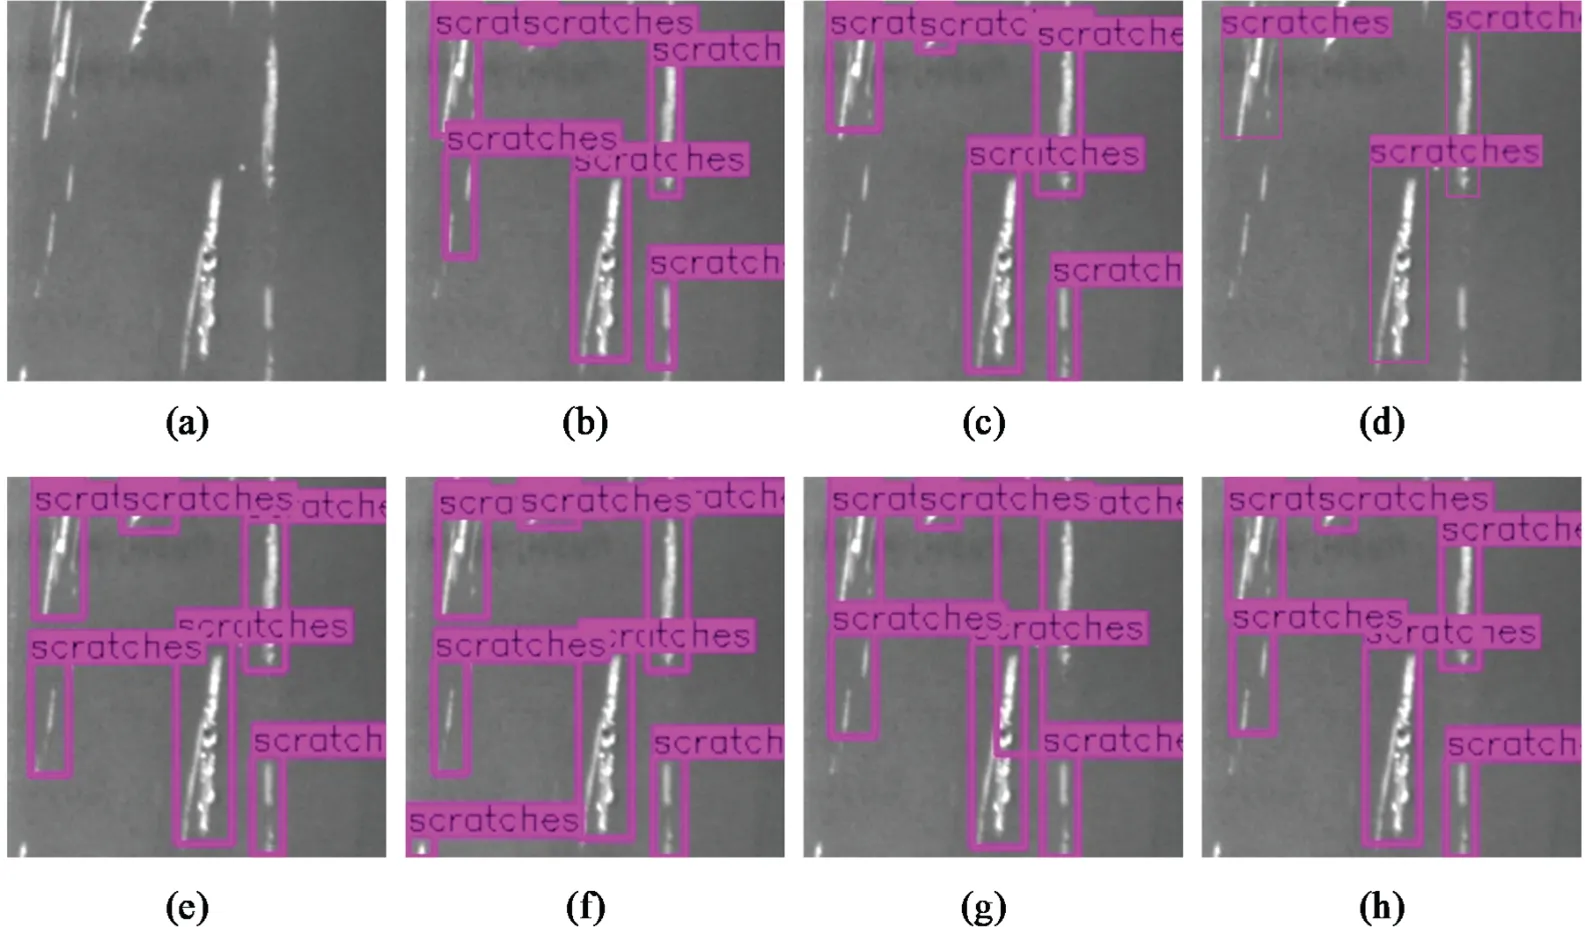
Figure 11:Defect results for Sc on the NEU-DET dataset.(a)Original image.(b)The detection result of the Faster R-CNN.(c) The detection result of the SSD.(d) The detection result of the YOLOv3.(e) The detection result of YOLOv5.(f) The detection result of YOLO-DD.(g) Detection results of YOLOv7.(h)Detection results of YOLOv8
Fig.12 illustrates the predictions of the different models for the self-constructed dataset.The Faster R-CNN predicts two boxes,one of which is predicted to be too large and contains many regions without defects.SSD,YOLOv3,YOLOv7,and YOLOv8 only detect one type of defect and miss the defects in the upper left region.Only YOLOv5 and YOLO-DD succeeded in detecting all defects and accurately labeling their precise locations.

Figure 12:Self-constructed dataset defect detection results.(a)Original picture.(b)The detection result of the Faster R-CNN.(c)The detection result of the SSD.(d)The detection result of the YOLOv3.(e)The detection result of YOLOv5.(f)The detection result of YOLO-DD.(g)The detection results of YOLOv7.(h)The detection results of YOLOv8
6 Conclusion
This paper presents YOLO-DD,a defect detection model based on YOLOv5.A module called RDAT,which is based on an Improved Swin Transformer Block is designed to provide global sensing of target defects in the backbone of the network.To address the problem of information loss caused by upsampling and downsampling,IGFS and SE modules are introduced in the neck to improve the overall performance of the network.YOLO-DD achieves 82.41% mAP on the NEU-DET dataset,which is 2.0%improvement over the vanilla YOLOv5,with an FPS of 38.25.On the self-constructed fabric defect dataset,YOLO-DD outperforms YOLOv5,indicating that the structure meets the realtime requirements and achieves higher accuracy.
In the future,we consider introducing semi-supervised or even unsupervised learning for industrial defect detection to make up for the challenges of difficult access to industrial data sets.In addition,we will concentrate on the compression of the model for a lighter model to be used in the defect detection factory.
Acknowledgement:The authors thank the financial support of the National Natural Science Foundation of China (Grants 32171909,51705365,52205254).The Guangdong Basic and Applied Basic Research Foundation (Grants 2020B1515120050,2023A1515011255).The Guangdong Key R&D Projects (Grant 2020B0404030001).The Scientific Research Projects of Universities in Guangdong Province(Grant 2020KCXTD015),and the Ji Hua Laboratory Open Project(Grant X220931UZ230).We also wish to thank the anonymous reviewers for their kind advice.
Funding Statement:This work was supported in part by the National Natural Science Foundation of China under Grants 32171909,51705365,52205254.The Guangdong Basic and Applied Basic Research Foundation under Grants 2020B1515120050,2023A1515011255.The Guangdong Key R&D projects under Grant 2020B0404030001,and the Scientific Research Projects of Universities in Guangdong Province under Grant 2020KCXTD015.The Ji Hua Laboratory Open Project under Grant X220931UZ230.
Author Contributions:Study conception and design: Jinhai Wang,Lufeng Luo and Wei Wang;data collection:Zongyin Zhang,Jingxian Zhao and Mingyou Chen;analysis and interpretation of results:Jinhai Wang,Wei Wang and Xuemin Lin;draft manuscript preparation:Wei Wang and Jinhai Wang.All authors reviewed the results and approved the final version of the manuscript.
Availability of Data and Materials:The publicly the NEU-DET dataset and the fabric dataset can be found at: http://faculty.neu.edu.cn/songkechen/zh_CN/zhym/263269/list/index.html and https://www.aitex.es/afid/.The result data used to support the findings of this study are available from the corresponding author upon request.
Conflicts of Interest:The authors declare that they have no conflicts of interest to report regardihe present study.
杂志排行
Computers Materials&Continua的其它文章
- Fuzzing:Progress,Challenges,and Perspectives
- A Review of Lightweight Security and Privacy for Resource-Constrained IoT Devices
- Software Defect Prediction Method Based on Stable Learning
- Multi-Stream Temporally Enhanced Network for Video Salient Object Detection
- Facial Image-Based Autism Detection:A Comparative Study of Deep Neural Network Classifiers
- Deep Learning Approach for Hand Gesture Recognition:Applications in Deaf Communication and Healthcare