An Assisted Diagnosis of Alzheimer’s Disease Incorporating Attention Mechanisms Med-3D Transfer Modeling
2024-03-12YanmeiLiJinghongTangWeiwuDingJianLuoNaveedAhmadandRajeshKumar
Yanmei Li ,Jinghong Tang ,Weiwu Ding ,Jian Luo ,Naveed Ahmad and Rajesh Kumar
1School of Artificial Intelligence,Chongqing University of Technology,Chongqing,400054,China
2Computer School,China West Normal University,Nanchong,637009,China
3Department of Computer Science,Prince Sultan University,Riyadh,11586,Saudi Arabia
4Yangtze Delta Region Institute(Huzhou),University of Electronic Science and Technology of China,Huzhou,313001,China
ABSTRACT Alzheimer’s disease(AD)is a complex,progressive neurodegenerative disorder.The subtle and insidious onset of its pathogenesis makes early detection of a formidable challenge in both contemporary neuroscience and clinical practice.In this study,we introduce an advanced diagnostic methodology rooted in the Med-3D transfer model and enhanced with an attention mechanism.We aim to improve the precision of AD diagnosis and facilitate its early identification.Initially,we employ a spatial normalization technique to address challenges like clarity degradation and unsaturation,which are commonly observed in imaging datasets.Subsequently,an attention mechanism is incorporated to selectively focus on the salient features within the imaging data.Building upon this foundation,we present the novel Med-3D transfer model,designed to further elucidate and amplify the intricate features associated with AD pathogenesis.Our proposed model has demonstrated promising results,achieving a classification accuracy of 92%.To emphasize the robustness and practicality of our approach,we introduce an adaptive ‘hot-updating’auxiliary diagnostic system.This system not only enables continuous model training and optimization but also provides a dynamic platform to meet the real-time diagnostic and therapeutic demands of AD.
KEYWORDS Alzheimer’s disease;channel attention;Med-3D;hot update
1 Introduction
Alzheimer’s disease is a progressive neurodegenerative disease that results in impaired memory and cognitive function [1].Often,in the early stages of Alzheimer’s disease,it is challenging for physicians to diagnose,becoming apparent only in the middle stages when symptoms are evident.Moreover,definitive diagnosis is occasionally confirmed only post-mortem.Adding to the challenge,early AD is hard to differentiate from Mild Cognitive Impairment(MCI),with an annual conversion rate from MCI to AD of approximately 10%–12% [2].Statistics reveal that over 55 million people worldwide suffer from Alzheimer’s disease.China alone has over 10 million AD patients,holding the highest number globally.Alarmingly,this figure is anticipated to grow over time,with global AD cases expected to reach 78 million by 2030.Given the disease’s unique characteristics and the absence of effective treatments,early detection of AD is crucial.Consequently,there is an urgent need for research into early diagnostic techniques and methods for AD.
Age is a major risk factor for the onset of Alzheimer’s disease,and the diagnosis of AD is usually based on history,clinical presentation,and observation of daily behavior.With the aging of the world’s population,many middle-income countries are struggling to meet the actual needs of their healthcare services,but due to the lack of data and the bias of physicians’diagnostic experience,it is difficult for patients to receive objective and repeatable judgments.Therefore,how to fully utilize the limited resources to improve the accuracy of AD diagnosis is a serious challenge.
In recent years,the development and application of artificial intelligence have been robust,with its implementation in the medical field being notably prominent[3].Deep learning can autonomously identify features from images that might be imperceptible or challenging for human observation.With the advancement of Convolutional Neural Networks [4] (CNNs),an increasing number of professionals are leaning towards deep models for network development,bringing the accurate diagnosis of AD within reach.
Transfer learning[5]is a prevalent technique in deep learning that leverages pre-trained models,refining them further to better suit new tasks or domains.Typically,only a limited amount of training data for the target task is needed to enhance performance.Given these benefits,transfer learning is frequently employed for diverse classification challenges,consistently yielding commendable outcomes.In medical image diagnosis,datasets can be challenging to amass;in such scenarios,the concept of transfer learning becomes pivotal,allowing for precise diagnostics even when models are trained on limited samples.
Magnetic Resonance Imaging(MRI)[6]offers a potent technique for visualizing the anatomical and functional neural changes linked to AD.However,due to the subdued intensity of brain cells[7,8],MRI scans often struggle to discern the subtle signal variations in the brain.Thus,this work aims to analyze these faint signal changes in brain MRI scans related to Alzheimer’s disease,endeavoring to detect these shifts as early in the progression of AD as possible.The main contributions are as follows:
(1)During MRI image scanning,it is common for the subject’s head to bob,which may result in reduced clarity and unsaturation of the image,or even unusable of the vacant image.To reduce such errors,employ a spatial normalization method for image preprocessing.
(2) Med-3D is mainly used as a network for segmentation and classification tasks and has rich scanning regions,target organs,and pathological features.Based on this,an improved Med-3D network transfer method is proposed for the Alzheimer’s disease classification task.
(3) To verify the validity of the model,a hot updating Alzheimer’s disease auxiliary diagnosis system is proposed,which facilitates the model training and optimization,and better serves the diagnosis and treatment of Alzheimer’s disease.Alzheimer’s disease diagnosis and treatment.
In summary,the structure of this paper is divided as follows:Section 1 focuses on the background information of Alzheimer’s disease research and the purpose of the study;Section 2 focuses on the current status of deep learning techniques in Alzheimer’s disease diagnosis.Section 3 delves into our proposed improved Med-3D network transfer method for the classification task of Alzheimer’s disease.Section 4 is an introduction to the experimental dataset used and its findings analyzed,and based on this,the practical application of our proposed model is presented.Section 5 concludes the paper.
2 Related Work
Deep learning is a technique that employs multi-layer artificial neural networks capable of learning and extracting features from complex data.This ability enables efficient classification and recognition due to the deeper layers of the networks.In recent years,with the rise in computational power and the decrease in storage costs,building deep neural network models with vast parameters has become feasible.The convolutional neural network is a standard model in deep learning,demonstrating outstanding performance in various recognition and classification tasks.The fundamental structure of a CNN comprises a convolutional layer,a pooling layer,a fully connected layer,a ReLU activation function layer,and an output layer.Collectively,these components constitute the distinctive structure of a CNN,making it particularly effective for processing image data.With the ongoing development and refinement of CNNs,deep learning theory has evolved.Deep learning has extensive applications,encompassing target detection,image segmentation,and image super-resolution reconstruction,among others.Moreover,in the medical arena,deep learning has yielded notable results in classifying diseases,such as Alzheimer’s disease.
Convolutional networks have made many advances in AD diagnosis in recent years.Basaia et al.[9]applied CNN to the ADNI database and tested the classification of AD,cMCI,and sMCI.The model’s experimental results were promising,proving that CNN is effective for the classification of AD.Islam et al.[10] proposed a deep CNN for pairwise checking of AD,using the OASIS dataset for numerous experiments.The results indicated that the classification accuracy between nondementia and mild dementia was superior to other models.Lu et al.[11]utilized fluorodeoxyglucose positron emission tomography(FDG-PET)to capture brain metabolic activities and designed a multiscale deep neural network based on FDG-PET to recognize patients with AD at the MCI stage.The results showed that the model,using only FDG-PET metabolic data,achieved an accuracy of 82.51%,outperforming other FDG-PET models of the same period.In literature [12],an efficient 3D convolutional neural network (3D ConvNet) was introduced.The 3D ConvNet,comprising 8 layers,utilized the first 5 layers for feature extraction,while the last 3 layers were fully connected layers for AD/NC classification,enabling swift AD classification on larger datasets.Li et al.[13]proposed multiclustered dense convolutional neural networks for AD classification.Initially,the brain image was segmented into different regions.Subsequently,the means clustering method grouped the patches of different regions,the learned features of each region were assembled for classification,and the classification results from different regions were integrated to enhance the accuracy of the outcome.The results suggested promising development prospects for this method.Wang et al.[14]prioritized early AD diagnosis and employed a recurrent neural network to construct the AD early detection model(AD-EDM).The results demonstrated that the AD-EDM’s accuracy was markedly superior to traditional models.Jain et al.[15]adopted a transfer learning approach to expedite CNN network training,leveraging VGG-16 trained on the ImageNet dataset as a feature extractor.The 3-way classification accuracy achieved was 95.73%.Kazemi et al.[16]undertook thorough preprocessing of the fMRI data before deploying the classic AlexNet model in the CNN architecture.Processes included tissue removal,spatial smoothing,high-pass filtering,and spatial normalization,enhancing the AlexNet model’s accuracy for AD detection.Recognizing the importance of identifying MCI patients at high risk of progressing to AD,Lin et al.[17]introduced a CNN-based method to forecast those at high conversion risk from MCI to AD.The MRI data underwent corrections and brain structural feature extraction using FreeSurfer to boost AD classification accuracy.Results indicated CNN’s potential in predicting MCI conversion.
Oh et al.[18]developed an end-to-end CNN model and employed a gradient-based visualization technique to enhance diagnostic accuracy.The findings underscored this method’s superiority and identified the temporal and parietal lobes as vital diagnostic biomarkers for AD.In literature[19],a DL algorithm was formulated to predict AD’s final diagnosis.A CNN with InceptionV3 architecture was trained on 90%of the ADNI dataset,using the remaining 10%as a test set.The results highlighted the algorithm’s 100%sensitivity and 82%specificity.Literature[20]offered a DL model to assist in AD diagnosis,employing two independent CNN models to cultivate a multimodal deep learning network.The multimodal model’s diagnostic outcomes were integrated with clinical neuropsychological findings to minimize early AD misdiagnosis.Trials on the ADNI database confirmed the method’s efficacy in AD diagnosis.Finally,Lee et al.[21]crafted a multimodal recurrent neural network to predict MCIto-AD conversion,amalgamating various biomarkers.The integrated architecture’s results suggested its potential utility in clinical trials.Li et al.[22] introduced Multihead Central Self Attention(MCSA)to capture highly localized relations,and the introduction of sliding windows helps to capture spatial structure.Meanwhile,the introduced Simple Visual Transformer(SimViT)extracts multi-scale hierarchical features from different layers for dense prediction tasks.Experiments demonstrate that the proposed generalized backbone network exhibits good performance.Zhang et al.[23] proposed a densely connected convolutional neural network with the attentional mechanism for learning multilevel features of MR images of the brain and extended its convolutional operation to 3D.Experimental results showed that the algorithmic performance of this method ranked among the best and improved the discrimination of MCI subjects who are highly likely to transform into attention deficit disorder.Yan et al.[24]explored the effects of different image-filtering methods and pyramidsqueezing attention mechanisms on image classification of Alzheimer’s disease,and the experimental results showed that different image-filtering methods and attention mechanisms provide effective help in the diagnosis and classification of Alzheimer’s disease.Li et al.[25] conducted a comprehensive literature survey and analysis on the application of deep learning attention methods in medical image analysis.The remaining challenges,potential solutions,and future research directions were discussed.Illakiya et al.[26]proposed an adaptive hybrid attention network with two attention modules,which extracts spatial and contextual information on a global scale while capturing important long-range dependencies.Experiments show that the proposed network exhibits good performance.Mohi ud din dar et al.[27] used transfer learning as a determinant to gain the advantage of pre-trained health data classification models.The study developed a novel framework for recognizing different AD stages.The main advantage of this new approach is the creation of lightweight neural networks.Liu et al.[28] proposed the multimodal hybrid transformer,a disease classification transformer.The model uses a novel cascading modal converter architecture to integrate multimodal information through cross-focusing to make more informed predictions.A novel modal culling mechanism is also proposed to ensure unprecedented modal independence and robustness in handling missing data.Experiments demonstrate that the proposed multifunctional network exhibits excellent performance.de Mendonga et al.[29] used a graph kernel constructed from texture features extracted from sMR images to classify MR images for AD diagnosis.This method facilitates the task of Alzheimer’s disease image classification by SVM,in addition to allowing the use of different texture attributes for the diagnosis of Alzheimer’s disease,by using a graph kernel approach to represent the texture features of different regions of the brain image.
Based on the problems analyzed above,this paper proposes an improved Med-3D network transfer method for the classification task of Alzheimer’s disease,and the classification model has a high classification accuracy.The constructed Alzheimer’s disease-assisted diagnosis system based on hot update SDK can allow users to use the latest AD diagnostic model without any sensation to achieve the latest and highest accuracy,and the modified system avoids the trouble caused to hospitals due to upgrading the version or replacing the model.
3 Improved Classification Tasks for Alzheimer’s Disease Med-3D Network Transfer Approach
Based on the problems analyzed above,this paper proposes an improved Med-3D network transfer method for the classification task of Alzheimer’s disease,and the classification model has a high classification accuracy.The constructed Alzheimer’s disease diagnosis system based on hot updating[30] SDK can allow users to use the latest AD diagnosis model without any feeling and achieve the highest accuracy,and the system avoids the trouble caused by upgrading the version or replacing the model to the hospitals.The block diagram of the proposed algorithm is shown in Fig.1.

Figure 1:The flowchart of the proposed algorithm
3.1 3D MRI Image Sharpness Processing
Subject movement,such as head bobbing,is common during MRI scanning,which can lead to reduced sharpness,unsaturation of the image,or even produce unusable images.To address these issues,we implemented a specific image preprocessing scheme.
Due to varied image acquisition protocols and equipment used,the spacing between pixels in each image differs.For instance,one pixel in an image might represent 1 mm of actual distance,while in another image,one pixel might signify 1 cm.This discrepancy is significant,and the CNN network cannot inherently learn and adjust for it.Such variations introduce substantial uncertainty into the analysis.To mitigate this,we employ a particular image preprocessing strategy.To diminish the effects of these variations on the analysis,we adopted the following spatial normalization method [31],as illustrated in Eqs.(1)and(2)below:
Transforming an image to a consistent resolution helps counteract the variances in pixel spacing.To prevent excessive discrepancies,each image’s differences are aligned with its median spacing,ensuring that the target pixel spacing remains consistent within its domain.represents the spacing on each of the x,y,and z axes of the ith image in domain j,where al pertains to x,y,or z.signifies the median spacing within the jth domain.fmeddenotes the median-taking operation,and Njrepresents data extraction from the jth domain.is the latest size calculated from the original image.
Given that the source domain images are multimodal,encompassing both CT and MRI,there are inherent grayscale discrepancies between them.Hence,image normalization is essential.To sidestep the effects of outliers,gray values ranging between 0%–0.5%and 99.5%–100%are excluded.The mean value is then subtracted and divided by the standard deviation.Subsequently,the processed image is normalized to a specific grayscale[31],as outlined in Eq.(3):
Due to the differences in threshold ranges between the different thresholds,the mean vmand vsd,the standard deviation of the monomers were used to make the conversion of vito.After the steps described,the input image is transformed into the model’s input data,with grayscale normalization completed.
3.2 Proposed Med-3D-Based Classification Network
Med-3D primarily addresses segmentation tasks,supporting 3D segmented datasets,which contain both MRI and CT,with a rich set of scan regions,target organs,and pathology features,target organs and pathology features.Its source domain encompasses features of the brain,heart,hippocampus,pancreas,prostate,blood vessels,liver,and spleen[31].These extensive source domain attributes expedite the network’s convergence and amplify diagnostic precision post-migration.In our work,an improved Med-3D network transfer method for the classification task of Alzheimer’s disease is proposed.Fig.2 shows the improved Med-3D network transfer method proposed by our institute.

Figure 2:Improved transfer method for Med-3D networks
3.2.1 Backbone Model Structure
Med-3D predominantly employs the 3D-ResNet as its backbone network.This mainstay network comprises four modules: layer1,layer2,layer3,and layer4.Before accessing these layers,one must navigate through conv1,followed by bn1,relu,and maxpool.Conv1 represents a singular 3D convolution operation,kernel_size=7,stride=2 ∗2 ∗2,padding=3,devoid of a bias term.The bn1 layer constitutes a singular 3D operation,which is articulated in Eq.(4):
x denotes the value of the input,E(x)is the mean,Var(x)is the variance,γ and β are the learnable parameters,and y is the input result.Normalization can effectively avoid gradient vanishing and gradient explosion,and expedite the model’s convergence.This is succeeded by the ReLU operation,represented the Eq.(5):
The subsequent operation is Maxpool,with kernel_size=7,stride=2,padding=1.Following this,the sequence progresses to the backbone network layer.This layer employs a 3D-ResNet composition.Using ResNet as the primary structure.Layered layers are not fixed-layer CNN models but dynamically generated layers.The options include ResNet-10,ResNet-18,ResNet-34,ResNet-50,ResNet-101,ResNet-152,and ResNet-200.The ResNet configurations with 10,18,and 34 layers are generated by the model1 module,while ResNets with 50,101,152,and 200 layers are produced by the model2.The specific Backbone module in our proposed model is shown in Fig.3.
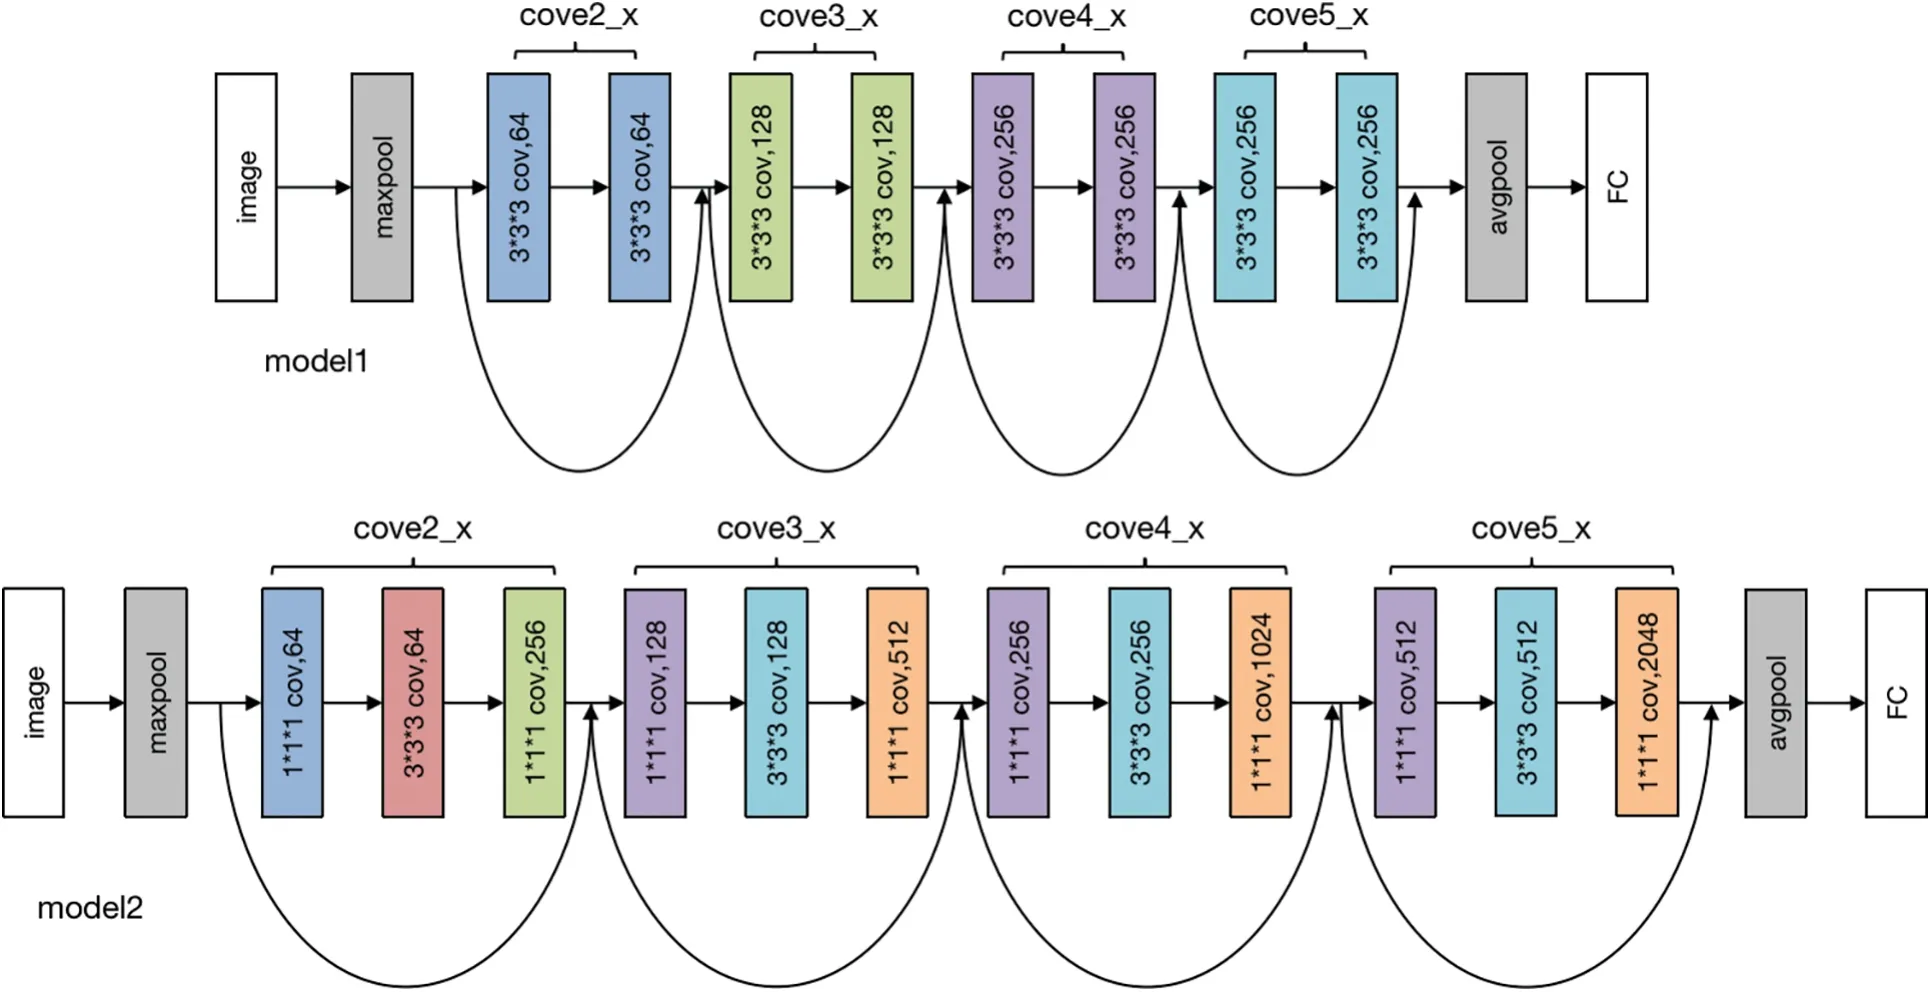
Figure 3:Backbone module
3.2.2 Proposed Model Structure
Our model uses the Med-3D network as the backbone of the model,and then we use the fully connected layer to replace the original segmentation network to achieve the purpose of classification,and the relocation diagram is shown in Fig.4.After that,to improve the effect of the model,we proposed an improvement program by adding the SE module of the attention mechanism,and the improvement schematic is shown in Fig.4.

Figure 4:The proposed channel attention-based transfer approach
In this paper,a network model based on Med-3D network transfer is proposed,and the SE module attention module is added after the output layer of layer4.Modules are plugged into the Med-3D network model,and the SE module added contains a pooling layer Pooling,a fully connected layer FC,and an activation layer ReLU,after which the image is scaled to its original size after undergoing Sigmoid.Although the parameters of the model are increased,it will improve the performance of the model substantially.The detail of the attention module is displayed in Fig.5.

Figure 5:Attention module design
The improved method adds a common SE module after layer 4 and then accesses a fully connected layer for the AD classification task.The detailed information on the migrated network for the number of layers is shown in Table 1.
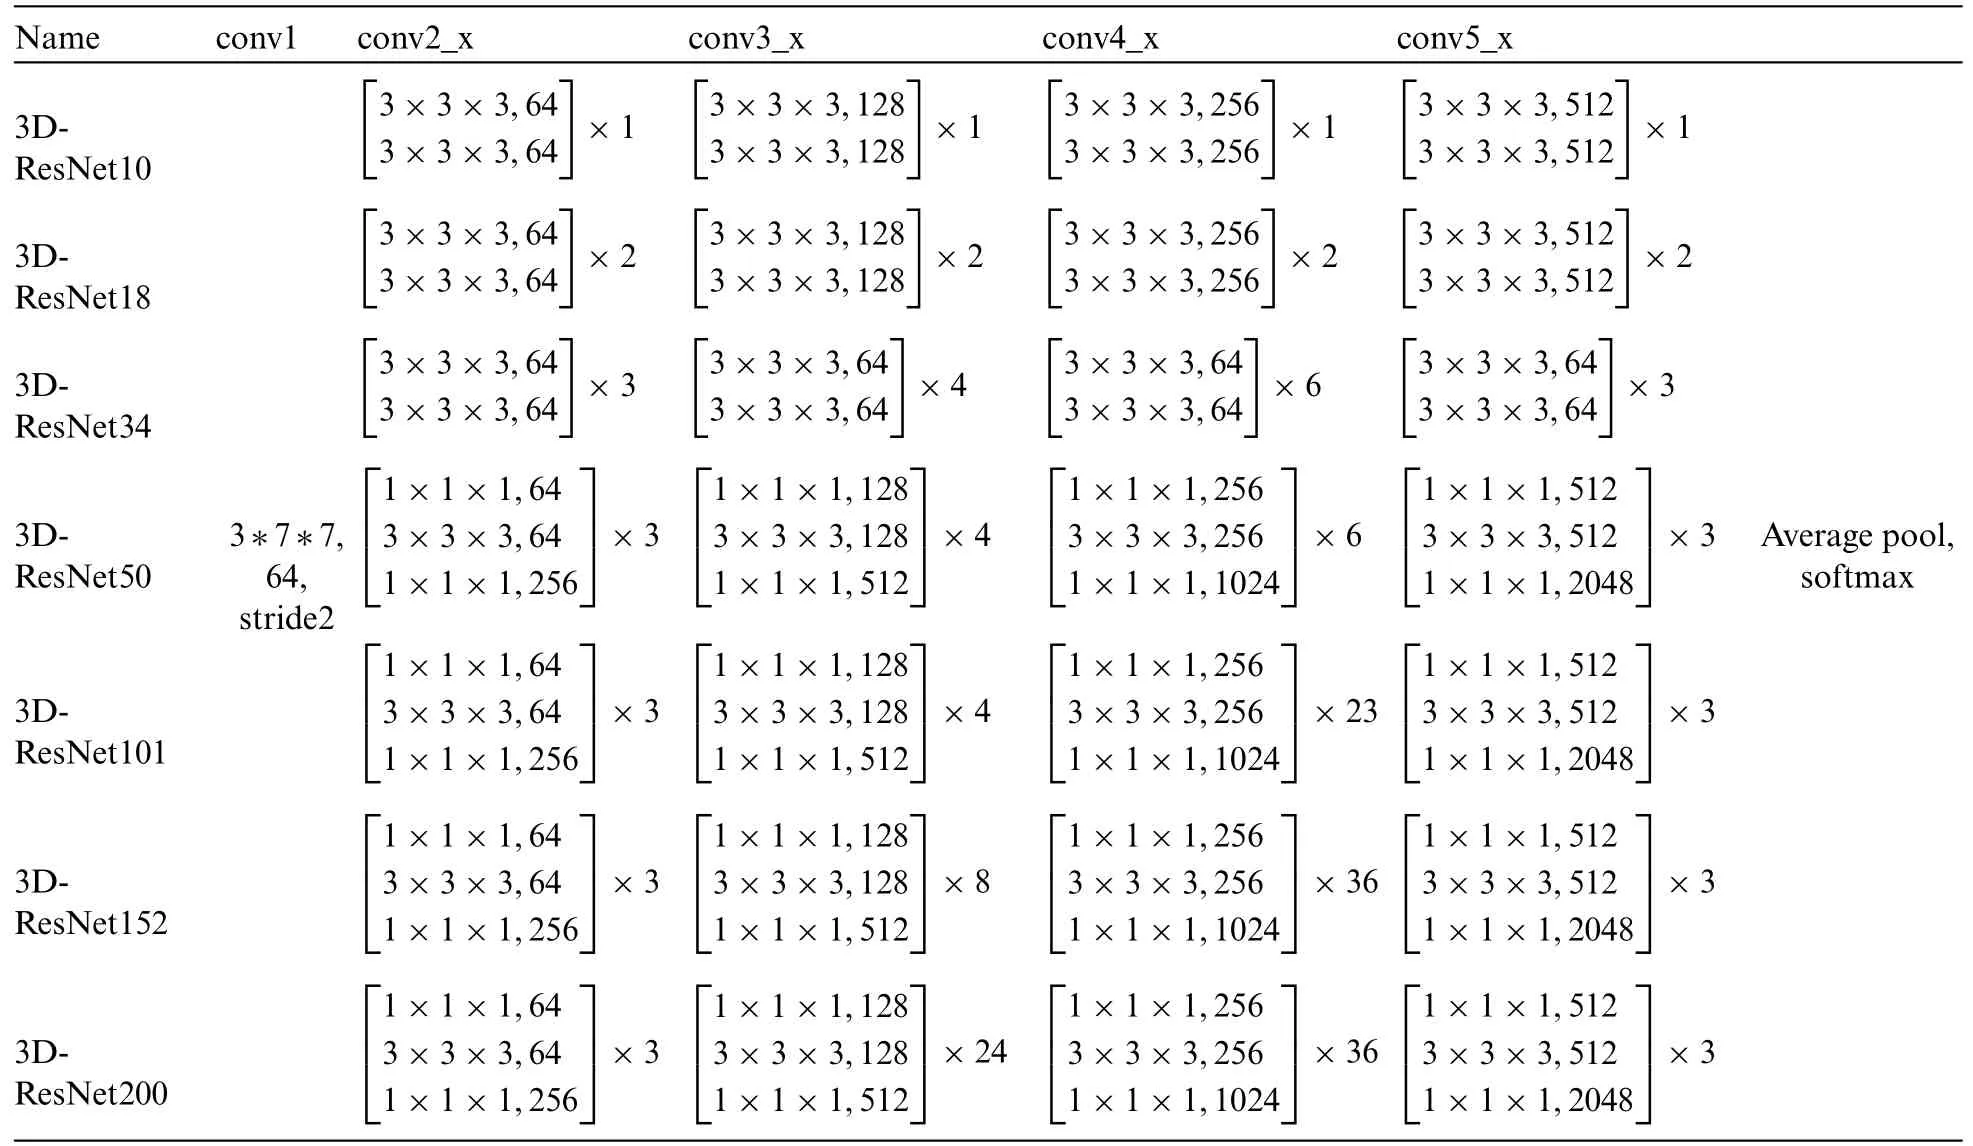
Table 1: 3D-ResNet different deep network layer structure
3.2.3 Loss Function
The loss function plays an important role in assessing the difference between the predicted and actual categories of a model as well as the model’s ability.In real-world tasks,both segmentation and classification tasks,the smaller the value of the loss function,the better the model shows its ability.In the experiments,if the loss value decreases faster,it proves that the model’s learning ability is stronger,and at the same time,the size of the required dataset is smaller,and better results can be achieved with the same amount of training data.
Considering that this paper deals with multiple classification tasks,the cross-entropy loss function commonly used in multiple classification models is used.This loss function has achieved good results in multiple classification tasks,and its formula is shown in Eq.(6):
where n represents the number of samples,m denotes the number of categories,i denotes the index where the current category is located,yicand picdenote the version as the true predicted probability of category c and the predicted probability of the model output.The final predicted categorization categories are derived from the Softmax function which is commonly used in multi-categorization tasks and its formula is shown in Eq.(7):
In the above equation,zcrepresents the output of the fully connected layer,which is subsequently obtained by the Softmax function pic.The model adopts the stochastic gradient descent algorithm(SGD)as the optimization strategy.Compared to other gradient descent algorithms,SGD does not need to update the model parameters only after training all the samples,but instead updates the weights of the network model in a minimum-batch manner.This not only reduces the time required for training but also reduces the possibility of overfitting the model.
4 Experimental Results and Analysis
4.1 ADNI MRI Dataset
The data used in this paper was obtained from The Alzheimer’s Disease Neuroimaging Initiative(ADNI) [32] database (https://ida.loni.usc.edu/login.jsp?project=ADNI).ADNI was founded by a consortium of medical centers and universities in the United States and Canada.It aims to provide publicly available datasets for the identification and precise diagnosis of the biomedical hallmarks of AD and the ongoing follow-up of trial participants.With its expansion,ADNI has become the leading source for studying AD through longitudinal,multi-site MRI images.
The main purpose of ADNI-1 was to study biomedical markers for use in clinical trials.The project spanned 5 years,beginning in 2004.It collected data from 200 NC,400 MCI,and 200 AD subjects.MRI and PET[33]were the primary imaging modalities,accumulating a vast amount of brain imaging data.Additionally,genetic profiles[34]were gathered,and concurrent research led to the discovery of blood and cerebrospinal fluid biomedical markers.
ADNI-GO commenced in 2009 and ran for two years.It added 200 subjects diagnosed with a new classification called Early Mild Cognitive Impairment(EMCI)[35]to the ADNI-1 cohort.MR protocols were adapted with the intent of detecting early-stage AD.
ADNI-2 started in 2011 and built upon the prior study.It consisted of 150 NC,100 EMCI,and 150 Late Cognitive Mild Impairment (LMCI) [36] subjects from both ADNI-1 and ADNI-GO.An additional 107 Significant Memory Concern (SMC) subjects were included to bridge the difference between NC and MCI.ADNI-2’s notable contribution was the incorporation of Florbetapir amyloid PET scans for all participants in ADNI-GO and ADNI-2.This was pivotal in the pursuit of identifying biomedical markers indicative of cognitive decline.
The ADNI-3 program was launched in 2016,primarily aiming to elucidate the interrelationships and characterizations of various biomarkers within the Alzheimer’s disease spectrum,encompassing clinical,cognitive,imaging,genetic,and biochemical facets.ADNI-3 introduced broader brain scanning techniques to identify tau protein tangles(tau PET),a vital indicator of pathology.Concurrently,this phase persistently sought to pinpoint,enhance,standardize,and validate the methods and biomarkers used in AD clinical trials.Building on the extensive prior data,ADNI-3 added 133 elderly controls,151 MCI,and 87 AD subjects to the study.
The timeline of ADNI-1,ADNI-GO,ADNI-2,and ADNI-3 development is shown in Fig.6.After years of data accumulation,the ADNI dataset has formed a large amount of information that can be utilized by researchers,providing strong research support.Since it contains MRI data of longterm changes in certain patients,it also further helps people to understand the whole process of MCI to AD,helps people to use better diagnosis of AD,and also provides some ideas to slow down the development of MCI.
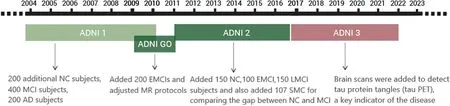
Figure 6:ADNI development stages
For this study,MRI images from 787 subjects were downloaded.Of these,data from 511 subjects were designated as the training set,while data from 276 subjects comprised the test set.In the training set,there were 154 subjects with Alzheimer’s disease with an average age of 76.03;90 were male and 64 were female.Mild Cognitive Impairment was diagnosed in 187 subjects with an average age of 74.78;96 were male and 91 were female.The normal control (NC) group had 170 subjects with an average age of 75.28;90 were male and 80 were female.In the test set,there were 83 subjects with AD,averaging 76.23 years of age;40 were male and 43 were female.The MCI group had 101 subjects with an average age of 74.38;54 were male and 47 were female.The NC group included 92 subjects with an average age of 76.38;42 were male and 50 were female.Table 2 presents detailed information about the demographic characteristics of the ADNI training set and test set in the experiment.
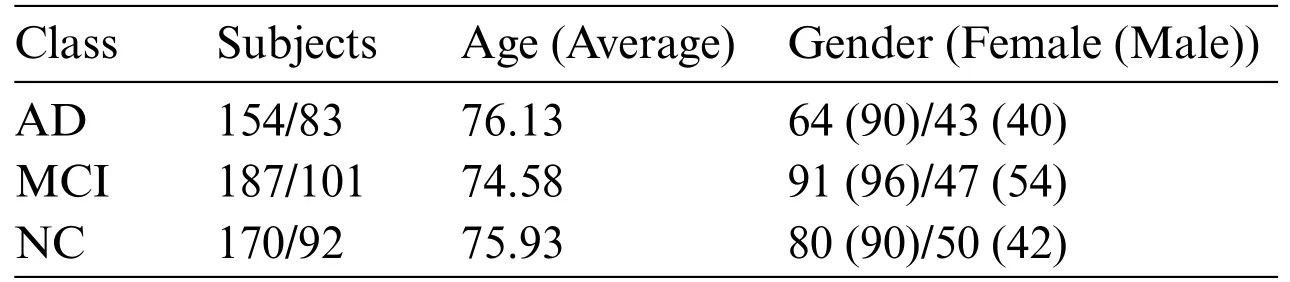
Table 2: ADNI training set/test set
4.2 Experimentation and Analysis
To evaluate the model’s performance,metrics such as Accuracy,Precision,and Recall were computed for comparison.The experiments indicate that the ResNet50 transfer is the most effective,both in the direct transfer module and when the SE module is incorporated.Throughout the experiment,60 Epochs were executed,and the Loss for each iteration was documented,as depicted in Fig.7.The experimental findings are presented in Tables 3 and 4 below.
The experimental models converged in Loss for each model after running 60 Epochs.
In Table 3’s direct transfer category,ResNet50+FC emerged as the top performer,achieving an 89% classification accuracy rate,96% precision,and 89% recall.In Table 4,SE channel attention category,ResNet50+SE+FC remained the best,registering 92% classification accuracy,93% precision,and 89%recall.The experimental outcomes reveal that increased model depth during Med-3D network-based transfer does not necessarily yield superior results for AD classification.A plausible explanation might be that as the model deepens,it requires an extensive dataset for convergence in the initial training.This makes it challenging for the model to converge;the unsaturated state of the migrated network,combined with static parameters that are not updated,may result in diminished model performance.Observations from the Loss data suggest that deeper networks exhibit greater fluctuations in Loss during migration.This underscores why ResNet50,possessing a balanced set of model parameters,delivered the finest classification outcomes.

Table 3: Comparison of accuracy,precision,and recall for different depth ResNet transfer models

Figure 7:Loss descent chart
4.3 Ablation Experiment
The purpose of the ablation experiment was to explore the specific roles of the transfer module and the SE channel attention module in the model.To discern the impact of each module,four experimental configurations were employed in the ablation studies:transfer+SE+FC,transfer+FC,no transfer+FC,and no transfer+SE+FC.Subsequent experiments were conducted across various depths of the ResNet model,utilizing consistent training and test sets to nullify any potential influence from the data.
In terms of loss performance,the model incorporating the transfer scheme exhibits a lower initial loss,whereas the model initialized with random parameters displays a higher initial loss.Furthermore,the transfer model converges more rapidly.As the model’s depth increases,its convergence rate diminishes,leading to decreased accuracy in deeper configurations.This decline can be attributed to the fact that greater model depth necessitates a larger parameter set,which in turn requires more data for convergence.Given that the dataset size remains constant in this study,there is a noticeable trend:as the model’s depth increases,its performance does not necessarily improve,and might even degrade.Nevertheless,with a larger dataset,a model with greater depth could potentially yield better outcomes.Excluding ResNet50,models equipped with the SE module outperformed their counterparts without the SE module,underscoring the SE module’s capacity to enhance AD classification.The experimental metrics,namely Accuracy,Precision,and Recall,are shown in Table 5.

Table 5: Comparison of accuracy,precision,and recall for four ResNet schemes of different depths
To facilitate the comparison of the performance of each method,a visual representation is provided in Fig.8.From this figure,it is evident that ResNet50 is the most effective,with the ResNet50+SE+FC tri-classification achieving an accuracy of 92%.Without transfer,ResNet152+SE+FC emerges as the top performer,attaining a 77% accuracy rate.Regarding precision,ResNet50+SE+FC leads with 93%,and in terms of recall,ResNet50 again proves superior with 89%.These findings affirm the efficacy of both the transfer strategy and the attention mechanism[37].
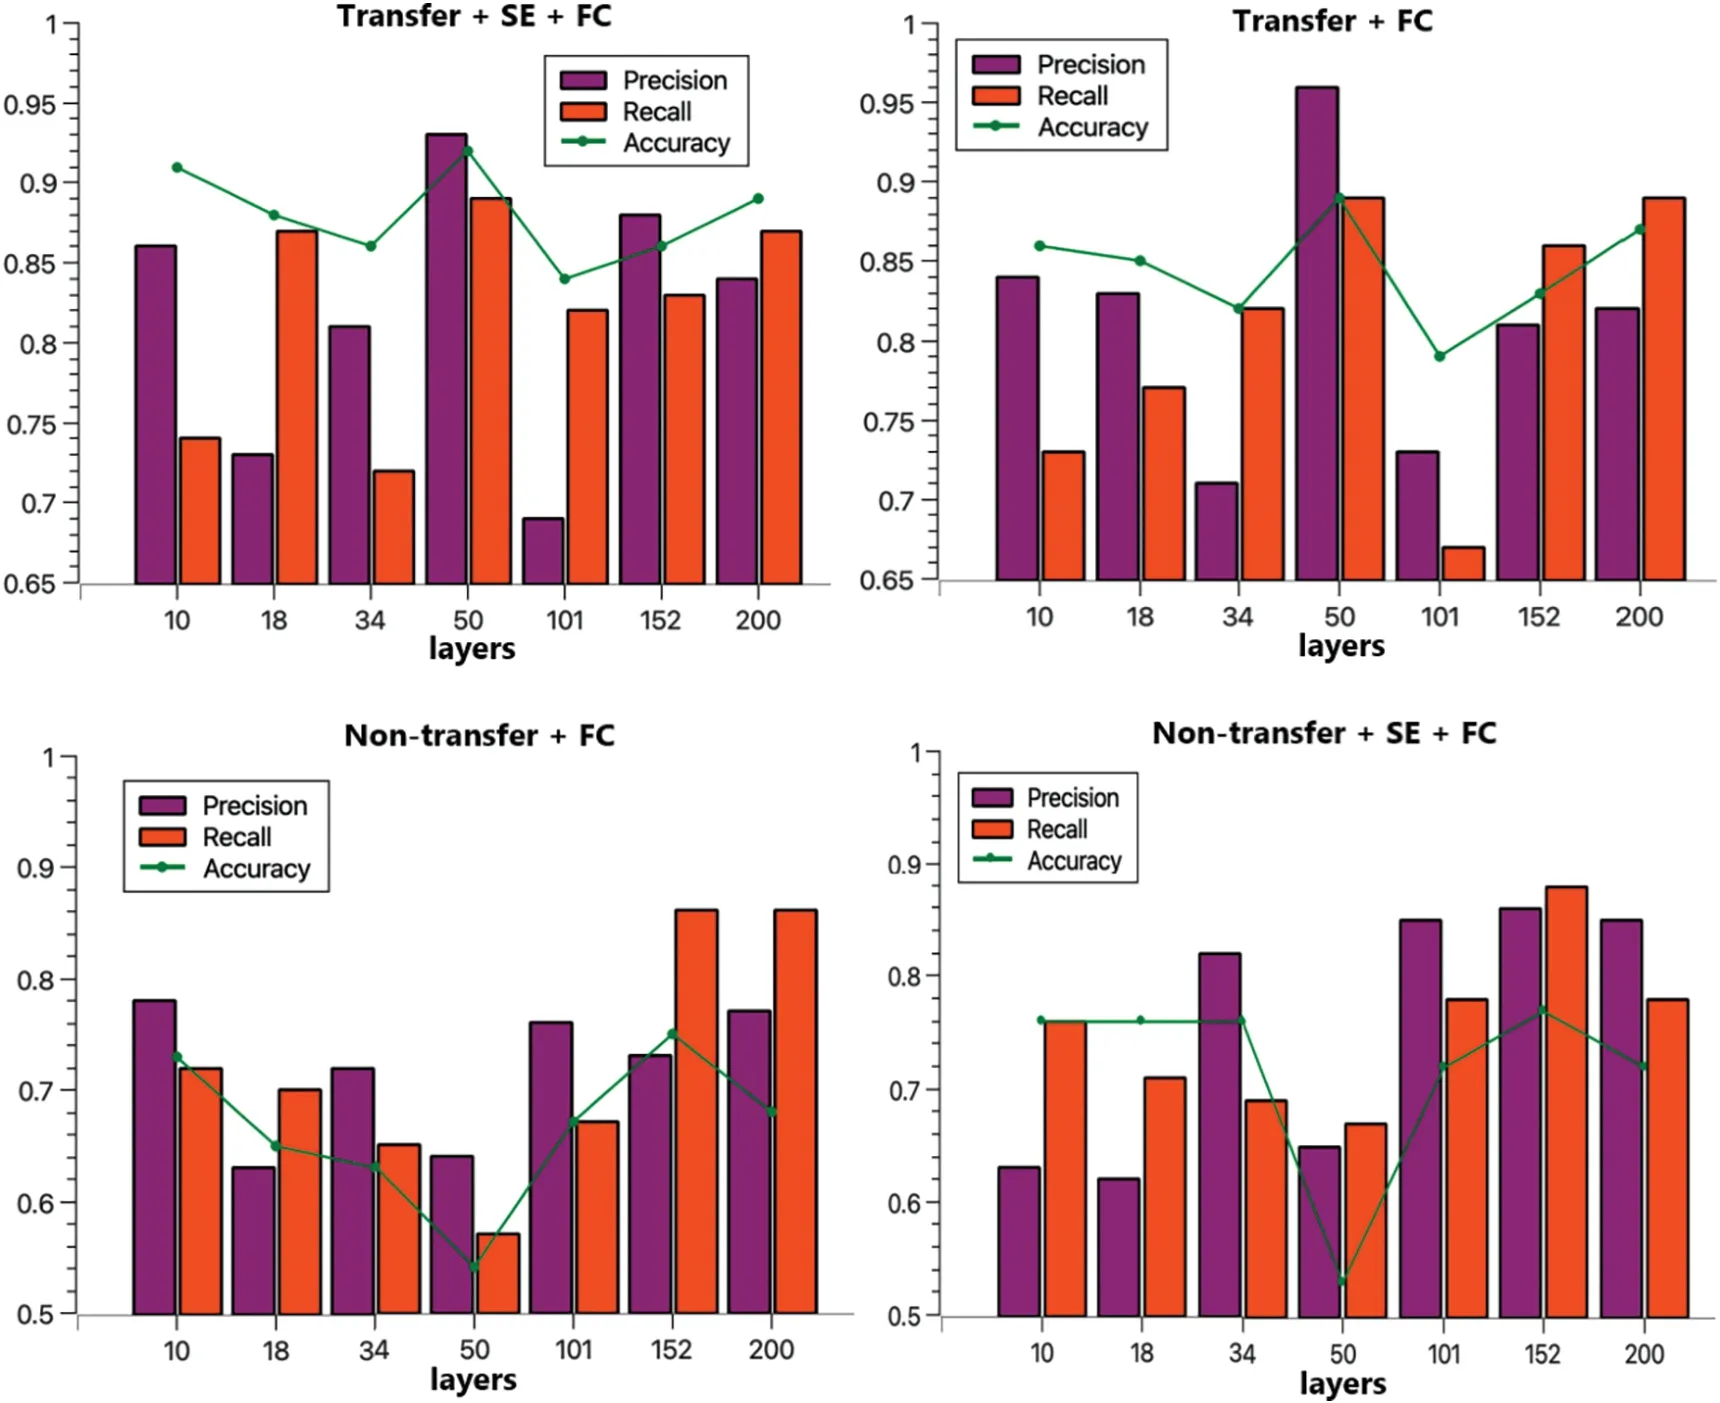
Figure 8:Comparison of four programs precision,recall,accuracy
In summary,using the same training and test sets,and after co-training for 60 Epochs,the transfer model outperformed the directly trained group,boosting accuracy by approximately 20%.Incorporating the SE module further increased accuracy by around 4%,fully validating the effectiveness of transfer based on the Med-3D network and demonstrating the SE module’s capacity to enhance AD classification.To offer a clear perspective on model performance,this subsection contrasts our approach with other models tested on the ADNI dataset.The findings are detailed in Table 6.

Table 6: Comparison of other models
The aforementioned table juxtaposes recent AD classification models,assessing their accuracy,precision,and recall metrics.When our proposed transfer and attention mechanism approach is contrasted with traditional SVM methods and various other models,it consistently outpaces competitors in terms of accuracy,with an improvement of 3 percentage points in accuracy compared to the best results literature[39].Simultaneously,both precision and recall rates remain commendably high.These outcomes further substantiate the efficacy of Alzheimer’s Disease Classification Methods grounded on Med-3D Network Transfer.
4.4 AD-Assisted Diagnosis System Based on Hot Updating
High-performance and high-precision models are emerging,to ensure that the proposed model is efficient in diagnosis,in the input of a user’s medical image can be output at the same time the results,which is the current pursuit of all diagnostic systems[42].
According to the survey,it was found that most hospitals are still using previous machine learning models for assisted diagnosis,and for Alzheimer’s disease research diagnostic accuracy,the current clinical accuracy for AD diagnosis is too low,increasing the workload of doctors.This paper proposes an assisted diagnosis solution based on hot update SDK to solve the current problem of low accuracy of clinical assisted diagnosis system,which enables users to use the latest AD diagnosis model without any sensation to achieve the latest and highest accuracy.
4.4.1 Hot Updating Methods
The overall system adheres to the traditional B/S architecture,but with a distinct difference:the hot update module is separated from the browser,serving as the main body interacting with the user and comprising the data layer,hot update layer,system service layer,communication layer,and interaction layer.The overall architecture consists of a data layer,a hot update layer,a service layer,a communication layer,and,finally,an interaction layer.Except for the interaction layer,each layer provides a certain amount of services to the layers above.
Users can use the AD diagnostic service with the latest diagnostic accuracy senselessly,eliminating the need to manually update the software or manually update the version,which greatly reduces the difficulty for users and makes the system user-friendly.The principle of hot update is shown in Fig.9:

Figure 9:Hot update schematic
As can be seen from the hot update schematic 7 above,achieving the hot update effect requires roughly eight steps.First,users must access our provided access SDK[43]through the AD diagnostic service system (any Web diagnostic system can use this SDK).At this stage,the access SDK lacks diagnostic capabilities.It will then query the server’s database for the most recent diagnostic SDK version number.Once obtained,the access SDK can load the diagnostic SDK with its full diagnostic functions,subsequently downloading the resources to the Web terminal and utilizing the AD diagnostic service the diagnostic SDK offers.
The red line illustrates the procedure for retrieving the diagnostic SDK’s version number from the database.Once the training of the new deep learning model reaches high accuracy,the SDK manager is informed,prompting the integration of this newly trained model to unveil the latest version.The server then updates the database with this latest version for future access SDK inquiries.
4.4.2 System Configuration and Development Environment
The system is developed on the MACOS platform,with an NXP Mifare1 chip and 16 GB RAM.On the browser side,HTML,CSS,and JavaScript are utilized as development languages,with React(provided by Meta,formerly Facebook)as the framework.The server side primarily uses Python3.8;this choice of Python facilitates the use of the deep learning interface provided by PyTorch.The deep learning model itself is constructed with PyTorch.The system runs on a Linux server supplied by Tencent Cloud,boasting a 1-core 2 G specification.For data storage,the server employs a MySQL database.Interactions between the front and back end are facilitated using the HTTP (Hypertext Transfer)protocol.
4.4.3 System Realization Demonstration
The SDK hot update stands as the central focus of the AD-assisted diagnosis system discussed in this paper.The activity diagram aptly captures the interplay between various roles during the system’s operation.This hot update module encompasses SDK release,doctor access,doctor account management,patient diagnosis,and condition analysis.
1) Worktop
The workbench page can partially visualize and query embedded data.This embedded data includes the total number of online accesses,the latest version of the SDK,daily platform activities,and daily hospital counts.It displays the fluctuation in access numbers over the past 12 months via a curve graph and the distribution of accessed SDKs by category using a pie chart.Concurrently,when the system administrator posts an announcement,a sequential announcement message is appended.The appearance of the workbench interface is demonstrated in the Fig.10.

Figure 10:Workbench page
2) AD Diagnosis
The diagnostic AD page allows users to upload MRI images to the server and showcases diagnostic results from the server using charts.It also offers image debugging capabilities.Given that the diagnostic SDK employed is for a three-category task,there are three bar charts displayed.The longest bar indicates the patient’s diagnostic result.For instance,as depicted in Fig.11 below,if the longest bar represents an AD diagnosis,then the patient is diagnosed with AD.
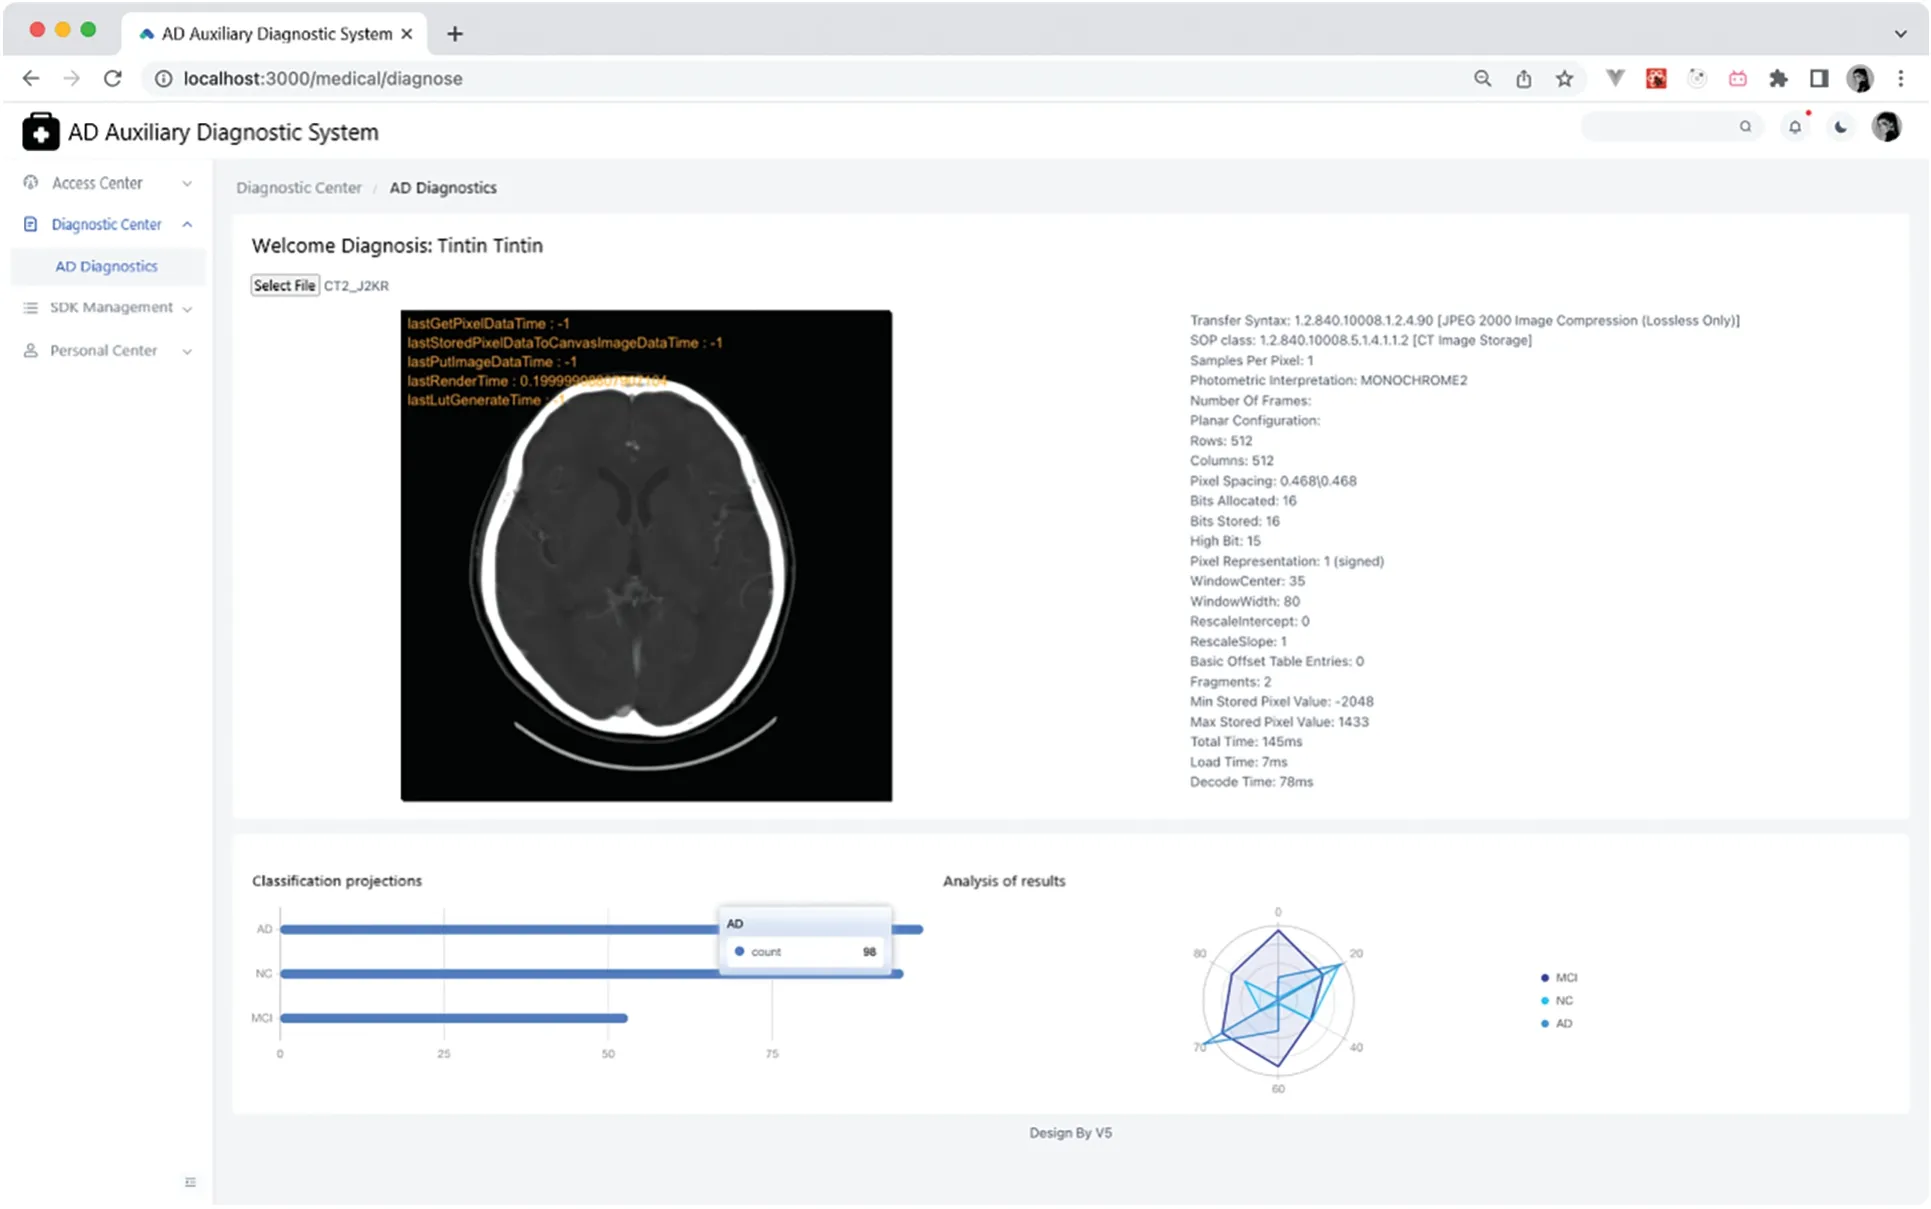
Figure 11:AD diagnostics page
Additionally,Cornerstone’s integration facilitates grayscale value[44]adjustments,aiding doctors in making more informed decisions.An example of grayscale adjustment is presented in Fig.12.

Figure 12:Grayscale adjustment comparison chart
5 Conclusions
We constructed a new Alzheimer’s disease-assisted diagnosis system based on a hot update SDK for input MRI images for AD diagnosis compared to traditional medical diagnostic methods.The system supports the following assertions: (1) The Med-3D transfer model can process the input 3D MRI images and the model diagnosis has a high accuracy rate.(2) The system can visualize the diagnostic results of the model,and after inputting a brain MRI image,it can display the acquisition of cornerstone-rendered medical images and the diagnostic results on the browser.(3) Based on the hot update SDK,the assisted diagnosis program allows users to use the latest AD diagnostic model without any feeling,to achieve the latest and highest accuracy,and to avoid upgrading the version or replacing the model to the hospitals to bring trouble.At the same time,it supports the ability of visual data display,which is convenient for model trainers to make further adjustments to the deep learning model.Although our experiments show that the proposed Med-3D transfer model performs well on AD diagnostic tasks,it does not differentiate the exploration of its more detailed categorization stages,such as EMCI,LMCI,etc.So in our subsequent studies,we will also investigate this aspect more deeply and apply the model to more practical scenarios.
Acknowledgement:The authors would like to thank the anonymous reviewers and the editor for their help.
Funding Statement:This research was funded by the National Natural Science Foundation of China(No.62076044),Scientific Research Foundation of Chongqing University of Technology(No.2020ZDZ015).
Author Contributions:The authors confirm contribution to the paper as follows: study conception and design: Yanmei Li,Jinghong Tang,Jian Luo,Naveed Ahmad,Rajesh Kumar;data collection:Jinghong Tang,Weiwu Ding;analysis and interpretation of results:Jinghong Tang,Weiwu Ding;draft manuscript preparation:Yanmei Li,Jinghong Tang.All authors reviewed the results and approved the final version of the manuscript.
Availability of Data and Materials:The data used in this paper can all be found in Google Scholar,where Part IV uses the dataset on https://adni.loni.usc.edu/.
Conflicts of Interest:The authors declare that they have no conflicts of interest to report regarding the present study.
杂志排行

Computers Materials&Continua的其它文章
- Fuzzing:Progress,Challenges,and Perspectives
- A Review of Lightweight Security and Privacy for Resource-Constrained IoT Devices
- Software Defect Prediction Method Based on Stable Learning
- Multi-Stream Temporally Enhanced Network for Video Salient Object Detection
- Facial Image-Based Autism Detection:A Comparative Study of Deep Neural Network Classifiers
- Deep Learning Approach for Hand Gesture Recognition:Applications in Deaf Communication and Healthcare