A Measurement Study of the Ethereum Underlying P2P Network
2024-03-12MohammadMasoudYousefJaradatAhmadManasrahMohammadAliaKhaledSuwaisandSallyAlmanasra
Mohammad Z.Masoud ,Yousef Jaradat ,Ahmad Manasrah ,Mohammad Alia ,Khaled Suwais and Sally Almanasra
1Electrical Engineering Department,Al-Zaytoonah University of Jordan,Amman,11733,Jordan
2Mechanical Engineering Department,Al-Zaytoonah University of Jordan,Amman,11733,Jordan
3Computer Science Department,Al-Zaytoonah University of Jordan,Amman,11733,Jordan
4Faculty of Computer Studies,Arab Open University,Riyadh,11681,Saudi Arabia
ABSTRACT This work carried out a measurement study of the Ethereum Peer-to-Peer (P2P) network to gain a better understanding of the underlying nodes.Ethereum was applied because it pioneered distributed applications,smart contracts,and Web3.Moreover,its application layer language“Solidity”is widely used in smart contracts across different public and private blockchains.To this end,we wrote a new Ethereum client based on Geth to collect Ethereum node information.Moreover,various web scrapers have been written to collect nodes’historical data from the Internet Archive and the Wayback Machine project.The collected data has been compared with two other services that harvest the number of Ethereum nodes.Our method has collected more than 30%more than the other services.The data trained a neural network model regarding time series to predict the number of online nodes in the future.Our findings show that there are less than 20%of the same nodes daily,indicating that most nodes in the network change frequently.It poses a question of the stability of the network.Furthermore,historical data shows that the top ten countries with Ethereum clients have not changed since 2016.The popular operating system of the underlying nodes has shifted from Windows to Linux over time,increasing node security.The results have also shown that the number of Middle East and North Africa(MENA)Ethereum nodes is neglected compared with nodes recorded from other regions.It opens the door for developing new mechanisms to encourage users from these regions to contribute to this technology.Finally,the model has been trained and demonstrated an accuracy of 92%in predicting the future number of nodes in the Ethereum network.
KEYWORDS Ethereum;measurement;ethereum client;neural network;time series forecasting;web-scarping;wayback machine;blockchain
1 Introduction
Blockchain technology has emerged as a revolutionary innovation that has the potential to transform numerous industries[1].It is a decentralized,transparent,and immutable ledger that enables secure and trustless data storage and transfer[2].Blockchain technology has evolved beyond its initial usage as a digital currency platform and is gradually finding its way into various business domains,such as Internet of Things(IoT)security[3],the vehicle industry[4],healthcare applications[5,6]and non-fungible tokens(NFTs)[7].
The evolution of blockchain technology has given rise to Web3,the next-generation web that is revolutionizing the way we interact with the internet[8].Web3 is the decentralized web that empowers users with complete control over their digital assets,data,and privacy.It is based on blockchain technology and smart contracts [9],which enable trustless and secure interactions between parties without the need for intermediaries.Smart contracts are computer programs that automate the execution of agreements between parties on the blockchain.When certain predefined conditions are met,a smart contract executes the code automatically,thereby removing the need for intermediaries,reducing costs,and improving efficiency.The smart contracts have emerged with the Ethereum blockchain network.This network was the first blockchain to allow users to create Web3 public applications and host these applications and their data over the network.Ethereum has adopted the Solidity[10]programming language to generate smart contracts.As a result,this language has been used in a variety of public and private blockchain networks,including Polkadot,Binance Smart Chain,and Tron.
One of the significant advantages of using blockchain technology is its transparency and immutability.All transactions on the blockchain are publicly visible and tamper-proof[11],providing an immutable audit trail of all activities on the network.This transparency eliminates the need for intermediaries and reduces the risk of fraud or corruption.These advantages allowed Web3 and smart contract applications to proliferate.However,smart contracts,Solidity,and Web3 are the application layer of blockchain networks.Developers emphasize the structure of distributed applications(Dapps)only.Few works have been conducted to study the architecture of the underlying P2P paradigm,its distribution,hardware machines,node resiliency,and the future forecasting of this technology.
In this work,a measurement study has been conducted to study Ethereum nodes to gain more insights into the past,present,and future of this network.This measurement study attempts to answer questions about the stability of the network over time,its regional distribution,and how to encourage others to contribute to this technology.A new Ethereum network has been developed to harvest and discover nodes in the network.The developed client is a modified version of the Geth client.The client’s data has been analyzed in two different scenarios: as a three-month block of data and as a one-day snapshot data.Moreover,to study the past of nodes in the network,a web scraper has been written to crawl the data from the Internet archive of the Wayback Machine project.The harvested data has been analyzed,and subsequently,a neural network time series forecasting model has been generated to predict the future of the number of nodes.Finally,another web scraper has been used to obtain network information of the harvested nodes,such as network types,autonomous system numbers,and locations.Our contribution to this work is summarized as follows:
1.Writing a new modified Ethereum client to crawl and discover nodes in the network.The newly created client does not crawl data or save node transactions.The purpose of the client is to save all the discovered nodes,the discovery time,and the number of occurrences for later analysis.This client has worked for three months to harvest nodes in the network.Go programming language has been utilized to create this client.Subsequently,Python has been utilized to analyze the collected data to study the dynamics of the network.We attempt to study the stability of the network by studying the number of nodes that do not change over time and the total number of online nodes per time unit.
2.Writing different Python web scrapers.The first scrapper has been used to crawl the data of the Internet Archive for the historical study of the Ethereum network.The second type of scrapper has been leveraged to crawl different Ethereum node trackers for data comparison with the data harvested by our client.Finally,a third crawler has been written to harvest node information from the Internet.These crawlers have been written using Python.We attempt to gain more insight into the software version,operating system type,countries,and type of hosting services shifting over time to study the impact of this shifting on security and other technical issues.In addition,we have generated a new dataset for the history of Ethereum from a network technical perspective.
3.A time series neural network model has been proposed to forecast the future of the number of nodes past on the historical data that have been harvested from the Internet archive.This model has been trained with a dataset constructed by the harvested data.This mode forecasts the dynamic stability of the network by forecasting the number of online nodes.Using neural networks has its merits due to the inherent connection between input and output data.One notable advantage of neural networks is their ability to approximate any nonlinear functions without requiring prior knowledge about the data series’properties.
The rest of this paper is organized as follows,the next section overviews some of the measurement works that have been conducted on Ethereum to gain more insight into how it operates.Section 3 overviews how Ethereum clients operate,its protocols,and how these protocols have been implemented in the new client.Section 4 introduces the experiment.Section 5 overviews the results of this work.Finally,we conclude this paper in Section 6.
2 Related Works
Ethereum network has dominated as the parent of smart contracts,tokens,and Dapps.Many researchers and developers attempted to show the advantages of Ethereum Dapps to secure and manage medical records[12,13],the management of used car markets[14],data storage security[15–17],authentication[18],supply chaining[19–20],agriculture[21],finance applications[22],E-voting systems[23],academicals certificate authorization[24,25]and enhancing fairness in P2P applications[26].These developed designs and architectures have shown the advantages of utilizing Web3 and P2P networks in the area of general-purpose applications and how a new paradigm of data transfer can be created without utilizing servers to handle backend data and databases [27].All of these systems and applications leveraged smart contracts and their programming languages to create new Dapps that have been tested and implemented in different Ethereum testing networks even locally or globally.However,little work has been conducted to study the underlying Ethereum P2P network,its distribution,history,and predicted futures.
In[28],the authors attempted to study the structure of the underlying P2P network of Ethereum.A new nodeFinder open-source measurement tool has been developed.This system allowed the authors to collect a massive amount of network underlying technical details of the Ethereum network,such as the number of nodes,node distribution,Ethereum clients,and port numbers.The authors found that Ethereum consists of a massive number of nodes.However,this number oscillates over time.In addition,the authors have shown the domination of Geth clients over other Ethereum clients.Moreover,the author attempted to compare the Ethereum network with other P2P networks,such as Gnutella [29] and Bitcoins,and they reported that P2P file-sharing networks have massive sizes compared to Blockchain P2P networks.The authors in this work attempted to run their measurement tools with two different Ethereum clients,Geth and Parity.They compared the packet structure and traffic flow for both of these clients.Nevertheless,the authors attempted to study one snapshot of the network without comparing their findings with any historical data on the Ethereum P2P network.
In[30],the authors proposed Ethna,an Ethereum P2P underlying measurement tool.This tool allowed the author to harvest data from Ethereum networks,such as node degree,transaction delay,broadcast propagation delay,and full block propagation hops.The authors have found that the node degree in the Ethereum network is proximity 50.This has been reported in[31]as the maximum number of nodes that can be connected to an Ethereum Parity client.In addition,the authors have shown that it takes a delay of 200 ms for a broadcast to reach all the nodes in the Ethereum network and 3 hops for a block to reach all nodes.The author leveraged their finding to prove that a small-world phenomenon occurs in the Ethereum network.However,the authors did not study the structure of the network,the geo-location of the nodes,and network clients as in[32].
In [33],the authors conducted a measurement study of both Ethereum and Bitcoin to compare the decentralization of these two networks.The authors utilized Falcon relay networks to collect their data.Their measurement system,named blockchain measurement system(BMS),is implemented over 18 nodes distributed over the world using PlantLab.They have gathered data for 1 year to measure the bandwidth,latency,and miners’resources in these two networks.The authors have reported that the bandwidth of Bitcoins nodes is much higher than Ethereum nodes.Moreover,the latency of Bitcoin“average 50 ms”is much lower than Ethereum“120 ms”and the distribution of Bitcoin nodes is better than Ethereum nodes.Finally,the authors have measured the average mining power of the nodes and found that the utilization of Ethereum is much higher than Bitcoin miners.
In[34],another measurement study has been conducted on the Ethereum network to study geodistribution and mining pools in the network.The authors created a modified version of Geth to collect the data and record them in a file.Moreover,they changed the number of nodes that the client calls to connect to “unlimited”.One month of data harvested has been analyzed in this work.The authors reported a latency of 109 ms and redundant propagated blocks in the network of an average of 9.1.These numbers are good for a network of Ethereum size.In addition,the authors found that the geo-location of the miners of the blocks impacts the latency of its distribution.
In[35],the authors utilized the Geth client to obtain Ethereum P2P underlying information from different vantage points.Three different measurement studies have been used and a comparison with Ethernodes has been used.The authors have shown that the Ethereum network consists of a massive number of nodes.However,the authors found that 68% of the discovered nodes in the 7 months of data harvesting occurred only one time.Moreover,they reported that 90%of the nodes occurred for less than 25 days.Their measurement study divides the Ethereum network into three different layers;application,P2P,and Ethereum layer.In this work,the authors emphasized transactions,blocks,and geo-locations impact on block propagation and block types.
In [36],the authors conducted a measurement study of node decentralization in different blockchain networks with a small number of nodes,such as Cosmos,Stellar,and Lightning Network.The authors attempted to study the geo-locations,countries,and autonomous system numbers(ASN)of nodes in these networks.The authors found that The onion router(TOR)has the highest contributions of nodes in these networks.Moreover,US nodes dominated all of these networks.In our work,we attempted to study the node location over time to study the historical shift in the popularity of Ethereum over time.
This work differs from all of these works in three main folds.First,the Wayback Machine has been leveraged to generate a dataset for time series analysis to predict the number of online nodes in the network.This number shows the stability of the network in the future.Second,the location,software versions,and nodes operating systems have been recorded and analyzed to show the shift in the locations,versions,and operating systems over time.Finally,the harvested number of nodes in the network has been studied to show the dynamism and noisiness of the network.
3 Ethereum Client
The Ethereum protocol[37]on its blockchain focuses on providing a platform that makes it easier to create decentralized apps.Ethereum employs a transaction sequencing scheme influenced by the GHOST and Nakamoto consensus [38].Ethereum uses a chain selection rule to use the remaining mining power in pruned blocks to improve security.Ethereum’s preferred block interval is between 10 and 20 s[39].The block size is indirectly determined by the gas execution price,which changes over time.They found that the average block size is 2.9 KB in[28].
Ethereum client consists of three layers: application layer,Ethereum layer,and P2P layer.The application layer is the layer responsible for blocks.The Ethereum layer is responsible for block exchange,broadcasting,and transactions.The exchanging process in this layer occurs between the peered nodes that have been discovered and the session established between them in the last layer the P2P layer.The first two layers of this architecture were used by our client with no changes to the original Geth protocol.In other words,they fall outside the scope of this research.The final layer,the P2P layer,is critical for node discovery and session establishment.
Ethereum protocol is poorly documented.However,the protocol technical details found in Ethereum wiki pages and clients’program codes [40] helped in understanding the P2P layer and its protocols.As shown in Fig.1,this layer consists mainly of two main protocols that work in parallel.One of these protocols utilizes a UDP socket,which is the node discovery protocol and the other protocol utilizes a TCP socket known as the DevP2P protocol.

Figure 1:Ethereum client architecture
3.1 Peer Discovery Protocol
The peer discovery protocol (discv4) is a well-known open-source protocol that is utilized to find peers in any P2P network.When a node starts running,it attempts to connect or establish TCP sessions with well-known nodes“hardcoded in the client”,called bootstrap nodes,or saved from the last running of the client using the DevP2P protocol.A list of the bootstrap nodes can be found at “https://ethereum.org/en/developers/docs/nodes-and-clients/bootnodes/”.Each node in the disc4 protocol generates an ECDSA key pair of 512 bits.The public key of this pair is used as the ENODEID,which is a unique identifier of nodes in the network.Nodes in the network save the ENODEID of discovered nodes with other information,such as IP address,port number,and software version.
The discv4 protocol sends a FINDNODE request to the nodes that DevP2P has successfully created a TCP session.Each node reacts to this message by sending a list of nodes saved in their database based on a simple mathematical operation between the requested node ENODEID and the list of saved ENODEIDs.The nodes send a list with only the nearest numbers to the requestor ENODEID.In such a case,each node saved a partial number of ENODEIDs in their databases.This creates a distributed hash table(DHT)over the network.Ethereum adopted this technique from the Kademlia protocol.However,few changes have been made to this protocol,such as logdist usage rather than XOR mathematical operation of nearest nodes.We can observe that the discv4 and DevP2P work in parallel and a lot of their technical details are mixed.For example,DexP2P has the RLPx protocol that creates sessions with nodes.This protocol is based on Kademlia DHT.It is worth mentioning that the FINDNODE message sent by nodes is called a PING message and the response to this message is called a PONG message.
As mentioned the discv4 protocol is not only utilized for Ethereum.In the measurement work conducted in [41],the authors collected more than 700 k nodes using this protocol.However,only 10 k of them were Ethereum nodes.
3.2 DevP2P Protocol
RLPx and Ethereum Wire are the two sub-layers of the DevP2P protocol.The RLPx protocol is in charge of three major functions.First,it is in charge of determining the number of nodes with which the client will attempt to establish a TCP session using the DHT table saved in the client.Second,it is in charge of creating key pairs and completing the TCP security handshaking for session creation.RLPx creates TCP sessions using the PING/PONG messages.It determines the maximum number of nodes with which to create sessions.It determines when to search for new nodes and initiates the node discovery protocol.Third,RLPx maintains a list of all connected nodes by sending Hello messages and other types of PING messages.If a node does not respond to a PING message for a significant amount of time,the connection is terminated and a DISCONNECT message with the error code is sent.Following the execution of the RPLx protocol,the Ethereum wire protocol is launched.This protocol is in charge of exchanging transactions and blocks.
3.3 Our Modified Client
To modify the Ethereum client,Geth version 1.7.3 has been used.The first modification of the code is the maximum number of connected nodes that RLPx allows.We have changed it to 500.Second,RLPx sends connections to the most near 3 nodes,we have changed this to 10.Third,after the RLPx PING/PONG messages and TCP handshaking establish a connection with the new nodes,we let the code wait for 5 s.Subsequently,a DISCONNECT message is sent with the error code of the maximum number of nodes connected.Subsequently,the client loops over the nodes again to find and connect with new nodes.Before DISCONNECT with the nodes,nodes’information is tracked and recorded into files on the hard disk for analysis.In addition,we have modified the FINDNODE process to request more than one time from the same node to fetch as many as possible nodes.
4 Experiments
The conducted experiment is composed of four primary components.The initial segment provides an overview of the modified Ethereum client and its application in gathering network information.The subsequent section delves into the description of the historical data web crawlers.The third part offers an overview of the web data harvesting process,which is conducted for comparison with the data we have collected.Lastly,the fourth section presents the time series forecasting model.
4.1 The Modified Geth Client
The Geth client has been modified to create a new version to record and harvest ENODEID,IP addresses,and software versions.The modified version of the client attempts to connect with the node for 5 s.Subsequently,it sends a disconnect message to all connected nodes“after establishing the TCP session of data exchanging”.Subsequently,a new connection with new nodes takes place.This process continues and all the data is written to the hard disk.The modified client version does not record any transactions or blocks since they are out of the scope of this study.In addition,another modification has been added to increase the number of connected nodes to 100.The modified version records the data as a dataset in different files.A new file is created every day for new data to allow the analysis of old data before the end of the harvesting process.When a new file is created,the IP addresses of the old file are cleaned by a duplication removal process.Subsequently,the Nmap network discovery tool is used to record the operating system type of the node that runs the Ethereum client.
The modified version has been used to harvest the data in three different measurement scenarios.In the first one,our client ran for three months from 20/02/2023 to 20/05/2023.The harvested data from this experiment has been used to show node resilience in the network.This dataset has been converted into weeks’time frame to study the changes according to weeks“12 weeks”.Moreover,the final results are the average of these weeks.The second experiment was conducted for only 10 days with 4 h of data harvesting during the day and another 4 h at night.The average of these 10 days has been shown.The third scenario is a snapshot of 12 h of data conducted on 15/05/2023.The last measurement study has been analyzed and compared with different reported node statistics on that day.Moreover,the data of the last measurement has been utilized in the historical study of the network.
4.2 Wayback Machine Data Harvesting
In the first part,different web scrapers have been written in Python to extract data from historical web pages that have been archived using the Wayback Machine project“www.archive.org/web/”,this project attempts to crawl and archive websites and pages.The data that can be extracted from this website can be used in time series predictions[42].We have written two different Python scrapers for etherscan.io/nodetracker and ethernodes.org.For the first scraper,only 261 snapshots starting from 2018 to 2023 have been found in the archive with 220 only useful pages.The total number of nodes with the popular Ethereum clients and operating systems has been extracted from these pages.For the second scraper,two different versions have been written,since the structure of their website and pages have been modified after 2018.The data gathered from this scraper has full snapshots for each month from 2016 until 2023 with missing values of 5 months.More than 400 snapshots have been found in the archive for this site.The data harvested from this site consists of the total number of nodes,countries,operating systems,client versions,and types of networks.However,the total number of nodes has been utilized in this work to generate a time series future prediction using neural networks.
4.3 Web Data Harvesting
Another crawler has been written for the etherscan.io/nodetracker to collect the IP addresses and ENODEID to compare them with our findings.In addition,another crawler has been written to collect the same information from Ethernodes.However,the structure of their site utilizes Javascript AJAX technology,and the data is hidden in the codes.To write this scraper we utilized AutohotKey scripting“www.autohotkey.com/docs/v1/scripts/”to request the page and copy the data to a file.This data has been compared only to our collected ENODEIDs and IP addresses.The final scraper has been written to obtain the information of the harvested IP addresses from“www.ipinfo.io”,such as company name,country,network type“hosting,users,businesses,etc.”and AS number.
4.4 Time Forecasting Neural Network Model
The historical data harvested from Ethernode from 2016 to 2023 as one snapshot per month has been used to generate a new dataset that consists of 89-time points,one for each month,has been generated.This dataset is used to train a machine learning model to predict the total number of nodes per month in the future.To select a model to train,the neural network has been selected.Neural networks possess the benefit of being able to approximate nonlinear functions without requiring any prior knowledge about the characteristics of the data series.In neural networks,neurons are used as computational elements.Each neuron has input data normalized and one output.The neuron utilizes a weight function“we have selected the Sigmoid function”that computes the output value based on the input data.Eqs.(1)and(2)show the functions that generate the output value of each neuron.
wherewiis the weight value that the neuron has to optimize by training to obtain accurate output of the system,Xiis the input of the neuron andnis the number of inputs to the neuron.
The model is called a neural network since it consists of different numbers of neurons placed in layers.The input of the neurons in the first layer is the data“features”normalized from the dataset.Each node in the same layer has the same input.The output of the neuron in the first layer,called the input layer,becomes an input to all neurons in the second layer,called the hidden layer.Finally,the outputs of this layer are used as input to the next layer.The final layer consists of neurons with the same number of the required output of the model.For example,in our model,one output is required.This means one node is levered in the final layer.
To find the values of the weights in each neuron in each layer,gradient descent is utilized.This algorithm uses several number of times“iterations”to search for the optimal value of these weights.The process of running gradient descent,replacing the old weights with new weights,and testing the model again is called backpropagation.This means that the model selected in this work is called the feed forward-back propagation neural network model.This model has been selected since it is easy to implement and has higher accuracy than other regression models.Since the model works with time data to predict the values depending on time,we called it a time series forecaster.
Our created dataset has been fed to the generated model.4 months of data points are missing in the years 2017 and 2018.We have utilized a linear regression model that we have trained on the data to fill in the missing values.Autocorrelation has been used to find the number of time intervals that impact the forecasting of the next time point.This number has been used to create a sliding window on the 89 points to create a matrix of M×N where M is the number of data points and N is the data points that impact the forecasted point.As shown in Fig.2,any number between 6 and 10 time points can be used to predict the new time point.In this work,6 have been used since the data points collected are small.This means a matrix of 89 × 6 has been used as the input features to the neural network model and one output column is used as the output value of the regression model.

Figure 2:Autocorrelation plot of the historical dataset
5 Results
The result section consists of three parts.The first part overviews the harvested data analysis of the modified client.The second part shows the data analysis of the historical harvested data.Finally,the last section describes the time series and the future prediction of the number of nodes.
5.1 The Node Discovery over Three Months
As mentioned,three months of data harvesting has been analyzed.The data has been divided into 12 datasets.Each dataset shows the collected data for one week.The number of unique ENODEIDs that have been collected in this period is 270 k ENODEIDs.However,after dividing the data into weeks,an average of 22,045 ENODEIDs have been harvested every week.Fig.3 shows how many times an ENODEID has occurred in the week.We can observe that only 4040 nodes,which are 18.3%of the discovered nodes,have been found in the data every day on average.The maximum number of nodes that occurred in any week is 26%.Moreover,we can observe that one node occurrence per week has dominated with approximately 22%.We attempted to count the occurrence of the nodes in the 89-day.The number of nodes that have been detected more than half of this period is 53%only.This shows the dynamism and noisiness in the Ethereum network.
It is worth mentioning the total number of unique IP addresses collected from the data is less than the ENODEIDs.110 k IPs have been collected with an average of 15,500 IPs per week of data.The snapshot dataset will show why the number of IPs is less than the number of ENODEIDs.
5.2 Node Discovery Snapshot
In the snapshot data harvesting,an accumulated node of the network over 12 h has been harvested.The data collection process took place in15/5/2013 from 6 PM to 6 AM.At the same time,the total number of reported nodes scanned from ethernodes.org,which is popular in Ethereum statistics and has been used in many works [43–45],and etherscan.io,which has been used for data sources in different works [46–48],has been crawled using two different Python crawler.Over the time every 10 min and the number has been averaged for these 12 h.The structure of these crawlers has been shown in the experiment section.
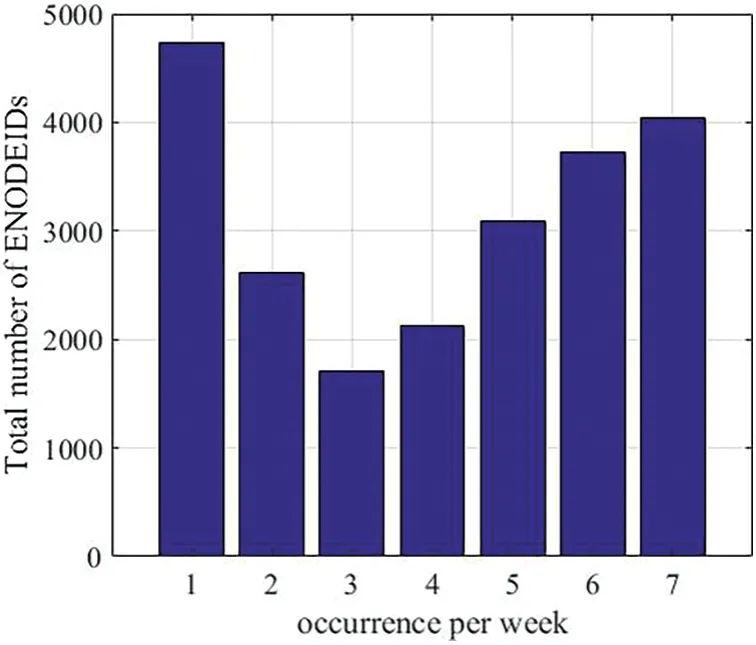
Figure 3:How many times an ENODEID has occurred per week of the data.More occurrences of the same account show the stability of the network over time
Table 1 shows the total number of nodes“ENODEIDs”discovered from our machine and these systems.We can observe that we have collected approximately 200%more nodes than ethernodes.org reported nodes and 148% more than etherscan.io.Etherscan.io tracker is one of the most accurate trackers on the Internet.It has discovered more than 7 million nodes from its start until now.However,we believe that the report numbers of the average-only nodes are not accumulative over the same amount of time we have utilized.To validate our discovered IDs,we have crawled the data from the etherscan.io/nodetracker/nodes page which shows only the last 10,000 records discovered.We found 99.9%of these IDs in our discovered IDs.One of the issues with the small reported number of nodes in ethernodes.org is the port numbers that reported the discovered nodes.They only report the nodes with the default Ethereum port number(30303)for all the nodes shown on their website.This has been noticed in the data collected from our scraper of their website.
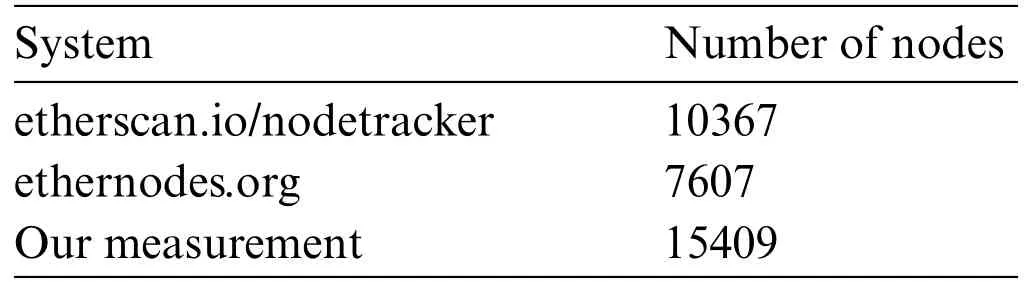
Table 1: Comparison of the discovered nodes
In the time window of 12 h,we have collected 341,450 discord nodes with a unique 15409 nodes in the dataset.However,we discovered several physical devices with the same IP addresses that run more than one logical node“ENODEID”.Fig.4 shows the cumulative discovery nodes and IPs over the period.We can observe that the number of new nodes discovered over time decreases.We have discovered 10 k nodes in only 3 h and 5 k in 9 h.In addition,we can observe that 10,920 unique IP addresses have been discovered for the 15,409 nodes.

Figure 4:Cumulative discovery nodes vs.IPs over the period.Each point has been taken every 5 s
Fig.5 a shows a log scale histogram of the number of nodes run over the same IP addresses.We can observe that many IP addresses run multiple nodes in the Etherum network.This follows different reasons.First,the hosting services over the cloud that most Ethereum network providers follow.Second,many people may run different copies of the node over their devices with different port numbers.We can observe from the figure that some IP addresses run approximately 1,300 nodes.However,most of the nodes run from 1 to 4 instances.For example,the IP address 173.244.194.94 has been used 557 times.This IP address belongs to ingenuitycloudservices.com cloud services located in the US“AS13213”.

Figure 5:(a)Log scale histogram of the number of nodes running over the same IP addresses(b)Port number histogram
Fig.5 b shows the top ten port numbers of all nodes that have been collected.781 different ports have been harvested.However,port number 30303“the default port”has dominated with proximity 37%.The second port number,which is 30311,has occurred 8.9%.This shows that scanning for only this port number is not enough to harvest a massive number of nodes.
5.3 Discussion of Node Discovery Results
As shown in the first two subsections of the results,the different number of nodes has been collected from the Ethereum network and the harvested data has been compared with two popular platforms.We have observed the online nodes in the network.The numbers harvested show that the Ethereum network is solid since it consists of a massive number of nodes.This massive number has been harvested daily over months.However,the network is noisy since less than 20%of the same nodes have been recorded over two days.However,this noisiness in the network does not impact Ethereum since the number of nodes contribute per day exceeds 10 k nodes.In addition,we observed that hosting services and clouding dominated in Ethereum node hosting,which means that the business model followed by the nodes’providers attempts to host the nodes outside the business’s physical locations.This makes it hard to track the real providers of these nodes.
5.4 Historical Data Analysis
As mentioned,two different scarpers have been written to collect the data from the Wayback machine project.Fig.6 shows the historical data of Ethereum client usage.We can observe that Geth has been the most popular Ethereum client from 2016 until today.However,we can observe that Parity was also popular;however,its popularity decreased with the time after 2018.Moreover,new clients started to be used such as OpenEther,Erigon,and Nethermind in the past few years.Fig.7a shows the operating system popularity of the nodes in the Ethereum network.We can observe that the Windows operating system was the dominant operating system for Ethereum clients until 2019.After That,Linux dominated until the present.One of the reasons behind this shift is the drivers of GPUs and the easy access of the CUDA library to the GPUs in Linux.In addition,this shift to the Linux operating system enhances the security of the nodes,which enhances the security of the network.

Figure 6:Client popularity over time

Figure 7:(a)Operating system popularity,(b)networks that host the ethereum clients
One of the most popular pieces of information that is shown in most Ethereum network crawlers is the top countries that host these nodes.However,the historical data harvested from 2016 until the present shows that the USA hosts the highest number of nodes with a percentage of more than 30%all over time.China had a massive number of nodes until 2019.Subsequently,the number of nodes discovered in China has been reduced from 1.9 k nodes in 2018 to only 137 nodes in 2023.Nevertheless,the top ten countries from 2016 until now have not changed that much.The only changes occurred with the ranks between them.The first node observed in the MENA region was in 2019.Egypt has two nodes,Palestine has one,Tunisia has one,Lebanon has one,and Saudi Arabia has one.This number has increased to 55 nodes in 2020,with 24 nodes hosted in the UAE.However,40 MENA nodes were discovered using data collected over three months,with the UAE dominating with 20 nodes.We crawled the networks that hosted these nodes and discovered that 100%of them are hosted using cloud services.This demonstrates that full Ethereum node hosting as a business model is not widely used in the MENA region.This shows that full Ethereum node hosting as a business model is not popular in the MENA region.Using Ethereum as electronic coins does not require the hosting of a fully synchronized node.Table 2 shows the percentage of MENA Enodes of the total number of online nodes that have been harvested from the historical data.In addition,the table shows the country with the highest number of recorded nodes in that year.We can observe that the percentage is less than 1%from 2016 until now.In addition,we can observe that UAE Enodes dominated MENA.
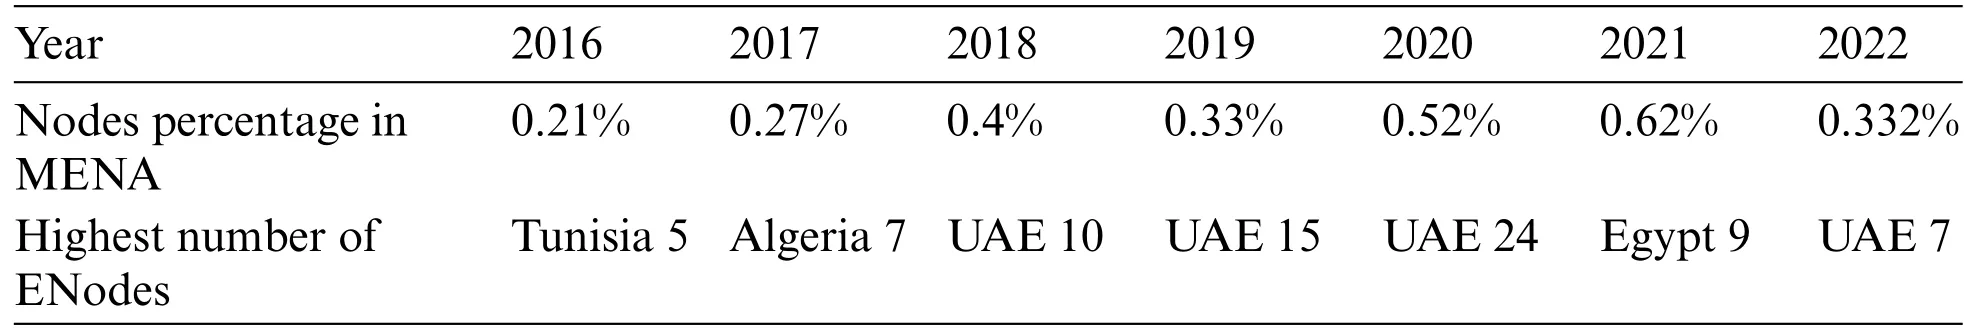
Table 2: Statistical data of MENA enodes
Finally,Fig.7b shows the type of networks that host the Ethereum node.We can observe from the figure that hosting the client in the cloud dominated other types of hosting.Subsequently,home users attempt to host nodes in their homes as a second method of hosting.This means that from the beginning of the Ethereum network,two business models have been introduced;resident and hosting.The resident users,attempt to run miners to obtain Ethers.Running a resident Enodes allows the users to run different nodes from different blockchain platforms without the addition of more hardware costs.However,using hosting for the Enodes shifts all the technical issues from the user side to the host,which reduces the efforts to run the node.
5.5 The Neural Network Forecasting Model Results
Supervised machine learning models can be used for regression and categorizing the data points in a dataset.The dataset is a massive matrix that consists of rows and columns.Each column in the dataset has a feature of the data snapshot recorded in that row.In addition,the last columns of the datasets show the real output of this snapshot.Each row in the dataset is a unique record or tuple.Time series analysis is a regression issue that can be modeled utilizing machine learning.However,the features in the time series dataset are only one column and the output of this dataset is the same as the features.To create a dataset of a single column,the column is converted into some columns with the last column treated as an output of the dataset.89-month data points have been harvested from the historical data utilizing our scrappers.These points have been converted into a matrix of 89 × 6 using a sliding window.The window moves forward one point for each new data row.The matrix has been divided into an input matrix of size 89×5 and the last column 89×1 has been used as an output regression value.The data has been normalized by dividing all the points by the maximum recorded value.Finally,a back propagation neural network has been constructed using Keras Python.The designed network consists of one input layer of six nodes which equal the size of the column of the input data.One hidden layer has been leveraged with 10 nodes fully connected to the input layer.Finally,one output node has been used to show the predicted output value.The data has been divided into 70%training data points and 30%testing data.Mean square error(MSR)has been used to measure the accuracy of the model.The model has been trained and the accuracy of its predicted values has been compared with real values using MSR.An accuracy of 92% has been recorded for the model.Fig.8 shows the comparison of the real historical data from 01/2016 until 04/2023.We can observe from the figure that the model can mimic the real data points.Moreover,we can observe that the number of nodes in the Ethereum network has increased massively in 2017 to reach more than 31 k nodes.However,the number started to decrease after that until it reached 4 k.Finally,the node numbers start to be stable around 10 k values.

Figure 8:Trained model forecasted results
6 Conclusion
This study investigated the Ethereum network’s underlying P2P structure to gain deeper insights.A novel Ethereum client designed to gather node information for analysis was employed to collect data,spanning three months.Subsequently,the collected data was subjected to analysis.To explore the historical data of Ethereum,various web scrapers were developed to retrieve information from the Wayback Machine project in the Internet Archive.These historical data sets revealed shifts in the operating systems of utilized nodes,client types,and the top ten countries operating Ethereum clients.The harvested data constructed a neural network model for monthly time forecasting,enabling the prediction of node counts in the Ethereum network.Furthermore,the created additional web crawlers gathered data from different Ethereum node tracking projects,serving as a basis for comparative analysis.Our findings indicated that the Ethereum network exhibits a degree of volatility.Nodes join and depart daily,with fewer than 20% remaining stable.This network dynamism,while potentially impacting stability,is also a testament to its sheer scale and resilience.
Additionally,the data revealed that the top ten countries operating nodes have remained largely unchanged since Ethereum’s inception.However,the true geographical location of node providers can be influenced by the use of various hosting and cloud services.The results suggest that hosting services have become dominant in running Ethereum nodes.Moreover,Ethereum is not extensively adopted as a business model in the MENA (Middle East and North Africa) region,as the number of Ethereum nodes operated by MENA countries is notably lower compared to the total node count contributing to the Ethereum network.A significant shift in operating systems was also identified,with Windows OS previously dominating and Linux OS now taking precedence among operating nodes.This transition has improved node and network security,implying that individuals interested in engaging with Ethereum in a business capacity should consider learning Linux.Additionally,it suggests that new blockchain client developers may need to create clients compatible with Linux to remain competitive.This shift towards Linux underscores the attractiveness of hosting and cloud services to business providers,potentially leading to a transformation from a distributed P2P model to a more centralized model that relies on cloud services.Finally,the data collected created a dataset,which built a neural network model for time series forecasts.The model was trained,validated,and tested with a 92%accuracy.
Our results in this work pose five main questions about the stability of decentralized blockchain networks.First,What happens if unstable nodes frequently join and leave the network,and the network depends on many nodes for stability,especially if countries and service providers start blocking their nodes,given that most nodes operate with default ports?Does the network require booster nodes or“nodes that allow a run,such as the hard-coded nodes in the Ethereum clients?”How can nodes from other countries,such as the MENA contribute more to the network?
Second,if the top countries that contribute to the network have not changed from the beginning of this technology,how could blockchain technology prevent these countries from monopoly this network? How the network can enhance fairness by encouraging new nodes from new countries to contribute? How to prevent the top countries from converting this technology into a centralized version?
Third,Ethereum clients have been written to operate on different operating systems.We have observed that Linux has dominated with its security features.However,as smart devices,such as smartphones,tablets,smart TVs,and smartwatches are everywhere,is there any method to reduce the size and complexity of the blockchain clients to operate over these devices?
Fourth,the experiment has collected the nodes by a modified version of the Geth client.We have compared our number with other numbers collected by other services.The question is about the real number of nodes out there.All the numbers collected predict the real number of nodes worldwide.
Finally,as any client of this network can be modified to collect different information,it is a massive security issue since service providers and countries can track and block the clients in these networks easily by operating a modified version inside any internet service provider and tracking the IP/port numbers of the customers of these networks.We believe that running a client over the cloud“hosted”is much more secure than resident clients.
Acknowledgement:The authors would like to thank the Arab Open University and Al-Zaytoonah University for providing the necessary scientific research supplies to implement the research.
Funding Statement:The authors extend their appreciation to the Arab Open University for Funding this work through AOU Research Fund No.(AOURG-2023-006).
Author Contributions:Conceptualization,Mohammd Masoud and Yousef Jaradat;methodology,Mohammad Masoud and Mohammad Alia;code writing and data analysis,Mohammad Masoud;validation,Ahmad Manaserah;writing—original draft preparation,Mohammad Masoud;writing—review and editing,Sally Almanasra and Khaled Suwais;project administration,Khaled Suwais and Mohammad Masoud;funding acquisition,Sally Almanasra and Khaled Suwais.
Availability of Data and Materials:Data is available upon request.
Conflicts of Interest:The authors declare that they have no conflicts of interest to report regarding the present study.
杂志排行

Computers Materials&Continua的其它文章
- Fuzzing:Progress,Challenges,and Perspectives
- A Review of Lightweight Security and Privacy for Resource-Constrained IoT Devices
- Software Defect Prediction Method Based on Stable Learning
- Multi-Stream Temporally Enhanced Network for Video Salient Object Detection
- Facial Image-Based Autism Detection:A Comparative Study of Deep Neural Network Classifiers
- Deep Learning Approach for Hand Gesture Recognition:Applications in Deaf Communication and Healthcare