ProNet Adaptive Retinal Vessel Segmentation Algorithm Based on Improved UperNet Network
2024-03-12SijiaZhuPinxiuWangandKeShen
Sijia Zhu ,Pinxiu Wang and Ke Shen
1CW Chu College,Jiangsu Normal University,Xuzhou,221000,China
2Biomedical Engineering College,Southern Medical University,Guangzhou,510080,China
ABSTRACT This paper proposes a new network structure,namely the ProNet network.Retinal medical image segmentation can help clinical diagnosis of related eye diseases and is essential for subsequent rational treatment.The baseline model of the ProNet network is UperNet(Unified perceptual parsing Network),and the backbone network is ConvNext(Convolutional Network).A network structure based on depth-separable convolution and 1 × 1 convolution is used,which has good performance and robustness.We further optimise ProNet mainly in two aspects.One is data enhancement using increased noise and slight angle rotation,which can significantly increase the diversity of data and help the model better learn the patterns and features of the data and improve the model’s performance.Meanwhile,it can effectively expand the training data set,reduce the influence of noise and abnormal data in the data set on the model,and improve the accuracy and reliability of the model.Another is the loss function aspect,and we finally use the focal loss function.The focal loss function is well suited for complex tasks such as object detection.The function will penalise the loss carried by samples that the model misclassifies,thus enabling better training of the model to avoid these errors while solving the category imbalance problem as a way to improve image segmentation density and segmentation accuracy.From the experimental results,the evaluation metrics mIoU(mean Intersection over Union)enhanced by 4.47%,and mDice enhanced by 2.92%compared to the baseline network.Better generalization effects and more accurate image segmentation are achieved.
KEYWORDS Retinal segmentation;multifaceted optimization;cross-fusion;data enhancement;focal loss
1 Introduction
Today,many achievements in artificial intelligence have led to technological innovations in many areas,such as decision making[1],medical diagnosis[2],clustering[3],image segmentation[4].Many academic researchers have started to investigate deep learning-based medical image segmentation techniques in recent years.Medical images are of immense help to medical research,clinical diagnosis,and pathological analysis,driving theoretical and technological advances in human medicine.The fundus retinal vessels are microvasculature located more profoundly in the body.Its most excellent research value lies in the fact that it can be observed non-invasively,and its structural changes,such as proper vascular diameter and degree of curvature,are closely related to the severity of diabetes,hypertension,and some blood diseases.There is excellent research value and development prospect to study the fundus retinal vessel cutting network.The fundus has five common retinal disorders:(1)vascular and vascular systemic lesions;(2) retinal inflammation;(3) retinal detachment;(4) retinal degeneration and dystrophy;and (5) retinal tumours.The causes of vascular and vascular system pathologies include atherosclerosis,blood disorders,diabetes,etc.,and the effects of this type of pathology on vision can be very significant and may even lead to blindness.Studying fundus retinal images has significantly contributed to advancing theory and technology in medical research,clinical diagnosis,pathological analysis,etc.Its specific role is divided into the following aspects.Firstly,it is used for the auxiliary diagnosis of diseases,which provides more comprehensive image data for doctors’condition analysis.It can help doctors to make a more accurate assessment of the patient’s condition.Therefore,it develops a more scientific and practical individual and exclusive treatment plan.Secondly,it is used for disease screening,preventing patients’severely impaired vision and the uncontrolled development of severe diseases like hypertension and blood diseases.Thirdly,a dynamic change map of the fundus retinal vessels is established by collecting fundus retinal vascular images from patients at different times.This can track and control the development of patients’diseases.Fourthly,establishing a database of fundus retinal images to enter various specific cases and increase the number of medical research cases for easy retrieval and research by researchers.Therefore,the fundus retinal vascular image segmentation algorithm is improved to enhance its efficiency and accuracy,which is quite essential to the improvement of existing ophthalmic diagnosis and even the prevention and control of many serious diseases.
Many difficulties in the practical application of retinal vascular image-cutting algorithms in the fundus still have not been fully overcome.In human physiology,the fundus retina is located in the innermost eye layer.It has a spherical shape,resulting in a clinical situation where we often only obtain partial images,and the illumination is not uniform.In segmentation algorithms,traditional medical image-cutting methods,such as image segmentation based on thresholding,clustering,edge detection,deformable models,etc.,have significant shortages regarding the accuracy of results and universality of images for each category.The primary operating mechanism of the threshold-based image segmentation algorithm,is as follows.Firstly,select an image feature as a comparison criterion,such as grey scale value,gradient value,etc.Secondly,a suitable threshold and error range is selected through relevant operations.Thirdly,it is determined whether the eigenvalues of the individual pixel points of the region to be segmented in the image are within the error range of the threshold.If they are within the error range,the target pixel point is.If it is within the error range,it is the target pixel.Otherwise,it is the background pixel.From its operation mechanism,it is known that the image segmentation algorithm based on the threshold is relatively simple to run the procedure,and it works well for images with significant differences in grey-scale values and other feature values.However,it is unsuitable for multi-channel pictures and images with minor differences in feature values.It can only take into account the flat information of the image without the ability to evaluate its three-dimensional image of reality.The clustering-based image segmentation algorithm is the most straightforward and practica.Commonly used clustering algorithms include the K-means algorithm and the fuzzy C-mean algorithm,the basic algorithms for many medical image segmentation methods.Clustering-based image segmentation algorithms are sensitive to initialization parameters,noise,and greyscale but lack a spatial model,which makes it fast to run but not very accurate.Staal et al.[5] have successfully studied K-means algorithm-based image segmentation methods because they use objects with large volumes,such as roads,as segmentation targets,which do not require a segmentation algorithm with high accuracy.However,the algorithm is unable to perform this aspect of the segmentation task when the segmentation target of the fundus retinal vessel image is tiny,and the segmentation target has low contrast with the background.The algorithm’s edge detection-based image segmentation algorithm depends on the principle of detecting edges that contain different regions.The algorithm locates edges accurately and runs fast.However,as the algorithm can only produce edge points during edge detection,it cannot guarantee the continuity and closure of borders in image segmentation.It is not effective when dealing with highly detailed regions with a large number of fragmented advantages.The segmentation algorithm based on the deformable model is more flexible than other traditional algorithms and can be used for complex segmentation tasks.The algorithm is efficient and easy to apply in real-time.It is based on the target edges and uses the closed curves in the image and their shapes to outline the advantages of the segmentation target.McInerney et al.[6] surveyed deformable models in medical image analysis and reviewed scenarios where deformable models have been developed and applied in image analysis tasks.They find its versatility in processing medical images by segmentation,matching,and dynamic tracking.
In recent years,many academic researchers have become interested in deep learning-based image segmentation networks.Through their research,they have made significant innovations and developments in the technical aspects of image segmentation.The Mask R-CNN(Region-based Convolutional Neural Networks)[7]proposed by He et al.is a classical instance segmentation algorithm.It occupies an important position in instance image segmentation tasks due to its high segmentation accuracy.Meanwhile,it has a basic network structure that can perform various tasks,such as target classification,target detection,instance segmentation,and semantic segmentation,by adding different branches,which is quite generalizable.Mask R-CNN improves the network structure of the classical target detection algorithm Faster R-CNN.The innovations of this network are as follows: (1) It innovatively improves on the original network structure of the Faster R-CNN by replacing the RoI Pooling layer with the RoI Align layer;(2) it adds a parallel FCN (Fully Convolutional Networks)layer,i.e.,a branch is added to predict the target segmentation Mask,which can help predict the class of segmented objects and segmentation Mask information.Badrinarayanan et al.proposed SegNet[8],an FCN network for pixel-level image segmentation,with the following innovations:(1)the FCN network is used as the basis,and the VGG-16 network is modified to perform semantic segmentation,and since the FCN network is the best for retaining all feature maps of the encoder,it is functionally(2)its base network FCN network is to classify images at pixel level,unlike the traditional CNN network which outputs probability values.Without limiting the input image’s labelled image,it is obtained by making the deconvolution layer act on the last convolution layer to capture the feature values therein,which is consistent with the image’s image size.(3) the innovative up-sampling method can be incorporated into any encoder-decoder structure with minor modification,which has a wide range of applications,and the information lost in the pooling process of SegNet can be obtained again in the decoding stage through the maximum index,reducing the errors in the results caused by data loss during the operation.In terms of results,the SegNet semantic segmentation delineates edge contours,saving the number of parameters and leading to segmentation because only the maximum pooled index is stored;accuracy is not high and cannot meet the real-time needs.Olaf et al.[9]proposed the U-Net network in 2015,a deep learning-based image semantic segmentation algorithm.The U-Net is based on an improved FCN,and they are both encoder-decoder structures,which combine the function of encoder feature extraction with the operation of the decoder to recover the original resolution,making both U-Net and FCN a structurally simple but effective network structure.U-Net is divided into three main parts:feature extraction(left),stitching(centre),and upsampling(right).Unlike FCN,U-Net shows the following advantages:(1)the left and right are very similar and almost symmetrical,whereas the decoder of FCN is relatively simple and does not further process the image as U-Net does;(2) U-Net adopts the processing method of down sampling and up sampling,down sampling expands the field of perception step by step as it proceeds so that the unit area that can be perceived In the up-sampling recovery process,U-Net also performs a skip connection,which helps to integrate the information from the various stages of down downsampling up-sampling process and retain the information at each level better,making the segmentation result present complete image information.However,U-Net also has some shortcomings,mainly because it has a shallower number of layers and fewer corresponding parameters than the existing segmentation network structure,which is prone to a certain degree of overfitting when the size of the dataset is small that affects the generalisation ability of the model.Moreover,it performs poorly in object edge segmentation.After this,Milletari et al.[10]improved the U-Net network and designed an algorithm specifically for three-dimensional medical image segmentation V-Net.The algorithm uses three-dimensional convolution and Dice coefficients based on segmentation measures as the objective function,making the U-Net-based V-Net more applicable to medical image segmentation,with improved performance in all aspects.The fundus retinal vascular images studied in this paper have a small amount of data and require high accuracy of the segmentation network.As a result,the existing network cannot produce good segmentation results due to their structural characteristics.
In medical image segmentation,the lack of data in medical images is also a significant challenge,and researchers often use data augmentation to mitigate the impact of this deficiency.The loss function affects the accuracy of the results to a large extent due to its different characteristics and applicability to different scenarios.V-Net,proposed by Milletari et al.,uses the data enhancement process as follows.Firstly,use the network control points and B-splines to obtain a dense deformation field for the non-linear deformation of the image,which allows more complex features to be extracted from the picture,generating precise and expressive new data,reducing errors in the results of the new data runs and improving the accuracy of the algorithm results.Secondly,use histogram matching to obtain images with different grey-scale distributions,improving the processing range and generalisability of the segmentation algorithm.Regarding the loss function,V-Net uses the Dice loss function to reduce the variability in resolution between the segmentation target and the background in the segmentation sample.SegNet,proposed by Badrinarayanan et al.,uses the cross-entropy loss function for different types of objects in the loss function calculation process so that the larger U-Net proposed by Olaf et al.al.uses translation,rotation,and random elastic deformation to expand the training data of the algorithm.U-Net also uses a weighted loss function to weigh each value in the output probability distribution vector,increasing the loss weight of the cell contours and improving the accuracy of image boundary separation.However,the generalization performance is still lacking.
To enhance the generalization ability and segmentation accuracy of the model,this paper proposes a network ProNet for fundus retinal vascular image segmentation.The network adopts ConvNext(Convolutional Network) as the base network structure with better performance.Its depth is tested through experiments,and good segmentation results are achieved on different retinal datasets,improving the operational efficiency and overall effect of the image segmentation network.Secondly,this paper performs a random 12° to 15° rotation operation on the images,a mirror flip operation,and a noise-enhanced data enhancement optimization process to form three new datasets to expand the training dataset,alleviate the problem of insufficient training data for medical images,improve the overall network architecture,and enhance the generalization performance of this improved network.Although enhancing noise adds a more difficult task in training the network,it also dramatically improves the capability.In addition,this paper uses a Focal loss function to add weights to the sample loss according to the difficulty of sample discrimination.It can shorten the unnecessary time in the training process and obtain segmentation results with higher accuracy.In conclusion,this paper innovatively combines the focal loss function with unique data enhancement processing methods,such as adding noise to improve the ConvNext network.It obtains a new network with significantly improved operation speed,computational accuracy,and robustness.
This paper uses the ConvNext network as the baseline and the CHASE_DB1 open source and DRIVE datasets to train this network and test the improved performance.Authors must adhere to this Microsoft Word template in preparing their manuscripts for submission.It will speed up the review and typesetting process.
2 ProNet Network Structure
We explored the design of a novel network architecture,the ProNet network,using the UperNet(Unified perceptual parsing Network) [11] model as the benchmark network.UperNet is a deeplearning semantic segmentation network structure primarily used to segment images into semantically similar regions.UperNet employs techniques from ResNet[12]and upsampling and is implemented by jump-joining and injecting contextual information to operate.The Network Configuration of UperNet is shown in Fig.1,which consists of four main parts: the backbone,the detection head,and the upsampling module.
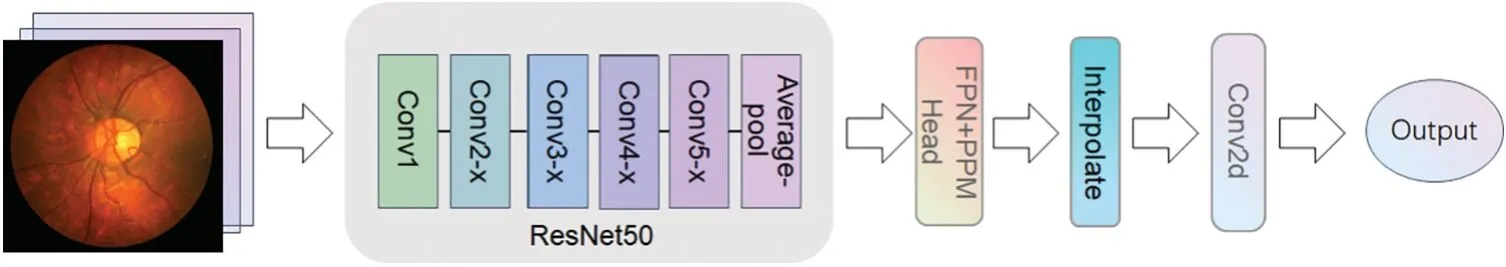
Figure 1:UperNet network architecture
The backbone network of the UperNet uses ResNet50 as the backbone.ResNet50 is widely used in various spheres,such as image recognition,object detection,face recognition,natural language processing,etc.The design idea of ResNet50 is to dispose of the gradient disappearance problem of deep convolutional neural networks by residual learning and to solve the network degradation problem to achieve a more profound network architecture.The deeper ResNet50 network and residual learning perform better than the earlier classical convolutional neural networks in many areas.For example,on the ImageNet image recognition dataset[13],ResNet50 achieved the best results.However,owing to the large depth of the ResNet50 network,it requires a large quantity of training data and computational resources during training,and the training time is relatively long and prone to overfitting during training.The residual learning method is used so that each layer of the network needs to save a residual,so the amount of parameters of the model is also more considerable.
The detection head of UperNet is mainly made up of two parts:PPM(Pyramid Pooling Module)[14] and FPN (Feature Pyramid Network) [15].The PPM module uses multiple pooling levels at different scales for feature extraction,which enables better capture of various scale features in the image.This approach is more adaptable to objects of divariousizes than single-scale pooling,and the robustness of the model significantly improved to visual changes.At the same time,the PPM module does not depend on a specific convolutional neural network structure and can be easily embedded into any network with high flexibility.Traditional pooling operations shrink the size of crucial element maps and result in information loss,but multiple pooling levels in the PPM module can retain more information.FPN,on the other hand,is an improved method for deep learning networks that reduces feature loss problems and improves the performance of target detection and semantic meaning segmentation tasks.Based on bottom-up and top-down feature pyramid structures,FPN can simultaneously process feature information at multiple scales.This structure allows better image information processing at different scales and makes the network more robust.Based on this,we try to use the ConvNext[16]model to replace the backbone in UperNet,the ResNet50 model,by retaining the detection head,upsampling,and subsequent convolutional processing cross-fusing it into a new network system ProNet network.ConvNext has been a generic visual backbone in recent years,and its power dramatically depends on the inherent advantages of the Transformer[17]and achieves excellent performance on several vision tasks.The model structure of ConvNext-T is shown in Fig.2.The model structure of ConvNext-T uses the sequential layer of ConvNext architecture,which can better use the inherent advantages of transformers and improve the performance and efficiency of the network.Compared with ResNet50,ConvNext-T has a larger convolution kernel design.ResNet mainly increases the depth of the network through shortcut connections.In contrast,ConvNext can increase the effective perception field,improve the feature extraction ability and capture the context information of the image better by using a large convolution kernel.The network starts as a 4 ∗4 sized convolutional kernel,and using LayerNorm[18]after feature extraction accelerates the convergence of the network and reduces overfitting.
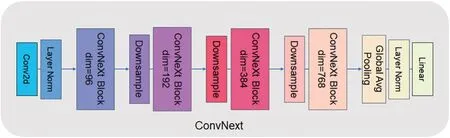
Figure 2:ConvNext-T network structure
The main structure of ConvNext is ConvNext Block and Downsample.Fig.3 shows the structure of the ConvNext Block.The ConvNext Blook has four layers,but the dim of each layer is different,96,192,384,384 in order.The ConvNext Block uses multi-channel convolution and channel relationship explicit modelling methods,which can capture the dependencies between different features and thus improve the network representation.ConvNext Block splits the multi-channel convolution into several independent convolution operations,which can efficaciously cut down the number of parameters of convolution kernels and adopt group convolution for feature extraction,which can effectively avoid the overfitting problem while ensuring the feature expression capability.Meanwhile,the structure of ConvNext Block is simple and easy to extend and modify.It can be adapted to different application scenarios and data sets.
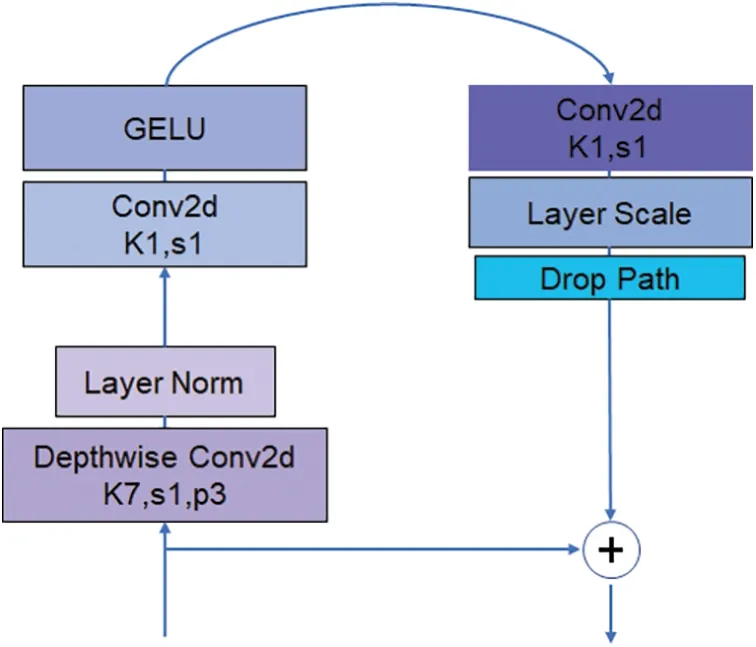
Figure 3:ConvNext block structure
The Downsample in ConvNext shown in Fig.4 comprises a Laryer Normalization plus a convolutional layer with a convolutional kernel size of 2 steps.It is a straightforward structure,but it brings a significant.ConvNext treats the Downsample as a separate structure by referring to the Swin Transformer [19],and the accuracy is improved to 82.0% after the change,which exceeds Swin-T’s 81.3%.The accuracy is improved.
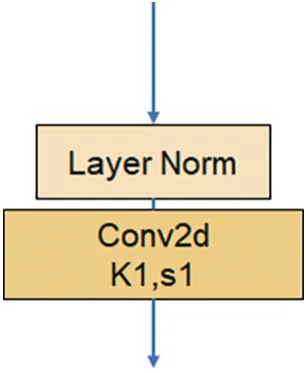
Figure 4:Downsample structure
ConvNext has several advantages over the ResNet50 network:firstly,it uses a sizeable convolutional kernel design.Although ResNet is very deep,it is mostly shortcut connections,which means that ResNet is a shallow network,and deepening does not lead to a vast,effective perceptual field.Then,the ConvNext network uses an inverse bottleneck layer(MobileNet v2)[20],which reduces the FLOPs of the network to 4.6 G but improves the accuracy from 80.5 to 80.6.If used in ResNet200,the step brings even greater significance from 81.9 to 82.6,reducing the number of operations.The next step is to replace BN with LN.ConvNext model can easily use LN,but directly using Layer Normalization in the original ResNet will lead to performance degradation.The ConvNext model,on the other hand,is thrilled with LN without any difficulty.It shows good performance in different application scenarios.Compared with Batch Normalization,Layer Normalization performs better when dealing with small batch data and can better adapt to various tasks and data sets.The overall framework of the ProNet network is shown in Fig.5.

Figure 5:ProNet network architecture
The ProNet network uses ConvNext-T as the backbone,which is less complex and more straightforward than the original UperNet and has high interpretability.ProNet can adapt to different sizes of network input images with the help of ConvNext multiscale feature fusion structure.In addition,ConvNext network structure is very flexible,allowing layers to be easily added and changed to suit different tasks and datasets.The cooperation with the detection head allows for better extraction and processing of image details and textures.
3 Improved Structure Based on ProNet Network
ProNet adopts some advanced opinions of the Swin-Transformer network to make some adjustments to the canny mesh in the existing ResNet50/200 network and recommends some of the ultramodern ideology and techniques of the Swin-Transformer network into the now available components of the CNN network to combine the advantages of both networks and enhance the capability of CNN network.The ProNet network introduces ConvNext as a backbone to obtain a better perceptual field and reduce the computational complexity while reducing the number of layers in the network;the network is suitable for segmenting multi-level perceptual attributes.The design of this fusion architecture can give full play to the advantages of the two networks and improve the ability of feature extraction and expression of the networks.
ProNet processes the images with pre-data enhancement before they are fed into the network to enhance the network’s property.This step is also an operation that preprocesses the image.The processing method includes adding noise and small angle rotation.As shown in Fig.6,left to right,the inchoative image,the rotated image,and the image after adding noise are shown in order.The sequence of the steps was as follows:first,the original image was rotated by 12°–15°randomly,then the image was flipped by the mirror image,and then the noise was added to the rotated and flipped image.Meanwhile,the makeup of the data enhancement process is revealed in Fig.7,which is the preimage processing of the network layer.The three data samples obtained are sent into the backbone network separately to get different segmentation results.

Figure 6:Example of data enhancement
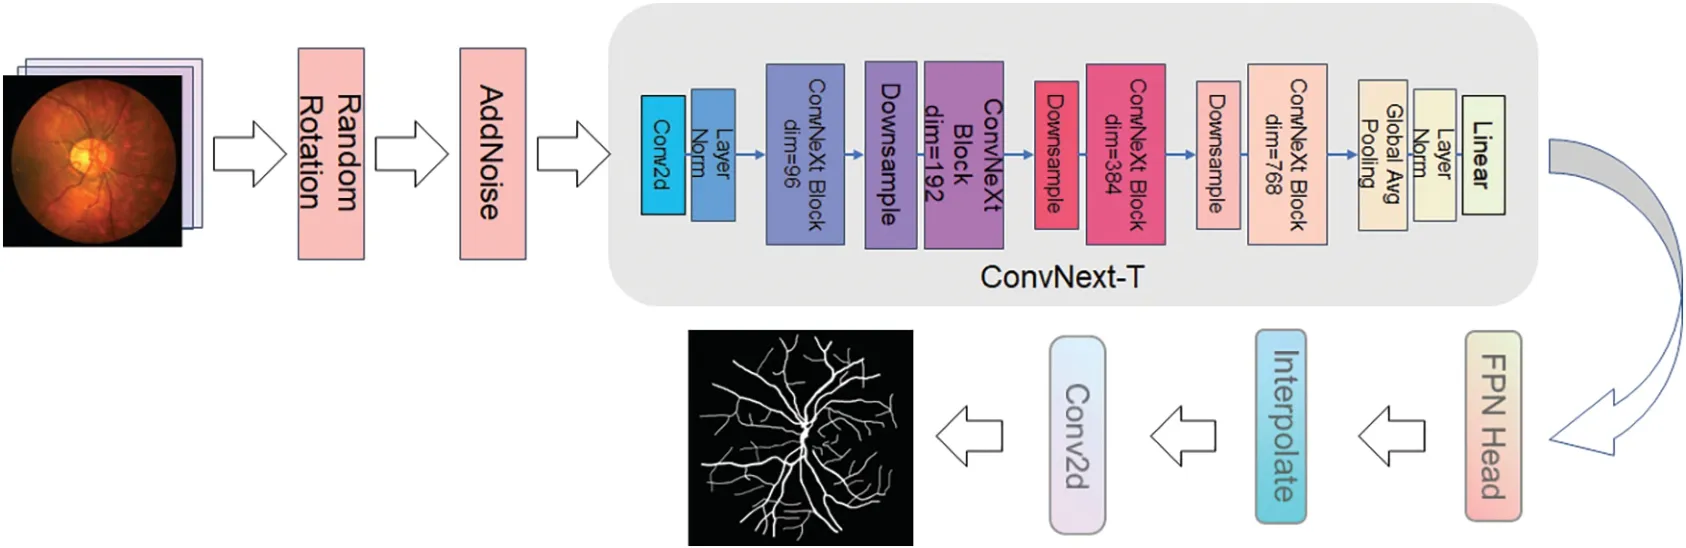
Figure 7:Data augmentation of ProNet
These data augmentation processes can add plentiful training sets and advance the model’s universality to enhance the noise data.It can advance the fault tolerance of the model and,at the same time,to some degree,it also can settle the problem of overfitting easily with too few patterns.In addition,it is used to figure out the matter of the swatch’s disequilibrium.For example,if a category is too small,data enhancement can augment the amount of this category,and there is no fabricated situation after image stitching,which can enhance the capability of the model category.Finally,Wavelet transform can decompose the signal into frequency components of different scales to analyze the local characteristics and details of the image.By applying wavelet transform,the network can better perceive the detailed information in the image and improve the network’s ability to perceive the details of the image.In network training,the application of wavelet transform can remove the noise and redundant information in the image,reduce the interference in the training process and improve the robustness and generalization ability of the network.Wavelet transform can represent the signal in sparse form;that is,there are only a few non-zero coefficients.The application in network training can improve the sparsity of signals and reduce the redundancy of features,which is helpful to improve the efficiency in enhancing any of the networks.
The ground on the loss function and the Focal loss function [21] were chosen as in Fig.8.CE(pt)denotes the touchstone cross-entropy equation,and FL(pt)indicates the enhanced cross-entropy employed in Focal loss,as shown in Fig.9.

Figure 8:Wavelet transform
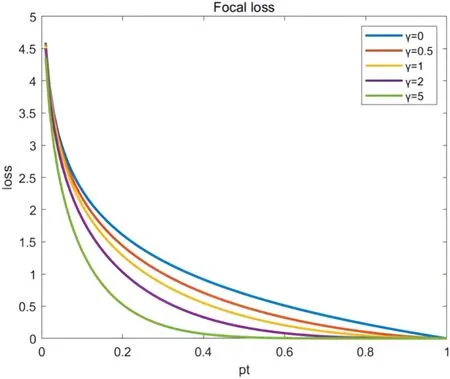
Figure 9:CE and FL comparison chart
Focal loss is a new loss function designed to address the problem of undertrained networks in extremely unbalanced classification problems.When using the conventional cross-entropy loss function,the imbalance of classification data often leads to the under-learning of the network.For example,when targeting the medical image classification problem,it is often difficult to train effectively using the cross-entropy loss function if the tumour samples are very few compared to the normal ones.The advantage of focal_loss is that it can better cope with the class imbalance problem and pay more attention to challenging samples during training.Specifically,the focal loss is equivalent to a particular form of the weighted cross-entropy loss function.It solves the category imbalance problem by introducing a balancing element to equilibrate the weights of positive and negative samples.In addition to the balancing factor,Focal loss also introduces a modulating factor,which enhances the classification precision of the network by amplifying the loss of complex samples that are easily misclassified during the training process to pay more attention to these samples.In retinal vascular segmentation,the boundary between blood vessels and normal tissues is blurred,and some complex samples are difficult to classify.The traditional cross-entropy loss function has limited modelling ability for these complex samples.The modulation factor is introduced into the focus loss function.By amplifying the loss of complex samples that are easily misjudged,these samples can be modelled more accurately,and the classification accuracy of the network can be improved.Thus,the Focal loss function can model complex samples more accurately and thus effectively raise the natural capacity of the model.It has shown promising results in many practical application scenarios and,therefore,has received widespread attention and use.To this end,a comparison of the results of four loss functions,dice loss[22],Focal loss,Lovasz loss[23],and Tversky loss[24],confirms that the Focal loss function provides significant eater improvement in overall network accuracy.The specific formula of the Focal loss function is as follows:
where pt represents the chance that the model predicts a category,it is designed to balance the number of masculine and feminine gender samples,with more samples assigned smaller values and fewer samples assigned larger values.γis used to regulate the matter of unbalanced hard-to-classify and easy-to-classify patterns,generally takingγ≥1,with a power function reduction of the cost of the easy-to-classify pattern,and the result is shown in Table 1.
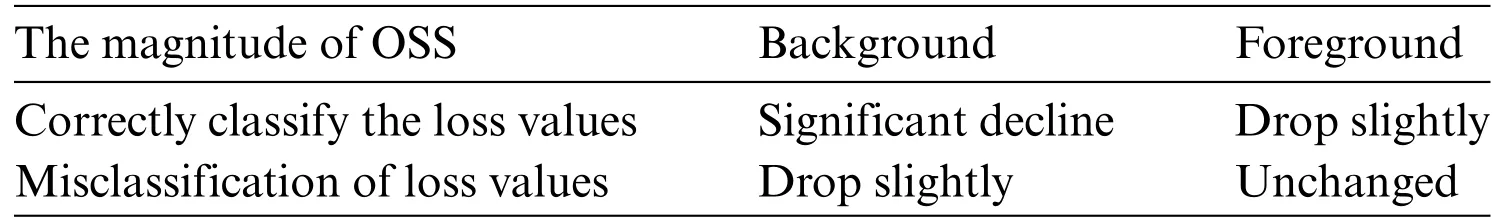
Table 1: Features of the focal loss function
4 Performance Evaluation Measures
When evaluating the performance of deep learning(DL)and other machine learning algorithms,especially in non-homogeneous databases,traditional metrics such as Intersection over Union(IoU),Dice coefficient,and accuracy can be misleading.Non-homogeneous datasets are characterised by characteristic class distributions and different levels of complexity and variability within the data,which can skew these metrics.To address these concerns,additional performance metrics and statistical measures are often employed.
One critical aspect of a robust statistical evaluation is the calculation of confidence intervals for performance metrics.This is because point estimates of performance (such as a single value for accuracy or area under the ROC curve)do not provide information about the estimate’s variability.By incorporating confidence intervals,we gain insight into the precision of our estimates and the reliability of the model’s performance[25].
4.1 Classification Metrics and 95%Confidence Intervals
The use of classification metrics with 95%confidence intervals(CIs)is a statistical method that helps to quantify the uncertainty in performance metrics derived from randomized tests.For instance,conducting 100 randomized trials helps generate an empirical distribution of the performance metric,from which a 95% CI can be extracted.This interval tells us that if we were to choose 100 different random samples from the population and compute the performance metric for each sample,95 of those compucalculatedics would fall within this interval,assuming all other conditions remain constant.
The 95%CI is particularly important in the statistical review of machine learning models because:
1.Reliability:It provides a range likely to contain the true performance metric of the population,offering a measure of reliability.
2.Stability: It can signal the stability of the model—narrow intervals suggest consistent performance across multiple samples or tests,while wide gaps might indicate a model’s performance is more variable.
3.Significance:It helps determine if the difference between two models’performance is statistically significant.
4.Generalization:Wide confidence intervals may also suggest that the model’s ability to generalize is uncertain,which is a critical aspect when dealing with non-homogeneous data.
4.2 ROC,AUC and Confidence Intervals
The Receiver Operating Characteristic(ROC)curve and the Area Under the ROC Curve(AUC)are widely used measures for evaluating the performance of binary classifiers.The ROC curve is a graphical representation of the trade-off between the actual positive rate and the false positive rate at various thresholds.AUC provides a single value that summarizes the classifier’s performance across all points.
When paired with 95%confidence intervals,ROC AUC becomes an even more robust measure:
1.Discrimination Ability:AUC represents the classifier’s ability to discriminate between the two classes.The closer the AUC is to 1,the better the model predicts 0s as 0s and 1s as 1s.
2.Randomized Tests: By applying the AUC measure to 100 randomised tests,we create an empirical distribution of AUC scores,which allows us to compute a 95%CI for the AUC.
3.Statistical Rigor: A 95% CI for the AUC gives us a range in which we are confident the true AUC of the model lies,considering the randomness and variability of the dataset.
4.Comparisons:When comparing multiple models,the overlap between their AUC 95%CIs can indicate whether the differences in performance are significant or likely due to random variation.
In summary,incorporating 95% CIs alongside traditional performance metrics adds a layer of statistical rigour to the evaluation process,providing a more comprehensive understanding of a model’s predictive power and stability,especially in the context of non-homogeneous data environments.
5 Experimental Process Analysis
5.1 Experimental Dataset
The datasets used in the experiments are from the open source datasets CHASE_DB1 dataset and DRIVE dataset.
(1)CHASE_DB1 dataset
The images in the CHASE_DB1 dataset are mainly from the UK Children’s Heart and Health Research Centre,and the datasets are all derived from school-aged children.There are 28 images,each with a size of 999 ∗960,and each image has corresponding hand-segmented vascular segmentation maps from two professors.In this paper,we use the first professor’s vascular segmentation image as the labelled image and divide these 28 images into two parts,the first 20 as the training set and the last eight as the test set.Fig.10 below shows the original fundus retinal image in this dataset,the segmented image processed by the expert AZAD R[26].
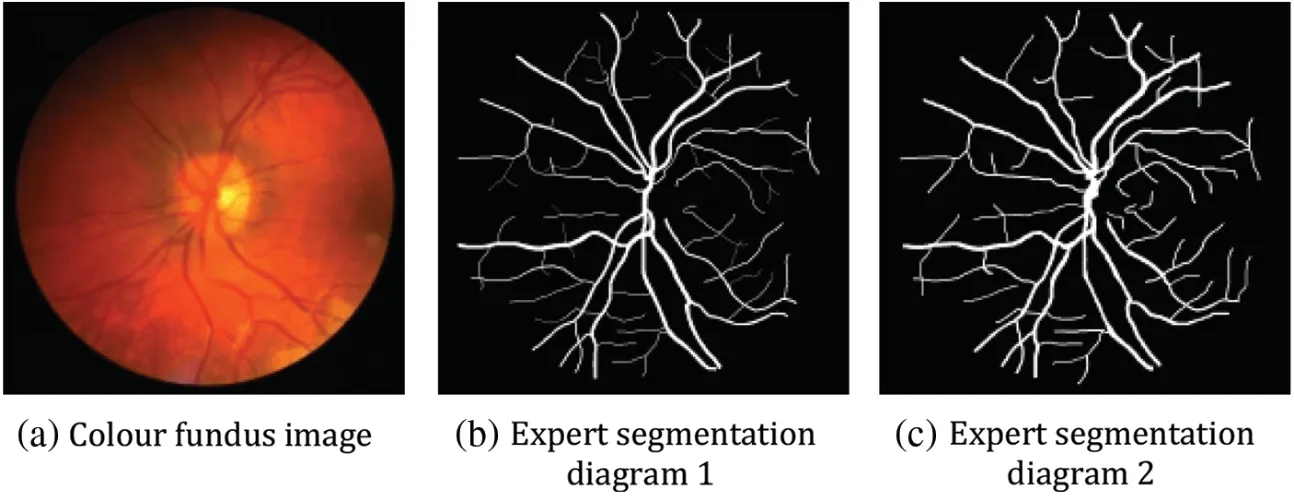
Figure 10:Example plot of the CHASE_DB1 dataset
(2)DRIVE dataset
The DRIVE dataset [27] originated in the Netherlands to screen for people with diabetic retinopathy.Forty of these images were chosen from the retinal images of 400 volunteers between the ages of 25 and 90.Each original image was 564×584 pixels,with 33 pictures sourced from healthy human eyes and seven images with retinopathy due to diabetes.Among these 40 images,the training set consists of the first 20 images,and 8 of the last 20 palms are chosen as the validation set.In the test set,two segmentation results were manually annotated by different medical professors.In this paper,the segmentation results of professional Ronneberger O[28]are chosen as the criterion for evaluating the model,as shown in Fig.11.
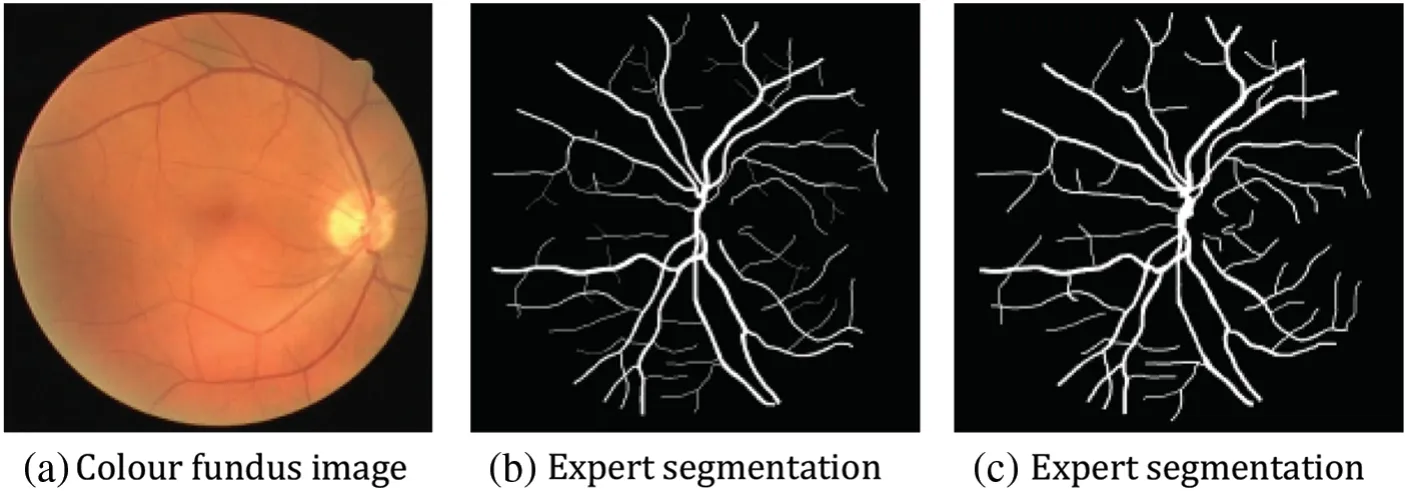
Figure 11:Example figure of the DRIVE dataset
5.2 Experimental Environment and Parameter Setting
The experimental environment of this experiment consists of a hardware environment and a software environment,and the specific configuration is shown in Table 2.
This paper uses about 28%of the training set as the validation set.The learning rate is initialized such that each image size in the CHASE_DB1 dataset is 999 ∗960,while the cropped length in the DRIVE dataset is 575 ∗575.In this paper,the batch size is 2 and 16 for training and testing,respectively.The number of epochs for the CHASE_DB1 and DRIVE datasets is 30 and 2,respectively.
5.3 Common Evaluation Indicators for Vascular Segmentation
The outcome evaluation index of this experiment relies on mIoU(mean Intersection over Union)and mDice,which are calculated as follows:
mIoU is an outcome measure variable based on the cut performed on the image,i.e.,the average of IoU values for each category on the dataset.True positive(TP)means accurate prediction,positive type,and proper positive category.False positive (FP) represents incorrect prediction,positive type,and appropriate harmful category.True negative (TN) means correct prediction,negative type,and suitable negative type.False negative(FN)means False negative(FN)is a wrong prediction,and the prognosis is negative.The appropriate class is positive.
Dice were used in most experiments to calculate the proportion of similarity between samples,and the coefficients usually take values from 0 to 1.
The relationship between the two is that both dice and IOU are similarity measures between the two collections.Also,Dice and mIoU are used as the final metrics to judge the effectiveness of network improvements[29].
5.4 Protocol of Experiments
To further enhance the capabilities of the network,we add the following related techniques:
(1)Comparative experiments
The effectiveness of different segmentation models was evaluated using ablation experiments,adding base augmentation to the ProNet network,and comparing the efficacy of the ProNet network with numerous deep learning method models in the same environment and dataset.The corresponding loss percentage needs to be explicitly added for samples with different resolution difficulties.Focal loss[30]aims to solve the problem of unbalanced classification among samples,reduce the detection time of indistinguishable samples,and thus enhance the network’s capabilities.
(2)Adopting a dual data set
The fundus retinal image datasets used in all sections of this paper are from the open source datasets CHASE_DB1 dataset and DRIVE dataset.Based on the CHASE_DB1 dataset,we perform an experimental ablation study to quickly localize the model and get the effect on different convolutional neural networks,taking a comparison test.After that,the second dataset,the DRIVE dataset,is introduced to verify the completion of the model network,and the details are processed and modified based on the first dataset to improve the related network further.
5.5 Experimental Results and Analysis
Before the model improvement,we evaluated the relevant experiments,and the following table shows the corresponding results:
The initial Network I-ProNet was rotated by 12°–15° randomly and mirrored the flip,which made the data widen.Network II-Pro-Net is obtained,and the results are shown in Table 3.The two evaluation metrics have the most significant improvement compared to other results,with mIoU improving by 2.68%and mDice improving by 1.78%.
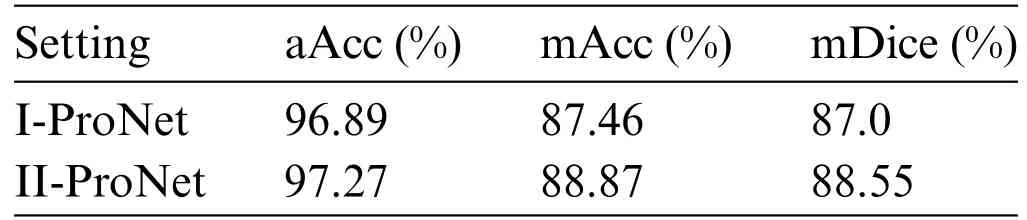
Table 3: Basic and cut+spin results comparison
After the processing of Network II-ProNet by adding noise,which makes the data further broadened and enhanced,Network III-ProNet is obtained,and the results are shown in Table 4.Both evaluation indexes are improved,and the experimental effect is steadily enhanced.The mIoU is improved by 0.22%,and mDice is improved by 0.16%.
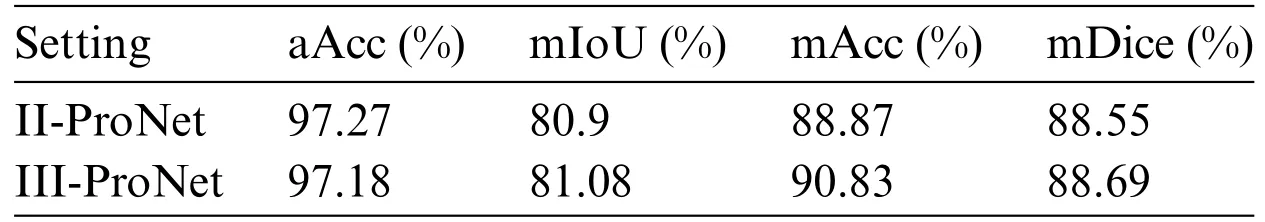
Table 4: Comparison of cut+spin and noise results
After a detailed analysis of Network II-ProNet and Network III-ProNet,the images were finally modified and integrated with detail,including noise reduction,secondary cropping of images,reduction of contrast of a specific color block,and a series of operations for multi-sample data enhancement to obtain Network ProNet and the results are shown in Table 5 with a combined mIoU improvement of 1.51%and mDice improvement of 0.96%.
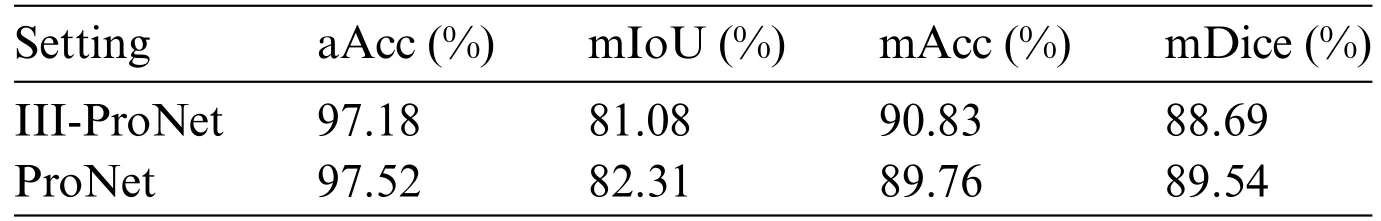
Table 5: Comparison of noise and final results

Table 6: Comparison of the CHASE_DB1 dataset with other retinal vessel segmentation methods
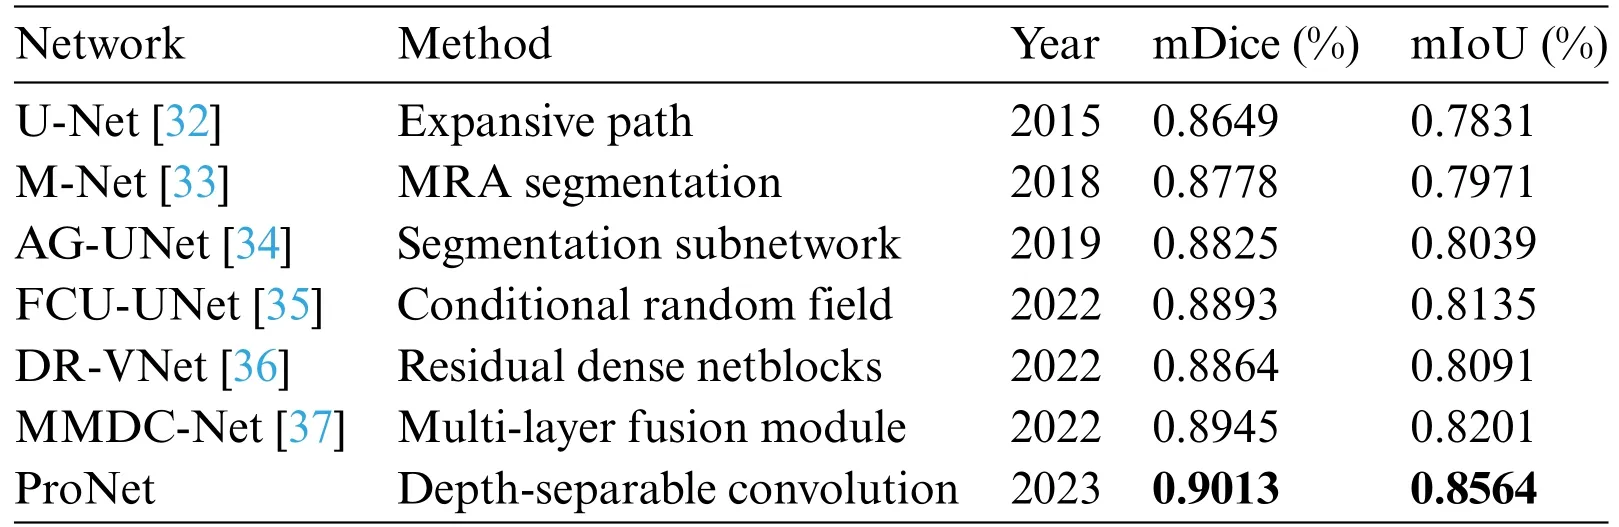
Table 7: Comparison of the DRIVE dataset with other retinal vessel segmentation methods
Ultimately,after improving the model,the evaluation metrics mIoU enhanced by 4.47%overall,and mDice enhanced by 2.92%overall.
Next,the second dataset has experimented with the same processing to validate the results of the model-improved network,and the results are shown in Fig.12.
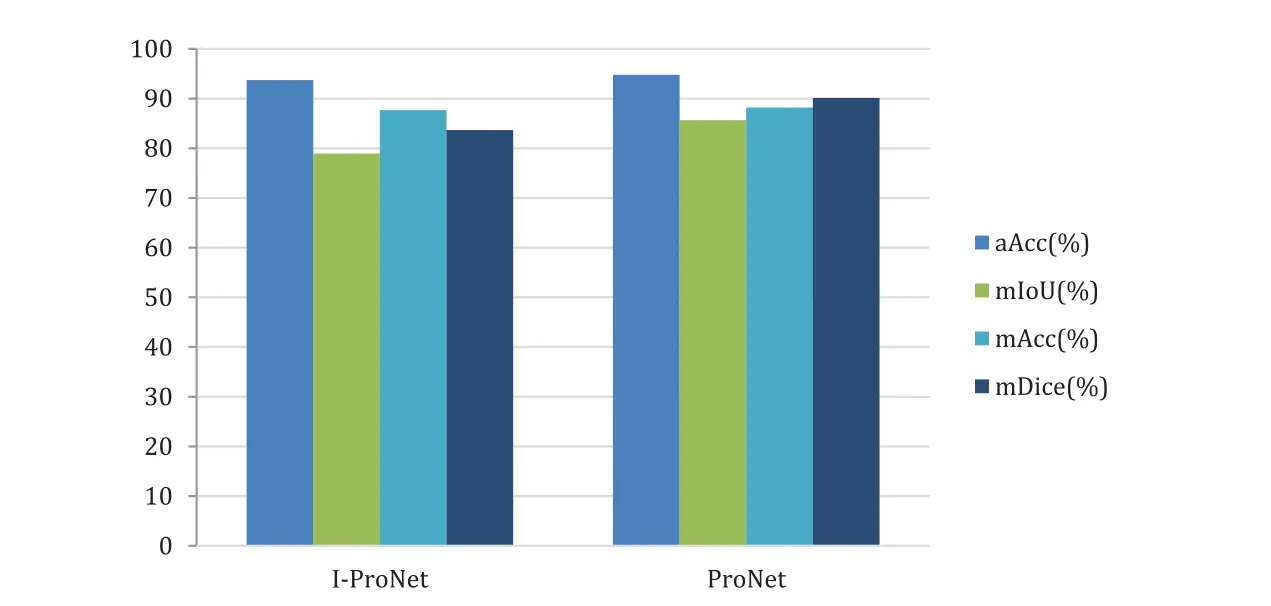
Figure 12:Comparison chart of improvement strategies on the DRIVE dataset
The DRIVE dataset significantly improves the evaluation metric mIoU by 8.50% and mDice by 7.76%.Compared to the CHASE_DB1 dataset,the evaluation metric mIoU is better than about 90.15%,and mDice is better than about 165.75%.
As shown by the above graphs,the results of the ProNet network proposed in this paper are better on the CHASE_DB1 dataset,as shown in Fig.13,but without the expected substantial improvement.The main reasons for the analysis are as follows: the dataset underwent increased noise processing,which,together with the low brightness of the image itself,led to the target segmentation position being mistaken for the background image,but the DRIVE dataset is well as shown in Fig.14.The DRIVE dataset avoids this defect,so the experimental results are improved substantially.
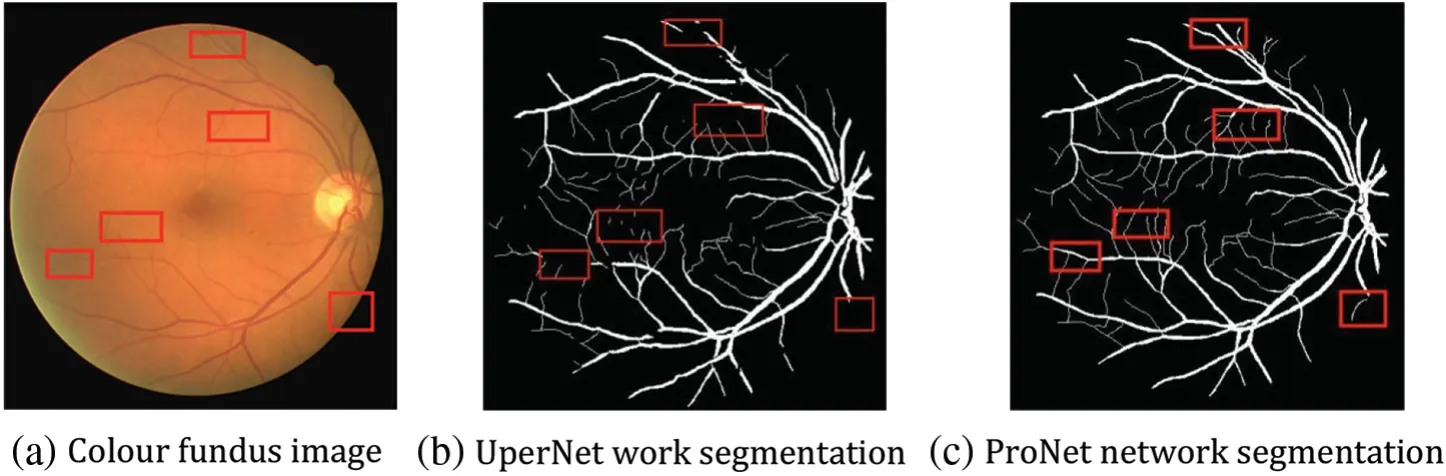
Figure 13:Comparison of before and after results of CHASE_DB1 dataset enhancement
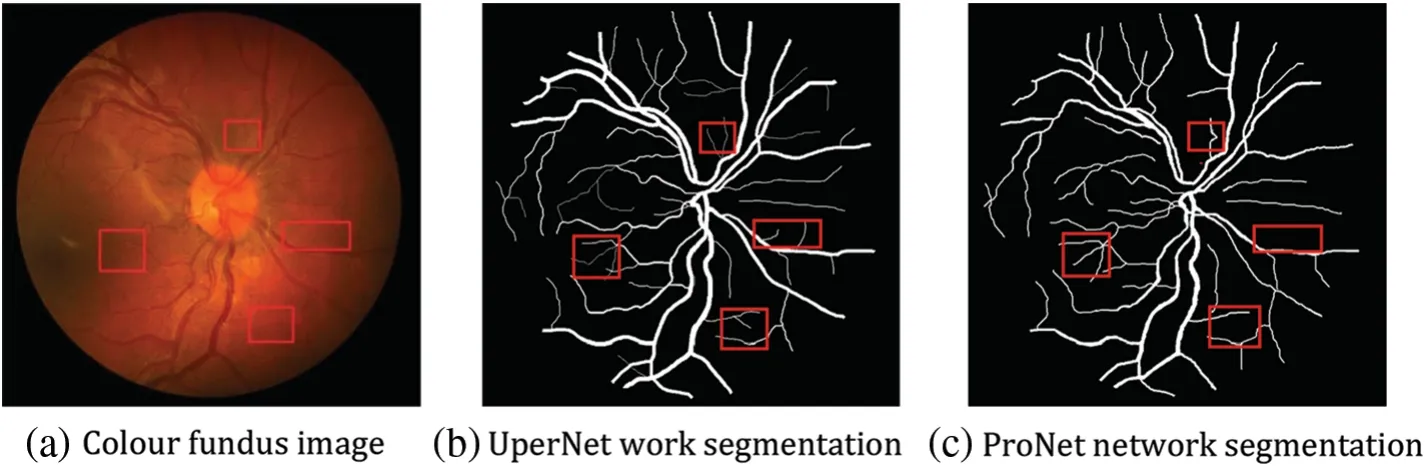
Figure 14:Comparison of before and after results of DRIVE dataset enhancement
The visualisation results can be seen in the following figure;for fundus vessels with different degrees of lesions,the improved network can perform good recognition under different vessel densities and in the face of varying divergence densities of boats and different degrees of the sparsity of arrangement,the improved network has better robustness [31].It can independently complete the segmentation of fundus vessel images under different situations with high segmentation density and high value of referenceable significance.
Fig.15 shows the loss value comparison curve between the improved ProNet and UperNet network,with the total loss value decreasing as the training batches increase and eventually stabilising.In summary,the enhanced network ProNet outperforms the UperNet network.
5.6 Comparison with Other Algorithm Results
Further comparison of the proposed ProNet network with other networks in this paper for advanced retinal vessel segmentation,a comparison of different advanced segmentation algorithms with the CHASE_DB1 dataset and the DRIVE dataset was performed by collecting different advanced segmentation algorithms in recent years,where the black bolded parts are the optimal values of this evaluation metric.The results are shown in Tables 6 and 7.
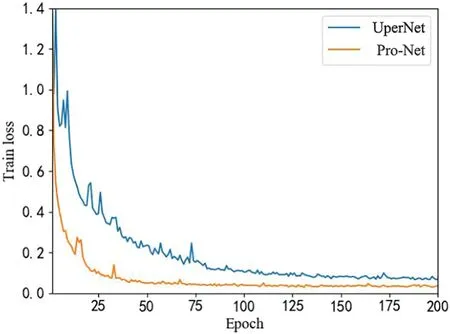
Figure 15:Comparison chart of total defect values
ProNet achieves the highest mDice score of 0.8954 and the highest mIoU score of 0.8231.This suggests that ProNet outperforms other methods in terms of both mDice and intersection over union mIoU.Among the previous methods,AG-UNet and FCU-UNet also perform well,with mDice scores of 0.8842 and 0.8806,respectively.However,ProNet surpasses them.
ProNet again achieves the highest scores with a mDice of 0.9013 and a mIoU of 0.8564,indicating its superior performance on this dataset.MMDC-Net also performs well,with a mDice score of 0.8945 and a mIoU of 0.8201.However,ProNet surpasses it in both metrics.
These results suggest that ProNet,introduced in 2023,is a highly promising and advanced network for retinal vessel segmentation,outperforming other methods on both datasets in terms of mDice and mIoU scores.Its superior performance may be attributed to its design and architecture,making it a valuable tool for medical image analysis and diagnosis.
6 Conclusion
This paper proposes a segmentation network,Pro-Net,for fundus retinal vascular image segmentation.The network uses ConvNext as the backbone and verifies its good performance with stable and efficient operation.Secondly,the network uses a focal loss function to add weights to the sample losses according to the ease of sample discrimination,shortening the algorithm’s running time and solving the data imbalance problem,dealing with multi-category disease-related effects and increasing the generalisability of the improved network described in this paper in the medical field.In addition,the network uses optimized processing of data augmentation to expand the training dataset through rotation,mirror flipping,and adding noise,alleviating problematic scenarios of insufficient data that may arise in the practical application of this improved network while enriching the diversity of training augmentations and increasing the generalization ability of this improved network to new prospects.It gives the new,improved network better performance and broader application than traditional medical image-cutting techniques.
In this paper,the network is trained using the CHASE_DB1 open-source and DRIVE datasets to test the improved performance.The experimental results of the CHASE_DB1 open-source dataset show an improvement of 4.47%in the evaluation metric mIoU and 2.92%in mDice.In comparison,the results of the DRIVE dataset show a gain of 8.50%in the evaluation metric mIoU and 7.76%in mDice.It indicates that Pro-Net has better generalization performance and good segmentation ability in fundus retinal vascular image segmentation.
Acknowledgement:We extend our heartfelt gratitude to all the non-author contributors who have played significant roles in this research endeavour.For the CHASE_DB1 dataset obtained from the UK Children’s Heart and Health Research Centre from school-aged children,we would like to acknowledge the invaluable assistance of individuals involved in data collection,analysis,and reporting.Additionally,our sincere appreciation goes to the patients and their families who participated as research volunteers.Their involvement has been instrumental in advancing our understanding in this field.Similarly,for The DRIVE dataset from the Netherlands,used for screening individuals with diabetic retinopathy,we acknowledge the dedicated efforts of those engaged in data curation and dissemination.We recognise the critical role played by each contributor and emphasise the importance of recognising the participation of patients and the public in research endeavours as appropriate and applicable.Their contributions have significantly enriched the outcomes of this study.
Funding Statement:The authors received no specific funding for this study.We extend our gratitude to the UK Children’s Heart and Health Research Centre for making the CHASE_DB1 dataset,an opensource retinal dataset,available,as well as to the Netherlands for the DRIVE dataset,an open-source dataset used to screen for diabetic retinopathy.
Author Contributions:The authors confirm their contribution to the paper as follows:study conception and design:S.Zhu;data collection:S.Zhu;analysis and interpretation of results:S.Zhu,P.Wang;draft manuscript preparation:S.Zhu,P.Wang,K.Shen.All authors reviewed the results and approved the final version of the manuscript.
Availability of Data and Materials:The data for this study is derived from open-source datasets.
Conflicts of Interest:The authors declare that there is no conflicts of interest to report regarding the present study.
杂志排行
Computers Materials&Continua的其它文章
- Fuzzing:Progress,Challenges,and Perspectives
- A Review of Lightweight Security and Privacy for Resource-Constrained IoT Devices
- Software Defect Prediction Method Based on Stable Learning
- Multi-Stream Temporally Enhanced Network for Video Salient Object Detection
- Facial Image-Based Autism Detection:A Comparative Study of Deep Neural Network Classifiers
- Deep Learning Approach for Hand Gesture Recognition:Applications in Deaf Communication and Healthcare