Spatiotemporal Prediction of Urban Traffics Based on Deep GNN
2024-03-12MingLuoHuiliDouandNingZheng
Ming Luo ,Huili Dou and Ning Zheng
1School of Computer Science,Hangzhou Dianzi University,Hangzhou,310018,China
2Zhejiang Institute of Communications,Hangzhou,310012,China
3School of Cyberspace Security,Hangzhou Dianzi University,Hangzhou,310018,China
ABSTRACT Traffic prediction already plays a significant role in applications like traffic planning and urban management,but it is still difficult to capture the highly non-linear and complicated spatiotemporal correlations of traffic data.As well as to fulfil both long-term and short-term prediction objectives,a better representation of the temporal dependency and global spatial correlation of traffic data is needed.In order to do this,the Spatiotemporal Graph Neural Network(S-GNN)is proposed in this research as a method for traffic prediction.The S-GNN simultaneously accepts various traffic data as inputs and investigates the non-linear correlations between the variables.In terms of modelling,the road network is initially represented as a spatiotemporal directed graph,with the features of the samples at the time step being captured by a convolution module.In order to assign varying attention weights to various adjacent area nodes of the target node,the adjacent areas information of nodes in the road network is then aggregated using a graph network.The data is output using a fully connected layer at the end.The findings show that S-GNN can improve short-and long-term traffic prediction accuracy to a greater extent;in comparison to the control model,the RMSE of S-GNN is reduced by about 0.571 to 9.288 and the MAE(Mean Absolute Error)by about 0.314 to 7.678.The experimental results on two real datasets,Pe MSD7(M)and PEMS-BAY,also support this claim.
KEYWORDS Urban traffic;traffic;temporal correlation;GNN;prediction
1 Introduction
The Internet of Things technology[1],which travels thousands of miles every day,has been applied to various traffic devices,generating a significant amount of traffic data.Intelligent transportation has emerged and demonstrated a vigorous development trend in response to the ongoing development of the social economy and the growing complexity of traffic road networks.How successfully this data is processed and used will have a significant impact on the growth of smart cities.Forecasting future traffic patterns in distinct urban areas is of vital importance in the study of intelligent transport systems.By analysing past traffic observations,traffic prediction predicts future metropolitan realtime traffic flows [2].The public can enhance their travel experiences and safeguard their personal safety by managing traffic to avoid congested areas,preventing stampede situations and adopting safety precautions,minimising operational costs,and scheduling demand.
Prediction of traffic flows is necessary;prediction can help to anticipate risks,avoid congestion and prevent hazards.As a result,traffic prediction has become a hot research topic in recent years[3].The key points to improve prediction accuracy are in the following areas:1)A significant difficulty is how to effectively represent the spatial interactions,the temporal-spatial interactions,and the temporal interactions of crowd flows.Figs.1 and 2 demonstrate how crowds create a complex web of interactions in both space and time.2)How to effectively capture the potential similarity patterns between forecast data and historical traffic data(i.e.,proximity data,periodic data and trend data)is another challenge[4].The numbers in Fig.2 show the cars that left from various locations and arrived at the destination at a specific time.For instance,yellow represents the vehicles that left from point A and blue represents the vehicles that arrived at point A.The vehicle traffic patterns are shown in Fig.3,the x-axis represents time (seconds) and the y-axis represents observations (kb);closeness denotes previous data that is closer to the forecast,periodicity denotes the same time period each day,and trend denotes traffic data that exhibits a trend over a specific time period.
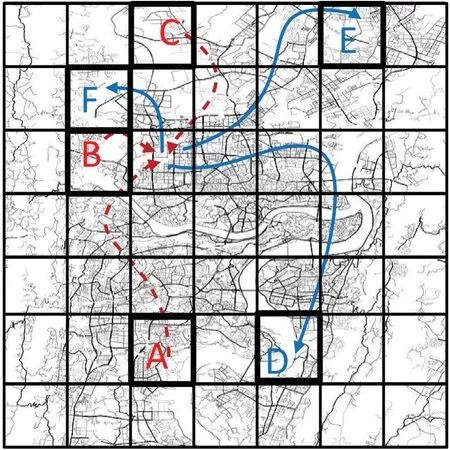
Figure 1:Spatial interaction of traffic data
Traditional traffic prediction techniques frequently only take into account a single information,such as a temporal or geographical feature;current deep learning techniques also take these features into account in combination,but they do not efficiently and completely capture them.To address the aforementioned issues,this research suggests S-GNN,a multi-attentional predictive RNN(Recurrent Neural Network)and a temporal sequence-dependent attentional convolutional long and short-term memory network[5].CNN(Recurrent Neural Network)and predictive RNNs(Pred RNN)are first used to capture the spatiotemporal interaction features,and then a proximity attention module,a periodic attention module,and a trending attention module are used,respectively,to capture the proximity,periodicity,and trending of traffic data in the temporal sequence-dependent attention module.
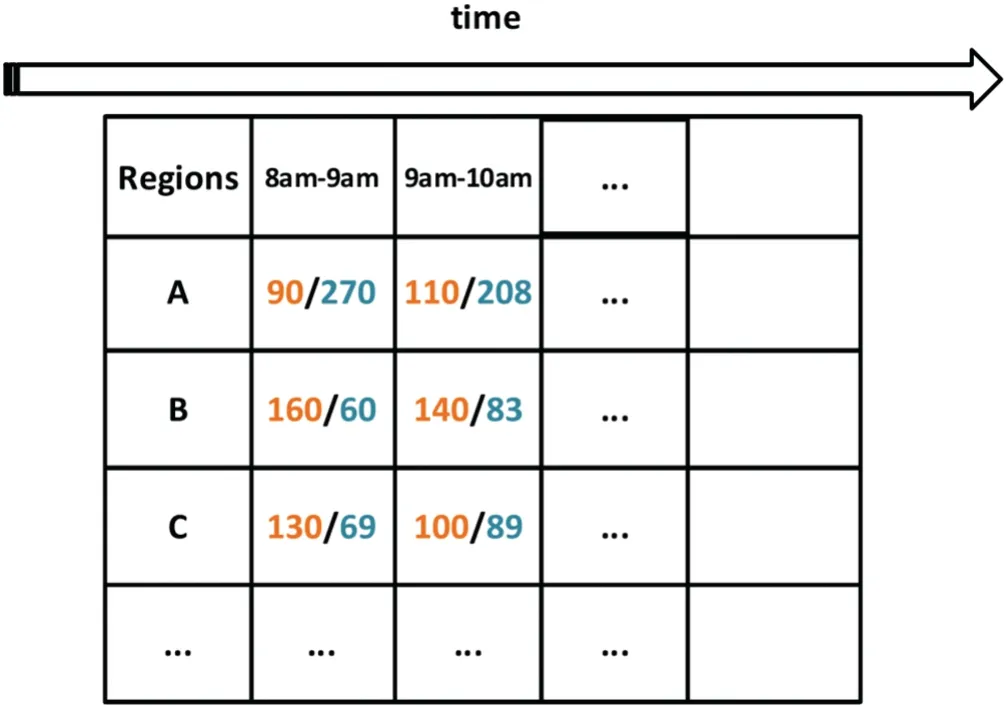
Figure 2:Interaction of traffic data over time
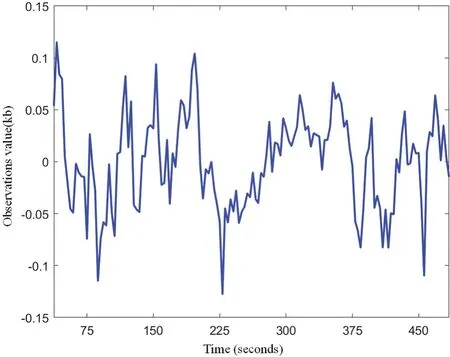
Figure 3:Vehicle traffic trends
The novel contributions of our S-GNN model can be highlighted as follows:
a.Comprehensive Representation:While various models incorporate time and space modules,our S-GNN aims to provide a more comprehensive representation by integrating multiple factors including flow,occupancy,and average speed simultaneously.Thus,it can capture complex relationships and nonlinear correlations among diverse traffic variables in a unified manner.
b.Enhanced Attention Mechanism:The proposed model employs a graph-based attention mechanism that goes beyond simple GAT.The attention mechanism in S-GNN adapts the attention weights to adjacent areas of target node,thus,it can effectively capture varying influences from different regions of the road network.This provides a finer-grained understanding of spatial correlations compared to traditional GAT.
c.Residual Connectivity and Model Complexity:We introduce residual connectivity within the proposed model,which contributes to better gradient flow during training,potentially leading to faster convergence and improved prediction accuracy.Exploration of the optimal number of attention layers in our analysis indicates the importance of balancing model complexity and performance.
d.Extensive Evaluation:The proposed model is rigorously evaluated on real-world traffic datasets,PeMSD7(M) and PEMS-BAY,demonstrating its ability to achieve superior prediction accuracy compared to various baseline models.The results showcase its effectiveness not only in short-term but also in long-term traffic prediction scenarios.
The organization of the remaining paper is outlined as follows: Section 2 presents an overview of related work in the field.In Section 3,a comprehensive background understanding is provided.Section 4 details the mathematical formulation of the proposed S-GNN model.The experimental results are presented in Section 5.Finally,Section 6 concludes the paper by summarizing the main findings and discussing potential future directions.
2 Related Works
The emergence and development of deep learning[6]have been a great improvement in capturing non-linear relationships between data,and therefore some scholars have also applied it to solve traffic flow prediction problems.
In order to handle the challenge of forecasting cab demand,the literature[7]presented a multiview spatiotemporal network to understand the geographical links,temporal links,and regional similarity relationships that exist between data.According to the literature[8]suggested for capturing spatiotemporal aspects of global dynamics,GSTNet is a deep learning method made up of multilayer spatiotemporal blocks,each of which consists of a temporal module and a spatial module.Both the temporal and the spatial modules are used to record temporal and spatial characteristics,respectively.A deep learning framework(Dynamic GRCNN)was put forth in the literature[9]to address the issue of predicting urban traffic flow.Dynamic GRCNN models dynamic traffic station relationships as spatiotemporally correlated dynamic graph structures in order to capture the proximity,periodicity,and trends of traffic data based on historical traffic flows.A deep learning method for traffic prediction(MDGRU)was created in the literature[10]in response to the issue of travel delay,or the time needed for cars to change locations.This method develops a delay-based GRU (Gate Recurrent Unit) and builds the model by stacking.A two-stage deep STD(State Transform Diagram)was proposed in the literature[11]to predict urban traffic flow,which can simulate various regional perturbations and spatiotemporal propagation effects caused by various regional functions.Spatiotemporal perturbations are removed from historical traffic flows to enhance the learning of inherent traffic patterns in the prediction stage.
The literature [12] proposed a traffic flow prediction method that combines long and shortterm memory networks,convolutional neural networks,using cellular neural networks to capture temporal correlations,and the model also takes into account external factors like weather in order to further improve the spatiotemporal characteristics of traffic flow data.In response to the complexity,nonlinear linkages,and unpredictability of traffic flow data,the literature [13] offered a novel spatiotemporal extended squeeze network (ST-ES-Net) framework,which designed numerous successful solutions.In the literature,a multi-task framework for the prediction of node and edge flows in spatiotemporal networks has been established [14].The literature [15] proposed a deep learning embedding technique (DELA) for modelling fine-grained traffic information,route structure,and meteorological conditions.
In[16],Zhang et al.introduced the STAGCN model,which integrates a spatio-temporal attention mechanism into graph convolutional networks.This innovative approach demonstrated superior predictive accuracy compared to standard methods.In [17],Zhao et al.proposed MSTFGRN,a multi-spatio-temporal fusion graph recurrent network.By dynamically generating weighted adjacency matrices and incorporating global attention,MSTFGRN surpassed existing models in capturing complex dependencies.In [18],Lablack and Shen devised the STGM network,designed to tackle dynamic node interactions over time.Through a novel attention mechanism and efficient architecture,STGM achieved enhanced predictive performance while maintaining fewer parameters.In [19],Wang et al.introduced TransGAT,a dynamic graph attention network utilizing node embedding and TCN.This model excelled in various time intervals,exhibiting improved accuracy in traffic flow prediction.In [20],Li et al.developed SSTACON,a shared spatio-temporal attention convolution optimization network.SSTACON’s unique design,encompassing attention layers and graph optimization,showcased superior results across different timeframes.In[21],Li et al.innovated CVSTGCN,a coordinated attention-based spatio-temporal graph convolutional network.By combining coordinate methods with graph convolutional networks,CVSTGCN demonstrated remarkable predictive power in both short and long-term traffic flow scenarios.
Although the aforementioned solutions have some impact on traffic flow,they ignore the spatiotemporal correlation,such as temporal features or spatial characteristics;current deep learning techniques also take these characteristics into account,but they do not effectively and fully capture them.However,these models suffer from various limitations including potential inability to capture abrupt traffic changes,and computational complexity,which could hinder real-time implementation.
3 Background Knowledge
3.1 The Traffic Prediction Problem
A traffic network can be defined as an graphG=(V,E,A),whereErepresents the set of edges between nodes,reflecting the connection between links,andA∈RN×Nrepresents the adjacency matrix formed by Euclidean distance between sensors,TheiandjelementsA=[i,j]represent the strength of the relationship between nodesviandvj.If there is no close relationship between the two nodes,ThenA=[i,j]=0,each node records traffic characteristics,such as traffic value,speed,road occupancy,etc.In order not to lose generality,this study focuses on the prediction of speed,that is,the speed on the road section is regarded as the attribute of the network node[22].Given the traffic conditions observed at the lastT′hours,that is,the characteristic matrixX(T)=xiis the traffic characteristics of each section at timei,and N is the number of sensors in the traffic network,That is,the number of nodes,Cis the characteristic number.The traffic prediction problem can generally be expressed as the prediction of traffic informationat the nextThours by learning modelFθon the premise of road network topologyGand historical traffic data characteristicX(T),as shown in Eq.(1):
3.2 Modeling of Diagram Structure
When aggregating the information of nodes in the road network,the accessibility of adjacent nodes and the impact of upstream and downstream relationships should be considered[23].Therefore,in this study,the road network is modeled graph structure,and the edge set is defined asE,and the vertex set is defined asV.The topological structure of the road network isG=(V,E).Define the adjacency matrix of the graph asA,thenGt=(V,E,A)is the graph at thettime step,andVtis its point set.The adjacency matrixAof the graph with nodenis expressed as:
4 S-GNN Model
S-GNN model structure is depicted in Fig.4.A number of traffic flow parameters are entered into the S-GNN model’s input layer.To determine the difference between the anticipated value and the actual value and to continuously update the network’s parameters,the data sequence is sent through the time module,space module,and output layer.
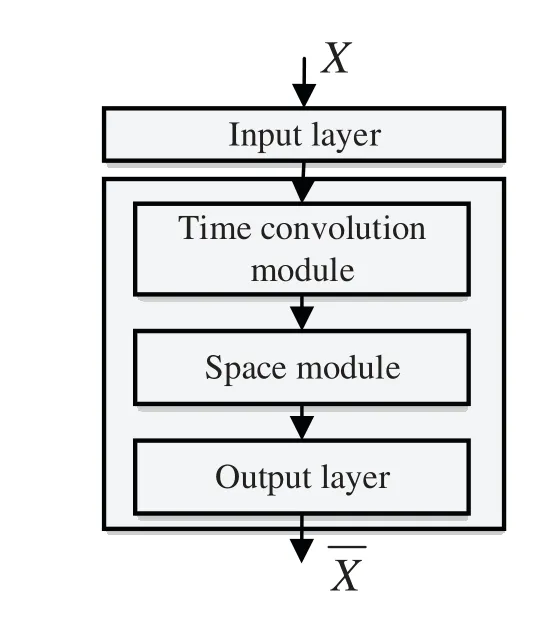
Figure 4:Structure of the S-GNN model
4.1 Multi Factor Input
Numerous factors,such as flow,occupancy,average speed,and others are taken into consideration while determining the traffic flow order.Each component has an impact on the others.It is necessary to investigate the nonlinear link between traffic forecast and traffic sequence further[24].In order to identify the nonlinear link between the various traffic variables and make accurate predictions,this work models traffic,time occupancy,and average speed all at once.
4.2 Time Module
In the time dimension,the standard one-dimensional convolution is used to aggregate the characteristics of the time step.Compared with LSTM(Long Short-Term Memory)and GRU models,one-dimensional convolution does not rely on the previous output during training,does not need iteration,has less computation and low time complexity[25].
1D convolution operation is a fundamental mathematical operation which involves sliding a filter(also known as a kernel) along a 1D input sequence and computing the dot product between the filter and the corresponding portion of the input at each position.This operation allows the network to capture local patterns and features within the input sequence.The operation principle of onedimensional convolution is shown in Fig.5(for more details see[26]).
Set the input data asX,the characteristic length of each vertex asCi,and the time step asM[27].The convolution operation with the size of one dimension is performed along the time dimension without padding,and the inputXis mapped to the matrixY,and the output of the time dimension is:
4.3 Space Module
GAT(Graph Attention Network)is used to process the directed graph in the spatial dimension,and the multi-head self-attention mechanism is utilised to create each attention subspace separately,lowering the likelihood that the model would become overfitted and increasing the model’s capacity for spatial expression[28].The GAT structure is shown in Fig.6.
TakeYmodule as the input of the space module:
whereyNis nodeNfeature vector after temporal module output.The spatial module output is:
Let the weight matrixWthat transforms the input features into output features,then the attention value of nodejon nodeiis:
wherea(·)is the function that calculates the correlation of the nodes.
Use theLeakyReLUfunction to activate it:
whereLeakyReLU(·)is the activation function.
Find the attention values of all neighbors of nodei.Use thesoftmax function to normalize the attention weights:
whereLeakyReLU(·)is the activation function;ais the vector to be learned;aTis the transpose of vectora;and||is the splicing operation.
With the graph attention layer feature extraction using weighted as output:
whereσ(·)is the activation function;αijis the attention value of nodeiat nodej.
If a multi-headed attention whereKsets of attention coefficients are calculated independently and then averaged output is:
whereakijis the kth set of attention values of nodeion nodej.
Then final prediction is:
The loss function is:
5 Experimental Results
5.1 Data Set Description and Setup
In the experiments,PeMSD7(M)andPEMS-BAYdatasets were used to evaluate the proposed model.PeMSD7(M)Collected traffic information from 229 monitoring stations on the California Highway System during weekdays from May to June 2012.PEMS-BAYContains traffic information collected from 326 sensors in the Bay Area,California,between January 01 and May 31,2017.Traffic data information was summarized every 5 min and normalized usingZ-Scoreas input.Table 1 provides detailed statistical information on the dataset.
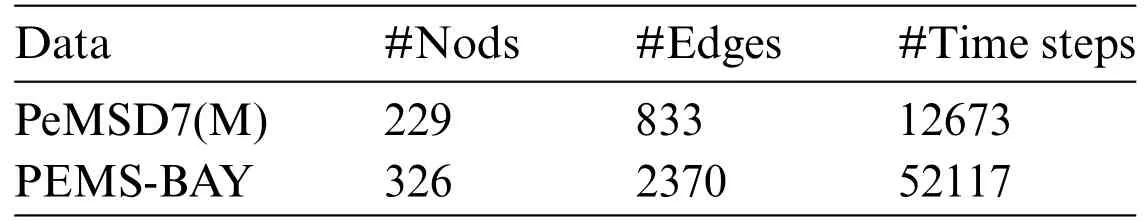
Table 1: Dataset statistical
The topological information of the traffic network is represented by the graph adjacency matrix.For thePEMS-BAYdataset,the edge with the maximum weight between each pair of nodes is used to construct the undirected graph and represent the topological information of the traffic road network in this way;for thePeMSD7(M)dataset,the weighted adjacency matrixWcan be expressed as:
whereδ=0.1 andε=0.5,wijare the edge weights associated withdij(the distance between nodeiand nodej),respectively,based on thresholdsδandεthat represent the distribution and sparsity of the weighted adjacency matrixWin the literature.By implementing a grid search strategy,the best parameters were located at the time of validation.Data from 12 observations (historical time stepτ=12)were used on both datasets,i.e.,a historical time window of 60 min was used to predict traffic conditions for the next 15,30 and 60 min(time stepT=3,6,9).The temporal convolution layer’s size of the expansion factor is set at 1,2,1,2,1 in order to cover the length of the input sequence.The spatiotemporal convolutional layer has 64,16,64 channels in total.The Adam optimizer,which has the benefits of straightforward implementation,effective calculation,low memory requirements,and suitability for situations involving huge amounts of data and parameters,is utilised for optimisation in this study[29].The iteration period is 50,the batch size parameter is 50,the learning rate parameter is 0.001,and the weight decay factor of L2 regularization is 5×10⁻⁴.
5.2 Assessment Metrics and Baselines
In this paper,three widely used evaluation metrics,Mean Absolute Error (MAE),Root Mean Square Error (RMSE) and Mean Absolute Percentage Error (MAPE) are used to measure the performance of the different methods.The baseline models compared are: 1) historical averaging model (HA);2) ARIMA [12];3) FC-LSTM [14];4) STGCN [3];5) Graph Wave Net [7];6) Space-Time Transformation Network(STTN);7)Graph Convolution Network(LSGCN)using gated line cells.
5.3 Comparison and Analysis of Results
Table 2 shows the results,and it is clear from the three-assessment metrics that the S-GNN performs admirably in both short-and long-term prediction [30].Both datasets showed promising results for S-GNN,particularly in the long-term prediction task.The table presents performance metrics for various traffic flow prediction models on two datasets,PeMSD7(M) and PEMS-BAY,at different time intervals (15/30/60 min).The metrics include Mean Absolute Error (MAE),Root Mean Squared Error(RMSE),and Mean Absolute Percentage Error(MAPE%).The models range from traditional methods like HA and ARIMA to advanced neural network models like FC-LSTM,STGCN,Graph Wave Net,and more.The proposed S-GNN model consistently outperforms other models across both datasets and time intervals,demonstrating significantly lower MAE,RMSE,and MAPE%.Notably,the model achieves remarkable accuracy with MAE values as low as 1.90 for PeMSD7(M) and 1.23 for PEMS-BAY,showcasing its effectiveness in traffic flow prediction across different scenarios and prediction horizons.
The experimental results show that traditional traffic prediction statistical models,like the HA and ARIMA models,do not have satisfactory prediction results because they cannot handle complex spatiotemporal data,while deep learning-based spatiotemporal prediction methods,like FC-LSTM,STGCN,Graph Wave Net,STTN,and S-GNN,tend to achieve better prediction results than traditional prediction statistical models.STGCN captures both temporal and spatial dependence jointly through gated convolution and graph convolution-based approaches,which is significantly better than FC-LSTM,but it relies on graph structure,ignores global spatial features,and cannot determine the significance of inter-node relationships.FC-LSTM uses LSTM to capture the temporal dependence of traffic data,but it is still insufficient in capturing spatial dependence[31].In comparison to STGCN,Graph Wave Net’s bi-directional diffusion graph convolution takes into account the influence of directionality,improving prediction results;however,STTN performs better in longterm prediction than Graph Wave Net,but still has issues with short-term prediction,and the overall prediction results are still slightly below the model proposed.The Pe MSD(M) dataset is smaller relative to the PEMS-BAY dataset,i.e.,smaller in both time and space,resulting in a much larger standard deviation of its acquisition speed than the PEMS-BAY dataset,and consequently the capture of spatiotemporal correlations of traffic data on the Pe MSD(M) dataset is relatively more difficult[32].This is why the majority of baseline models and the models in this study perform better on the PEMS-BAY dataset.
MAE,RMSE and MAPE values are plotted for both short-and long-term forecasts on the Pe MSD(M)dataset,as shown in Fig.7.In general,as the forecast time grows,the corresponding forecast difficulty and forecast error also increases.From the Fig.7,it can be seen that the performance of traditional prediction models is poor and deep learning-based models can achieve better results in spatiotemporal prediction,and the prediction performance of the network model designed in this paper is higher than that of other deep learning methods.In order to more intuitively show our model’s prediction of traffic flow,the prediction effect is shown in Fig.8.
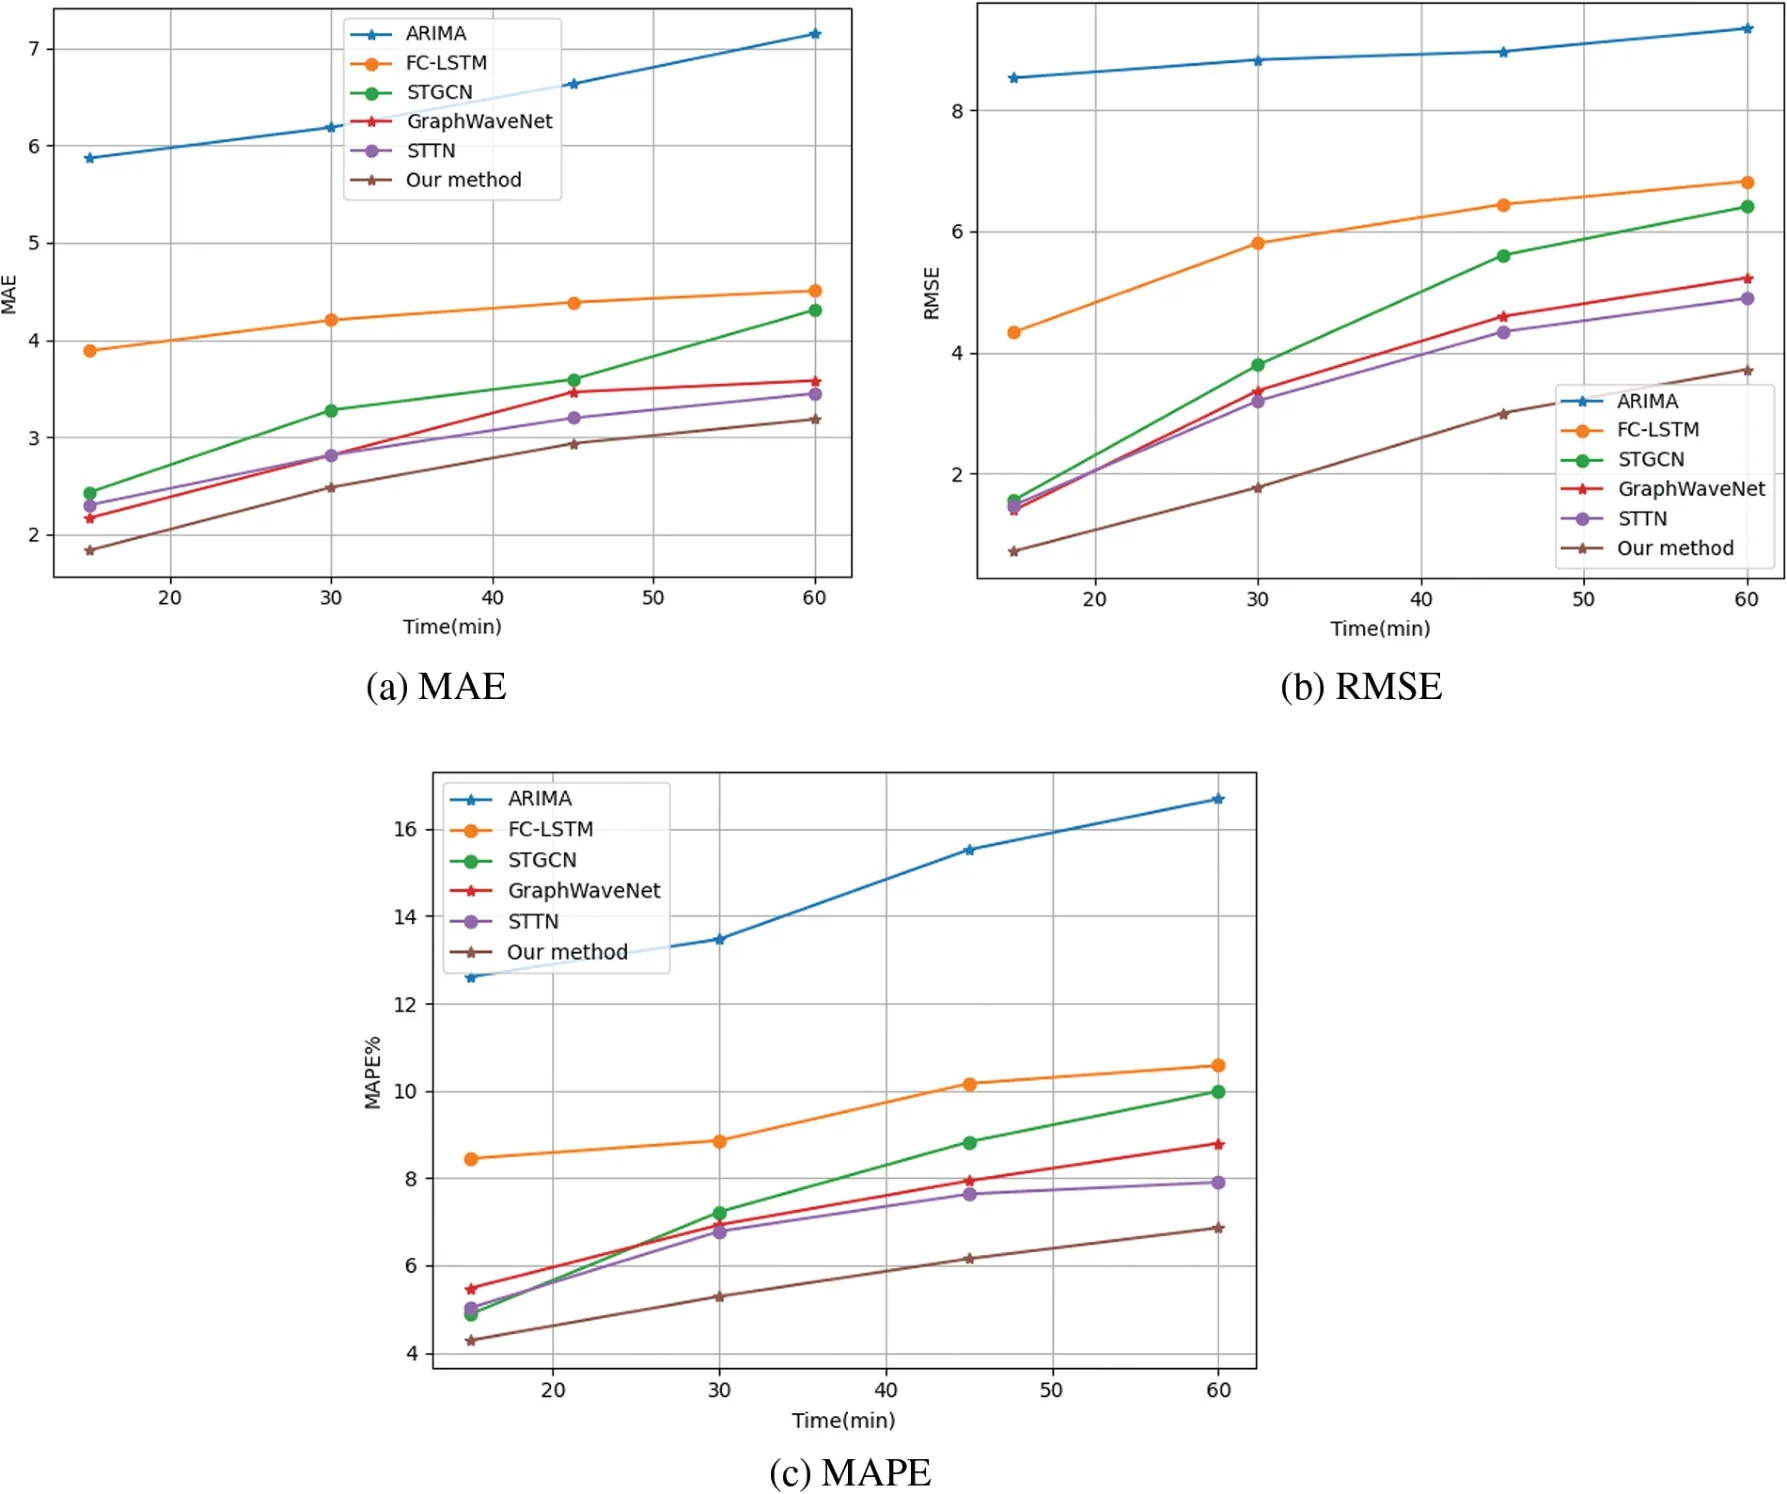
Figure 7:Results of the PeMSD7(M)prediction
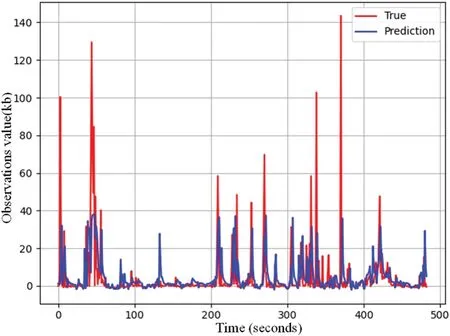
Figure 8:Our technique for predicting traffic
5.4 Network Design Analysis
In order to assess the effectiveness of the attention mechanism described in this research,the proposed model S-GNN,the model S-GNN-1 without the attention mechanism,and the STGCN model with the same iteration process were compared on the Pe MSD(M) dataset and the PEMSBAY dataset.Figs.9 and 10 show the outcomes,respectively.The outcomes show that S-GNN can reduce prediction error and improve the model’s performance.
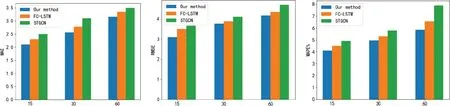
Figure 9:PeMSD7(M)dataset
5.5 Convergence Speed Analysis
This section aimed to assess the convergence rates of three distinct models:STGCN,FC-LSTM(after residuals removal),and S-GNN,employing the PeMSD7(M)dataset for evaluation.By plotting training loss curves against the number of iterations,the study examined the convergence behavior for 15,30,and 60-min forecasts.The obtained results,presented in Fig.11,exhibited intriguing patterns.
S-GNN model consistently demonstrated the most rapid convergence to the lowest loss values across all time horizons.This effect was particularly pronounced in the context of long-term predictions.The outcome underscores S-GNN’s exceptional fitting capability for the specific test dataset,accentuating its superiority over both STGCN and FC-LSTM model[33].
These findings offer valuable insights into the dynamics of model convergence,shedding light on S-GNN’s effectiveness in adapting to the intricacies of the PeMSD7(M)dataset.In essence,S-GNN emerges as a compelling solution,boasting remarkable convergence rates and highlighting its potential for accurate and efficient traffic flow prediction,especially in prolonged forecasting scenarios.
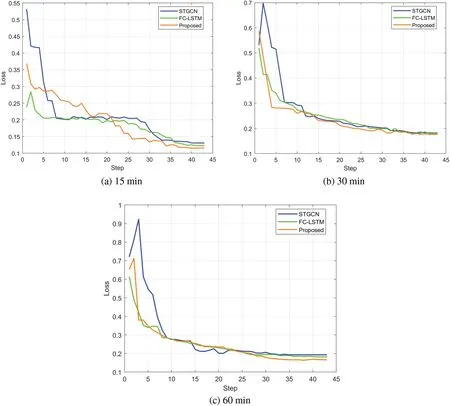
Figure 11:Convergence rate analysis
5.6 Analysis of Attentional Layers
The Pe MSD(M)dataset was used for the graph attention layer validation trials,and the outcomes are displayed in Table 3.According to the experimental findings,the training time and prediction error rise as the number of attention layers grows,therefore the prediction performance is higher when the number of attention layers is 1.
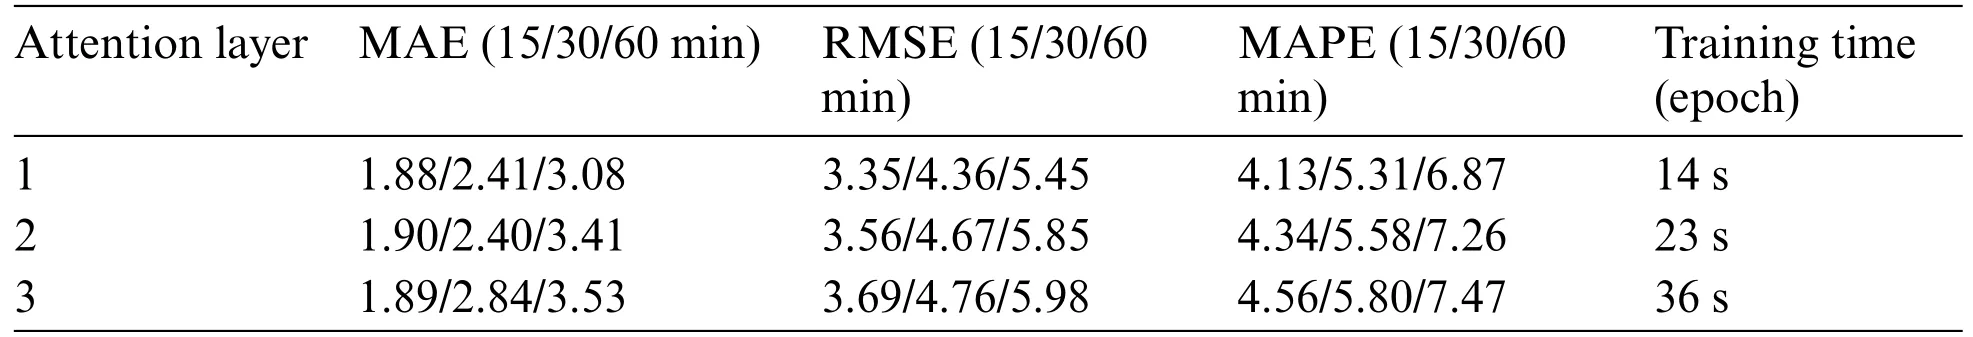
Table 3:Effect of different attention layers on the prediction performance of the Pe MSD(M)dataset
5.7 Computational Complexity Analysis
On the PEMS-BAY dataset,the number of parameters,training time,and testing time of STGCN,STTN,and proposed S-GNN were further compared.In Table 4,the experimental findings are displayed.The S-GNN suggested in this paper has faster training and testing times than STTN since STTN stacks numerous spatiotemporal converters to speed up calculation.In contrast to STGCN,our training and testing periods are a little bit longer.This is as a result of the addition of an attention module,which increases the network’s classification accuracy.Additionally,due to the increase in parameters brought on by the usage of the attention module and residual connectivity,the number of parameters in our network is higher than that of STGCN and STTN.
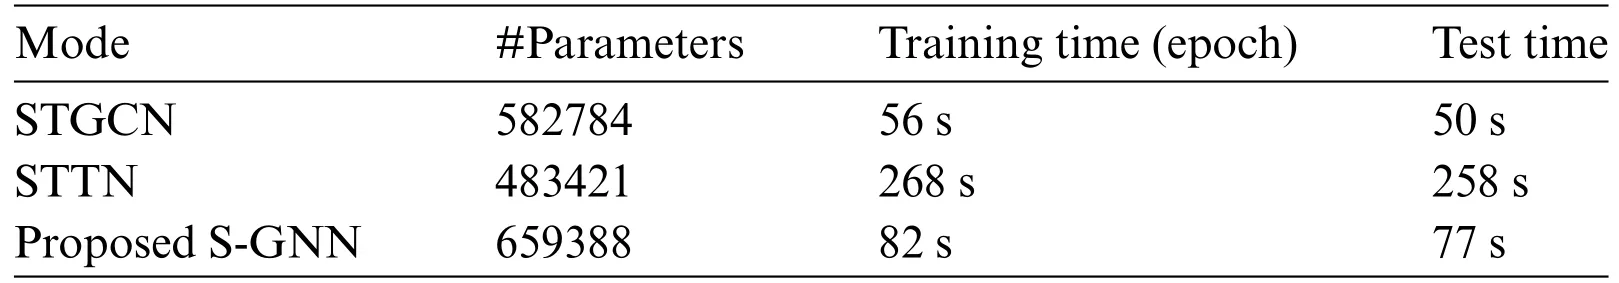
Table 4: Computational complexity of the PEMS-BAY dataset
6 Conclusion
This paper introduced an efficient approach for addressing the challenges of accurate traffic prediction by proposing the Spatiotemporal Graph Neural Network (S-GNN) model.The complex and non-linear spatiotemporal correlations in traffic data posed significant hurdles to conventional prediction methods.S-GNN model was designed to capture both short-term and long-term traffic patterns to achieve better performance compared to existing statistical models and state-of-the-art deep learning models.The model’s architecture contained temporal and spatial modules that effectively processed multiple traffic data inputs.The temporal module utilized one-dimensional convolutions,allowing for efficient time-dependent feature aggregation.Meanwhile,the spatial module employed the Graph Attention Network(GAT)to capture intricate global spatial relationships within the road network.Extensive experiments were conducted on real-world datasets,PeMSD7(M)and PEMS-BAY,to validate the efficacy of the proposed S-GNN model.The model demonstrated superior predictive accuracy,especially in long-term prediction tasks,effectively surpassing various baseline models.The results highlighted S-GNN’s capability to handle the intricacies of spatiotemporal traffic data and its potential contribution to traffic planning,management,and urban development.Furthermore,the research analyzed critical aspects of the proposed S-GNN model,encompassing the influence of attentional layers and computational complexity.The findings revealed that a single attention layer yielded optimal results,and S-GNN’s computational efficiency was on par with relevant state-of-theart models.When contrasted with the control model,S-GNN demonstrates a noteworthy reduction in RMSE by approximately 0.571 to 9.288,and in MAE(Mean Absolute Error)by around 0.314 to 7.678.This assertion is reinforced by the outcomes of experiments conducted on two authentic datasets,Pe MSD7(M)and PEMS-BAY.Future work in this area will be directed towards further optimizing the network architecture,streamlining computational complexity,and enhancing the overall performance of traffic forecasting models.The goal is to refine S-GNN by fine-tuning its parameters,exploring novel attention mechanisms,and investigating advanced techniques to efficiently handle larger datasets.Additionally,efforts will be concentrated on reducing computational complexity without compromising predictive accuracy,thereby making the model more practical for real-time applications.Additionally,the future work could explore alternative architectural choices by incorporating more complex temporal modeling techniques,to address the specific challenges associated with very long-term traffic prediction.
Acknowledgement:Thanks to our tutors and researchers for their assistance and guidance.
Funding Statement:This thesis was supported by Science and Technology Plan Project of Zhejiang Provincial Department of Transportation “Research and System Development of Highway Asset Digitalization Technology in Use Based on High-Precision Map”(Project Number:202203);in part by Science and Technology Plan Project of Zhejiang Provincial Department of Transportation:Research and Demonstration Application of Key Technologies for Precise Sensing of Expressway Thrown Objects(No.202204).
Author Contributions:Study conception and design: Ming Luo,Huili Dou;data collection: Ning Zheng;analysis and interpretation of results: Ming Luo,Huili Dou,Ning Zheng;draft manuscript preparation:Huili Dou,Ning Zheng.All authors reviewed the results and approved the final version of the manuscript.
Availability of Data and Materials:The experimental data used to support the findings of this study are available from the corresponding author upon request.
Conflicts of Interest:The authors declare that they have no conflicts of interest to report regarding the present study.
杂志排行

Computers Materials&Continua的其它文章
- Fuzzing:Progress,Challenges,and Perspectives
- A Review of Lightweight Security and Privacy for Resource-Constrained IoT Devices
- Software Defect Prediction Method Based on Stable Learning
- Multi-Stream Temporally Enhanced Network for Video Salient Object Detection
- Facial Image-Based Autism Detection:A Comparative Study of Deep Neural Network Classifiers
- Deep Learning Approach for Hand Gesture Recognition:Applications in Deaf Communication and Healthcare