Weber Law Based Approach for Multi-Class Image Forgery Detection
2024-03-12ArslanAkramJavedRashidArfanJaffarFahimaHajjejWaseemIqbalandNadeemSarwar
Arslan Akram ,Javed Rashid ,Arfan Jaffar ,Fahima Hajjej ,Waseem Iqbal and Nadeem Sarwar
1Department of Computer Science,Superior University,Lahore,54000,Pakistan
2Information Technology Services,University of Okara,Okara,56300,Pakistan
3Departmet of Computer Science,MLC Lab,Okara,56300,Pakistan
4Department of CS&SE,International Islamic University,Islamabad,44000,Pakistan
5Department of Information Systems,College of Computer and Information Sciences,Princess Nourah bint Abdulrahman University,Riyadh,11671,Saudi Arabia
6Department of Software Engineering,Superior University,Lahore,54000,Pakistan
7Department of Computer Science,Bahria University,Lahore Campus,Lahore,54600,Pakistan
ABSTRACT Today’s forensic science introduces a new research area for digital image analysis for multimedia security.So,Image authentication issues have been raised due to the wide use of image manipulation software to obtain an illegitimate benefit or create misleading publicity by using tempered images.Exiting forgery detection methods can classify only one of the most widely used Copy-Move and splicing forgeries.However,an image can contain one or more types of forgeries.This study has proposed a hybrid method for classifying Copy-Move and splicing images using texture information of images in the spatial domain.Firstly,images are divided into equal blocks to get scale-invariant features.Weber law has been used for getting texture features,and finally,XGBOOST is used to classify both Copy-Move and splicing forgery.The proposed method classified three types of forgeries,i.e.,splicing,Copy-Move,and healthy.Benchmarked(CASIA 2.0,MICCF200)and RCMFD datasets are used for training and testing.On average,the proposed method achieved 97.3%accuracy on benchmarked datasets and 98.3%on RCMFD datasets by applying 10-fold cross-validation,which is far better than existing methods.
KEYWORDS Copy-Move and splicing;non-overlapping block division;texture features;weber law;spatial domain;xgboost
1 Introduction
Nowadays,digital imaging has become a widespread technology.Cameras that are present today are low-cost,and these have given a boost to digital imaging applications.It is essential to daily living for humans.Digital images are employed in daily newspapers,courtroom evidence,and medical diagnostics[1].The availability of low-cost image tempering tools has made it very easy to tamper with an image to gain an immoral advantage and present it as wrong evidence.The naked eye cannot notice the changes occurring in the image.Facts given in the shape of the digital image are not acceptable as authentic images without forensic analysis.The objects can be added or hidden from an original image to misguide the court.Hence,the authenticity of images is a fundamental issue these days,and the need for image forensic techniques is increasing rapidly.One picture is worth a thousand words regarding the information it conveys.It might be valid or altered.
Most research has focused on the forensic analysis of images.Many techniques are developed to detect two main tempering types:splicing and Copy-Move.Methods can be separated into two main categories:the active method[2]involves matching embedded information with extracted information,and the passive approach is used when embedded information is lost or deleted.The image is authentic or otherwise forged if the original information is compared with the extract.Capturing includes the addition of watermarks and signatures.These watermark signatures are matched to validate image authenticity.With the use of preprocessing techniques,watermarks can be regenerated.So,researchers are trying to find a robust algorithm or blind method to detect this type of forgery[3].
There are several techniques for locating and detecting picture fraud,but they all have significant flaws.Information in an image is based on its objects’or edge that are formulated as boundaries of objects[4].Texture information is the most crucial information in a picture that should be examined for image validation,detection,and localization of Copy-Move forgeries[5].Image contains a different type of extra information that can be removed using different preprocessing of an image for a better understanding of image texture[2].Preprocessing includes image type conversion,compression,block division,etc.Image can be divided as blocks,so any descriptor for an image is applied to all possible parts of an image [6].Most image descriptors are based on binary patterns,which cannot work in changes like scaling and intensity level of an image.So,texture or edge-based descriptors are more suitable than them.
Advances in computerized methods have been made possible by developments in Computer Vision(CV),Machine Learning(ML),and Artificial Intelligence(AI),which have made it possible to precisely and precisely used in agriculture[7,8],smart cities[9],skin cancer[10,11],facial identification[12,13],image splicing [14] and forgery detection [15] in images.In 10 years,ML and artificial intelligence developments have accomplished an enormous interest in the openness of a few highvelocity figuring gadgets and processors that have further developed the handling time,unwavering quality,and precision of the outcomes/yield got.A DCT-based approach is used to find co-efficient based patches for similarity finding while exploiting“Copy-Move”forgery.However,Discrete Cosine Transformation (DCT) extracts unnecessary false information during detection [16].This type of information which is the outlier for the technique can be removed using the Principle Component Analysis(PCA) kernel to decrease the width of features extracted for matching[17].Weber law and local binary patterns are widely used techniques for image description.Image description denotes extracting vital features from an image[18].These features can be collected by using different statistical formulas and frequency domain environments[4].The image description process returns the statistical features of an image.Machine learning algorithms are used to develop a learned model to evaluate or simulate the image detection process.Different machine learning algorithms like Extreme Learning Machine (ELM),Support Vector Machine (SVM),and K Nearest Neighbor [19] can be used for learning machines to understand the class or type of an image as Copy-Move,spliced,or authentic.ELM stands for extreme learning machine based on binary classification most suited for two classes,authentic or forged.ELM has two types of kernels for the learning process one is regression,and the other is classification[20].SVM is also a binary classifier having two types of learning kernels linear and RBF kernel.SVM is the most widely used learning algorithm for two-class and is also used for multi-class classification in RBF kernel[19].K-Means is a clustering algorithm used for modeling or learning from features of any database.
Many studies have also used machine learning to classify forged images.However,it is concluded that these approaches need to be revised compared to traditional inspection methods that rely on image processing.First,no universally accepted dataset for studying splicing and Copy-Move is available to the public.Due to a lack of Copy-Move images,the authors substituted their own.While splicing and Copy-Move datasets are available,the number of images for Copy-Move is significantly lower than that for splicing,leading to class imbalance.In addition,there are no datasets that include both forgeries.Hence,it is decided that both forgeries need to share the same dataset.Secondly,existing methods for forgery detection focus on the classification of a single type of forgery,either splicing or Copy-Move.Thirdly,images depend on size,dimension,and type while analyzing them.Information embedded in images depends upon these three factors,which should have been considered in previous studies.
To address these issues,a scale-invariant method is proposed to classify both types of forgeries with images of any size,type,and dimension.This research has developed a new dataset for Copy-Move forgery consisting of 1477 images.The dataset is created by forging images using various cameras and editing software.This research then provided a system for classifying Copy-Move and splicing forgery based on Weber’s law and XGBOOST [21].CASIA 2.0 [22],MICCF2000 [23],and a usercollected dataset are used in the proposed method to categorize both forgeries.It consists of significant sections:the preprocessing phase,where images from different databases having different types,sizes,and dimensions are fed and divided into non-overlapping blocks;features from blocks of images are extracted and concatenated to form feature vectors.Finally,Features are provided to XGBOOST to classify them,and a model is designed to be used by image forensic experts.
Some crucial findings from the study are as follows:
1.Although Copy-Move datasets are significantly less common than splicing forgery datasets,a dataset for Copy-Move forgery(RCMFD).
2.Weber’s rule extracts feature from an image’s texture,and XGBOOST classifies images into one of three categories—Copy-Move,spliced,or authentic.
3.A technique is scale-invariant if it performs consistently across different image sizes.Therefore,images with varying sizes,dimensions,and types are used to test the scale invariance of the intended technique.
The other sections of this article have followed this order:Section 2 describes the related work for Copy-Move and splicing forgery detection techniques.Section 3 describes the stages of the proposed methodology and briefly explains every step,like preprocessing,feature extraction,and classification.In this section,databases that are being used for experiments are also described.Section 4 presents an experimental setup and results in discussions for the proposed architecture.It offers tables and figures related to results calculated using the proposed architecture.At last,Section 5 provides conclusions and future directions for this study.
2 Literature Review
Some researches on Copy-Move and splicing forgery classification has been published,but the methodology employed has primarily been limited to identifying a single forgery type from a single image.Shilpa et al.[16]have recommended a unique method to identify Copy-Move tempering.The technique recognizes Copy-Move forgery using the image transformation in the frequency domain from the spatial domain using DCT,and the feature dimension is compressed using SVD.The method produced effective results and was suited for most post-processing procedures,including noise,geometric modification,and compression.Khurshid et al.[24]conducted different experiments on image forgery detection and Copy-Move localization.The research focused on analyzing texture features in an image that supports object edges in an image.DRLBP(discriminative robust local binary patterns) LBP-based algorithm was used for image description,and DRLBP features were given to SVM(Support vector machine)to create a learned model.COMFORD v.0,CASIA 1.0,CASIA 2.0,CASIA TIDE,DVMM,and Columbia were used for the performance evaluation of the proposed description algorithm.
Suresh et al.[5]detected Copy-Move forgery using changes in color and texture information of an image.The firefly algorithm worked well to find a relationship between color fusion and the texture of tempered regions in an image.OWCTF was used for image description,and SVM was used for classifying an image as original or Copy-Move.The proposed technique performed 97% accurately on CASIA 1.0 and ComFodv.0 image database applied for experimentation.Suresh et al.[25] used texture information to detect Copy-Move forgery.Texture information was obtained by isolating an image into overlapping blocks and finding differential excitation of image blocks.The technique was appropriately evaluated and performed 99%of the best performance.
Vega et al.[26] suggested a method for copy-and-paste forgery detection using the discrete cosine transform.They employed the CASIA TIDE v2.0,CMFD GRIP,and CoMoFoD datasets for their experimental work.They collected the transfer vectors and categorized them using DCT.They classified the forged image using a tolerance threshold.Park et al.[27]used the Scale Invariant Feature Transform to extract the key points and their descriptors(SIFT)in their suggested method.They also carried out an improvised matching procedure that may detect several forgeries.The approach resisted picture addition of white Gaussian noise and geometric distortion.Yao et al.[28]created an adequate detector to identify false images.The first design was a reliable CNN framework that extracted features automatically and adaptively using the developed continuous high-pass filter,after which they provided an RFM model to improve the effectiveness of the tamper recognition solution.Bappy et al.[29] introduced a novel technique using geographical contexts and frequencydomain information to identify image manipulations.Encoder-decoder networks and Long Short-Term Memory (LSTM) cells were used to separate tampered from untampered areas.They also employed resampling features to capture artifacts like up/down sampling,JPEG quality loss,shearing,and rotation.
Rodriguez-Ortega et al.[30]provided two DL approaches:a TL model approach and a convention framework approach.The F1-score,precision,and recall were utilized to evaluate the effects of the network’s depth.Eight distinct databases can also be employed to overcome the generalization issue.Abdalla et al.[31] used a fusion processing approach that combines an adversarial strategy and a convolution method to investigate Copy-Move counterfeit discoveries.There were four databases used.According to the result,the discriminator counterfeit detection and DL-CNN models have a significantly greater recognition accuracy of 95%than other models.
Machine learning has also been used in numerous research to identify fake images.When contrasted to more conventional inspection methods based on image processing,it is determined that these methods need to be updated.There is currently no publicly accessible dataset for investigating splicing and Copy-Move.Since no suitable Copy-Move pictures were available,the writers provided their own.While splicing and Copy-Move datasets exist,Copy-Move suffers from class imbalance due to a substantially smaller number of images.Also,there are no databases that contain both fakes.This leads to the conclusion that both forgeries should use the same data source.Second,current forgery detection systems only classify specific forging techniques,such as splicing or Copy-Move.Finally,the analysis of images is contingent on their size,dimensions,and type.These three aspects should have been considered in earlier studies,as they all affect the information in images.
3 Material and Methods
Several machine and deep learning-based approaches have been presented for detecting and classifying fake images.Some are successful.Unfortunately,these approaches typically have the problem of needing to be trained on a large dataset.This research used machine learning to suggest a manuscript for classifying forged images.A few benchmarked datasets and a Real Copy-Move Forgery Dataset (RCMFD) Copy-Move forgery dataset are used during training.In this study,we offer a machine-learning technique to detect and categorize fake images.There are three stages to the suggested procedure.The first step is to cut the image into uniform,non-overlapping squares.The second step is applying Weber’s law to extract texture features.We use Weber Local Descriptor(WLD),a texture descriptor,to pull features from images.The primary goal of WLD is to detect the presence of specific micro-patterns,such as edges.Possible advantages include improved edge detection,enhanced resistance to lighting and acoustic fluctuations,and a reduced risk of error.Even with much background noise,the WLD extractor’s edges accurately and obtain a robust texture feature.WLD is resistant to the effects of noise in an image because it lessens the impact of noise on individual image pixels.In the end,support vector machines are used to categorize image features.The proposed procedure’s flowchart is depicted in Fig.1.
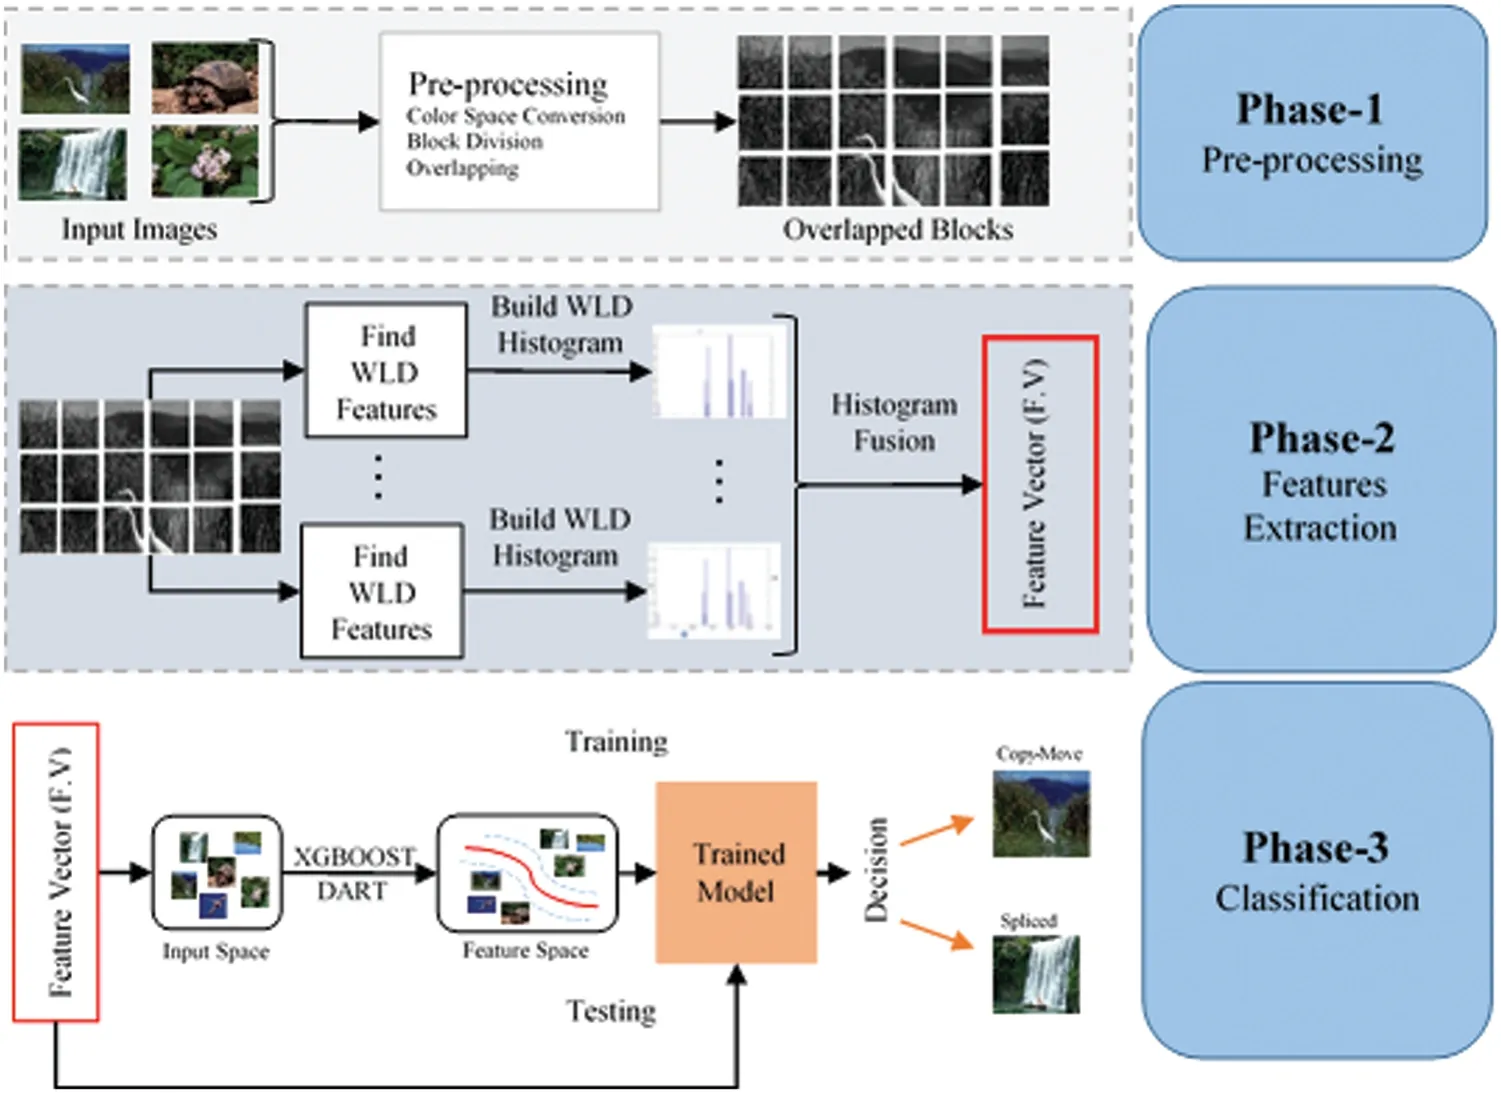
Figure 1:Proposed image forgery classification architecture
3.1 Datasets
The success of machine learning relies significantly on the availability of a high-quality dataset.The proposed technique is put through its pace on two benchmark datasets:CASIA 2.0,MICCF2000,and a developed dataset named RCMFD.Table 1 shows details of the datasets being used for experiments.
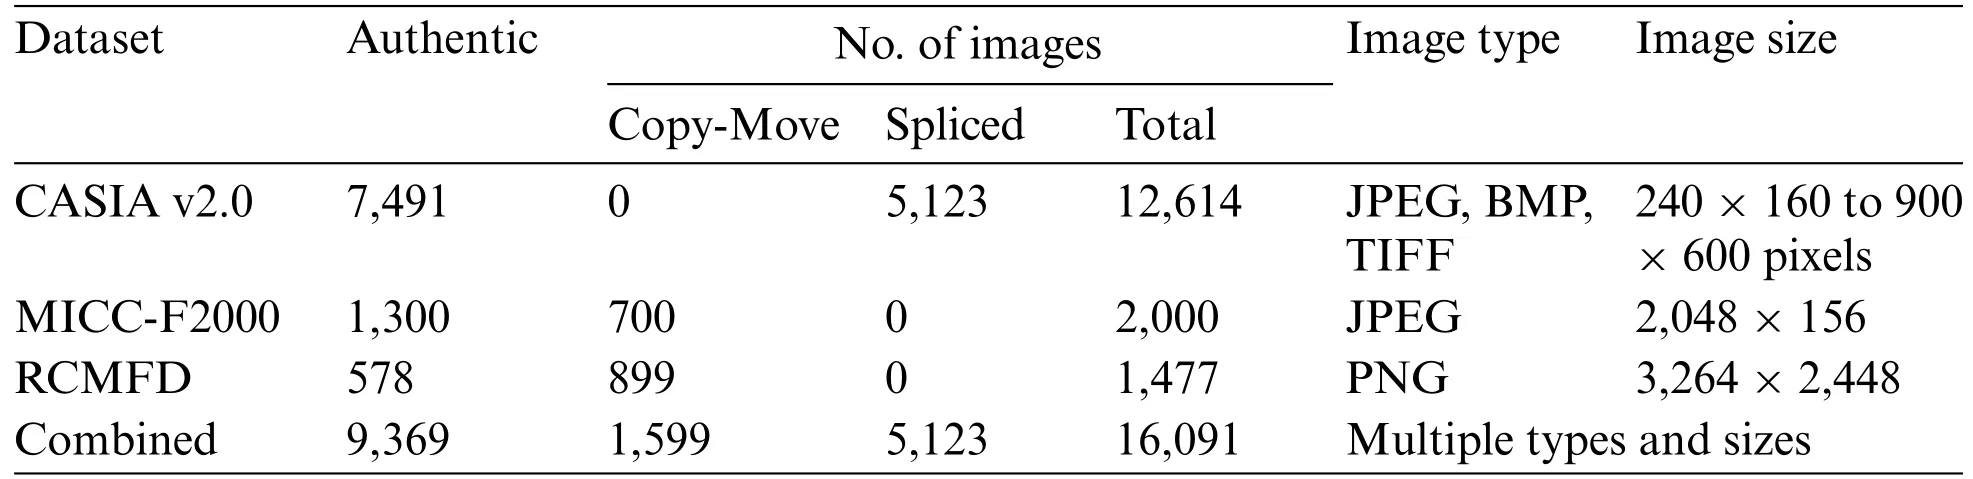
Table 1: Details of datasets used for experiments
3.1.1 Benchmarked Datasets
CASIA ITDE database V2.0 follows a similar structure to database V1.0 but with more features.There are 12,614 color images and two collections (authentic and tampered) [22].There are 7,200 original images in the first batch,while 5,123 were altered in the second.With database V2.0,developers now add blurring to the techniques used to manipulate the manipulated images.Images in V2.0 range in size from 320×240 pixels to 800×600 pixels,a change from V1.0.In V2.0,we analyzed JPEG images with varying Q factors and added some uncompressed image examples(BMP and TIFF)that were not present in V1.0.To account for illumination fluctuation when creating tampered images,developers gathered many indoor images for the legitimate set and generally classified their content into many categories,as in V1.0.Scene,animal,architecture,character,plant,article,nature,indoor,and texture comprise the original image set.After that,we make the altered image collection.The Columbia Photographic Imaging Center(MICC-2000)dataset[23].Fig.2 shows some sample images from databases used in the experiment.There are 14 ways that forgers can alter an image,including resizing it,flipping it,or applying a different filter.There are 1,300 authentic images,and 700 images have been altered,as shown in Table 1.

Figure 2:Examples of images from benchmarked databases
3.1.2 Real Copy-Move Forgery Dataset
A dataset of 1,477 images for Copy-Move forgeries was produced in this study.These images were created using a variety of cameras and editing programs,including Adobe Photoshop.Images that have been collected and altered are manually classified as authentic or Copy-Move.According to Table 1,the authentic class has 578 images,while the Copy-Move class has 899 images.To advance research in this area,this dataset is made available for use in upcoming studies.You can avail yourself of dataset upon request.In Fig.3,we see both genuine and fake examples.It is clear from comparing Fig.3’s authentic image of single sugarcane with the Copy-Move image of three sugarcanes that this is indeed the case.The human visual system cannot distinguish between a genuine and a fake image without the original present.

Figure 3:Examples of images from benchmarked databases
The datasets utilized in the experiments are described in full in Table 1 of the research above study.CASIA v2.0,MICC-F2000,RCMFD,and Combined are the four data sets included in the table.Only 7,491 of the 12,614 images in CASIA v2.0 are originals;the rest are Copy-Moves or splices.The sizes of these images range from 240×160 to 900×600,and they are in JPEG,BMP,and TIFF formats.Of the 2,000 images that make up MICC-F2000,only 1,300 are originals;the rest are Copy-Moves or splices.These images are 2048 pixels wide by 156 pixels high and are in the JPEG file type.Only 578 of the 1,477 images in RCMFD are original;899 are Copy-Moves,and none were spliced.These images are 3,264×2,448 pixels in size and are in PNG format.There are 16,091 images of various sizes and formats in the combined dataset,which comprises data from the three datasets above.The following table summarizes the image datasets that were considered for this study.All datasets utilized in this investigation were split into training and testing portions with respective ratios of 70%and 30%.With XGBOOST,training images are used to create a model,and testing images are used to assess the model and get knowledge from the trained model.
3.2 Preprocessing
Different color modes in digital image processing have slightly varied effects applied to them.Antiforgery programs may use several color models,including RGB and grayscale images.Nonetheless,the YCBCR color space is being utilized in this probe.Colors with different amounts of blue (CB),red(CR),and green(Y)are all represented by the YCBCR color prototype(Y).As shown in Fig.1,the first step involves converting the image from RGB to YCBCR color format.In Fig.1,we see an illustration of this process at work,where an RGB image is converted to YCBCR.The chrominance of an image is expressed by three different components:Y,CB,and CR.Y represents the brightness of the image.A Python script is used to partition the CB and CR channel images into equal blocks once the YCBCR channels have been collected.This paves the way for a finer level of image analysis,which in turn aids in locating probable sites of tampering or fabrication.
3.3 Feature Extraction
When the prior inducement intensity is changed,WLD is a robust native descriptor since it is based on the social responsiveness of the sample image.WLD is used for feature extraction and is a texture descriptor.Its robustness to light brightness and noise change is among its many advantages,making it suitable for applications like edge detection.Even in the face of significant noise,WLD can recover edges in their whole,and the resulting texture feature is quite robust.WLD aggressively combats picture noise by reducing the impact of the noise on individual image pixels.WLD is a descriptor proved below for feature extraction determination.WLD centered on Weber’s law has two components:differential excitation(D)and orientation(Φ).Ernst Weber observed that the proportion of the rising threshold to the concentration of contextual is constant.Weber’s law formula is:
HereΔx is the increment limit(clear difference for inequity),x submits early stimulus intensity,and C facts to ratio on the left-hand side of the equation persist despite aberrations in the x term.Differential excitation(D)[31]is deployed to alter the intensity of every pixel value of the image.The D(pc)concerning a pixel pc is computed as under:
Step 1: Calculate the difference between pixel “pc”and its neighboring pixels through the filter(f00).
Here“pi”is refed as“ith”neighbors of pixel“pc”and“N”are several neighboring pixels(i=0,1,...,N-1).
Step 2:Compute several differences of present pixel intensity under the associated outcome of the filter(f00)and(f01).
Step 3:Compute the arctangent function onJratio
Thus,the difference between excitation D(pc)of the current point of(pc)
WLD orientation module is the gradient orientation[31],and it is computed as under:Step 1:Calculate the Φ(pc)
3.4 Classification
We rely on previous studies to guide our classification approach because feature extraction is more vital to our work than designing a superior classifier.Our investigation showed that nonlinear XGBOOST is commonly used for image classification and that high-quality detection results have been achieved using this method.Our top pick is XGBOOST because of this.It is making use of the DART booster.The classification process consists of several steps,including training and testing.In Fig.1,the system’s workflow is dissected into its parts.The WLD features of the image databases are utilized throughout the training process of the classifier.A classification model is trained with XGBOOST following feature extraction with WLD.Nine hundred twenty features were extracted from all the images in the experimental datasets to be used as training data.The 10-fold cross-validation method is used for this purpose.For this evaluation,data was divided 70%/30%between training and testing.The suggested model is thriving across all experimental datasets used to test it.
3.5 Experimental Setup
The experimental setup for detecting image forgery using texture features and XGBOOST was implemented in Python.Required packages were installed,including NumPy,OpenCV,Scikit-learn,and XGBOOST.The setup was optimized by fine-tuning extraction parameters and testing various machine-learning algorithms to improve accuracy.Python 3.11 was used for image preprocessing and feature extraction,and XGBOOST was used for classification.The dataset was divided into equal-sized blocks,and the Weber Local Descriptor was used to extract texture features,creating a feature vector for each block.An 80/20 split was used for the training and testing sets,respectively.The XGBOOST classifier was trained on the training set,and the testing set was used to evaluate performance metrics such as accuracy,precision,recall,and F1-score.All experiments used a Jupyter Notebook powered by a Dell I7 7th generation processor with 16 GB memory and 1 TB storage.
3.6 Evaluation Measures
Many distinct measures,such as testing accuracy,precision,recall,F1-score,and AUC,are used to evaluate the classification process.When considering the proposed method,the assessment parameter utilized most of the time is accurate.So,in this study,the proposed approach is quantitatively evaluated using the following three parameters:
whereAccuracyis the total number of correct guesses divided by the total number of correct forecasts,then multiplied by 100 to get a percentage,the percentage of correctly identified samples in the true positive rate is determined using.
In this model,true positive(TP)represents the number of diseases that were correctly recognized,false positive (FP) represents the number of conditions that were misclassified,and false negative represents the number of diseases that should have been discovered but were not(FN).The F1-score is a popular measure for accuracy and recall.
Cross-validation(CV)is a resampling methodology utilized to assess machine learning models in a constricted dataset while safeguarding the prediction models against overfitting.On the other hand,K-Fold CV embodies a technique where the given dataset is spliced into K segments or folds,where each fold serves as a testing set at some point.Consider the case of 10-fold cross-validation(K=10),where the dataset is separated into ten folds,with the first fold testing the model in the first iteration and the remaining folds trained on the model.In the second iteration,the second fold serves as the testing set,whereas the rest function as the training set.This cyclic process repeats until each ten-fold is utilized as the testing set.
Mean absolute error(MAE)is a common metric used to evaluate the performance of a machine learning model.It measures the average absolute difference between predicted and actual values.In cross-validation,MAE is calculated by taking the average absolute differences between the predicted and actual values across all folds.The formula for MAE in cross-validation is:
The mean absolute error is calculated by dividing the fundamental difference between the observed and projected values by dividing the total by the total number of samples (k).Where k is the total number of iterations,yi represents the observed value for the ith sample,and yirepresents the expected value for the ith sample.The average absolute error(MAE)is a helpful indicator since it measures the model’s accuracy without considering the nature of the mistakes.
4 Results and Analysis
In this section,we provide the findings of an extensive set of experiments designed to evaluate the effectiveness of the proposed image forgery classification approach.Results from various performance evaluation instruments were used.We employed the assessment strategy described in Subsection 3.6 to train and evaluate models.These areas were the focus of the experiments:
These areas were the focus of the experiments:
1.The effectiveness of the proposed framework is measured by XGBOOST for two-class classification across benchmarked datasets individually.
2.For two-class classification on the RCMFD dataset,XGBOOST is used to evaluate the efficacy of the suggested framework.
3.Many assessment metrics were used to rate the proposed framework on the combined dataset for Copy-Move,splicing,and authentic.
4.Analysis of how the proposed method stacks up against other,more advanced approaches.
4.1 Evaluation of Proposed Method on Benchmarked Datasets
Table 2 shows that the suggested binary classification approach beat all datasets tested.Table 2 shows CASIA V2.0 10-fold cross-validation results using fold 1 to 10 metrics to evaluate model performance.The first class has actual images and the second spliced images.F1-score values ranged from 0.93 to 0.97,showing substantial precision and recall for both classes.Accuracy was 94%–97%,and AUC was 0.94–0.97.The model needs a balanced amount of samples for both classes to detect spliced examples with lower scores.The model’s accuracy and AUC were high,suggesting it could detect forensic image splicing effectively.
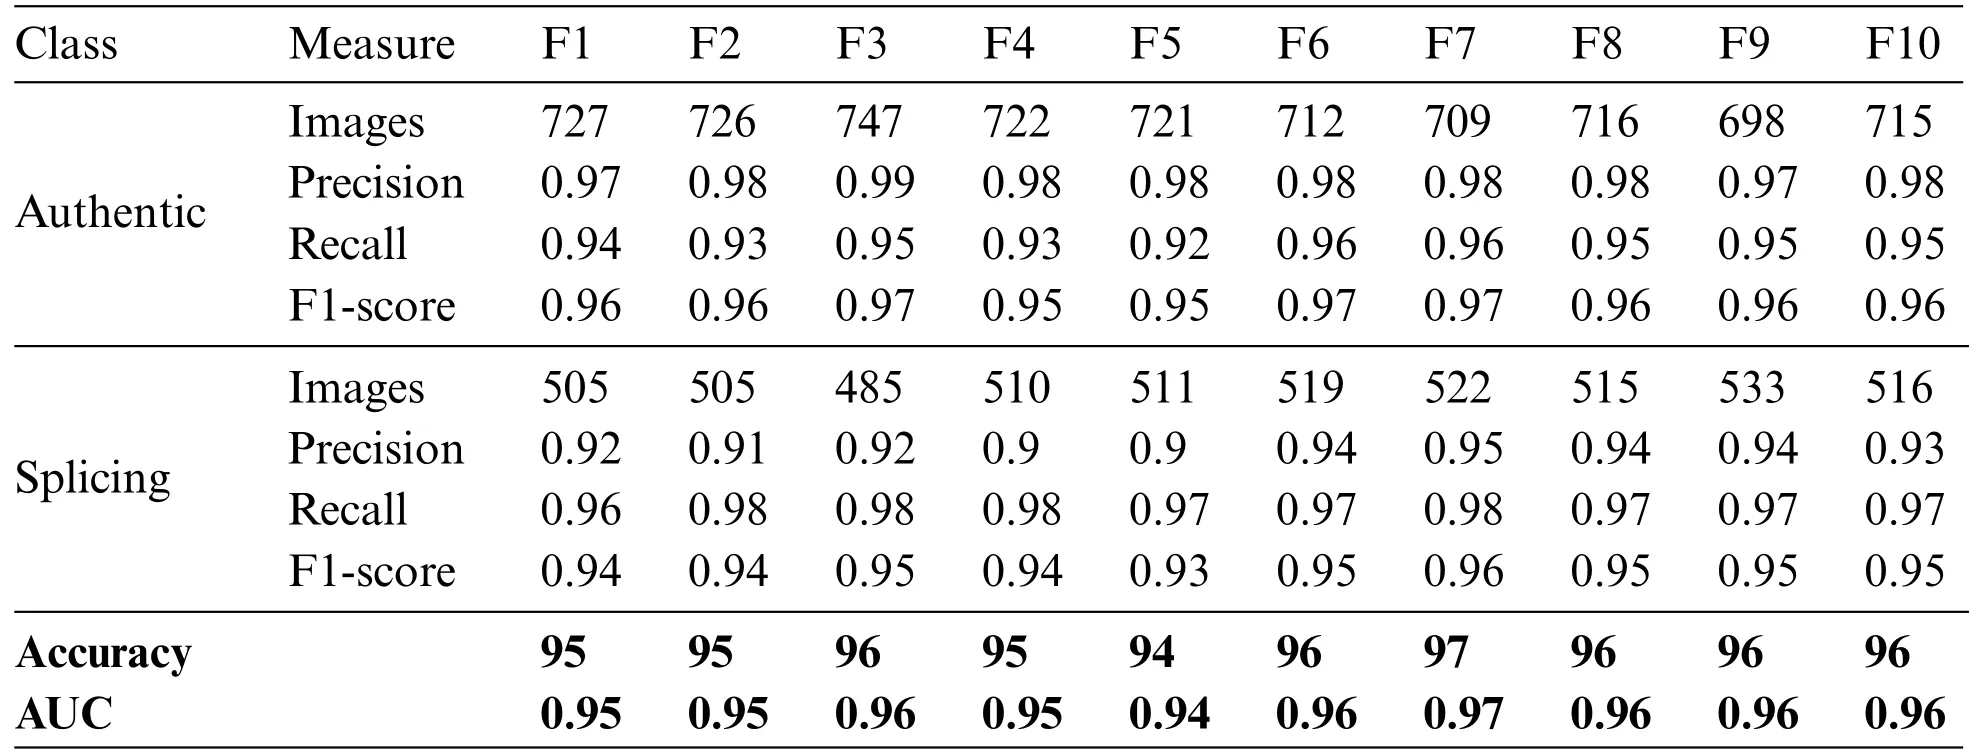
Table 2: 10-fold cross-validation results on CASIA v2.0
Table 3 displays accurate and spliced picture categorization performance.The model accurately identifies legitimate images with 97%accuracy,a precision of 0.98,a recall of 0.96,and an F1-score of 0.97.The model has an accuracy of 0.95,precision of 0.98,recall of 0.96,and F1-score of 0.97 for the splicing class,suggesting it can recognize spliced images.The model has strong F1-scores and accuracy in both classes.These conclusions are based on a specific dataset and evaluation approach and may not apply to other datasets or real-world settings.Fig.4 shows the model’s misclassifications in blue boxes in the confusion matrix of testing results.Other boxes show the number of valid class predictions.
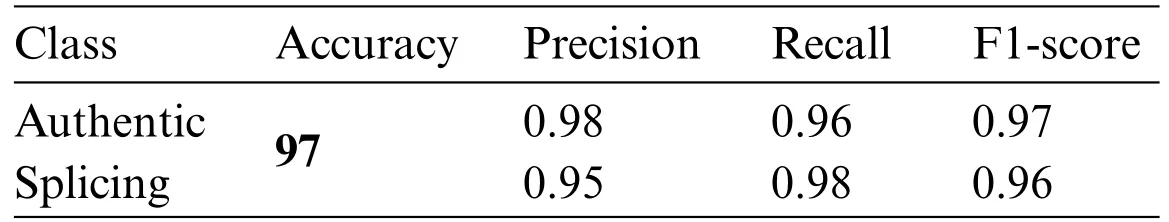
Table 3: Testing results on CASIA v2.0
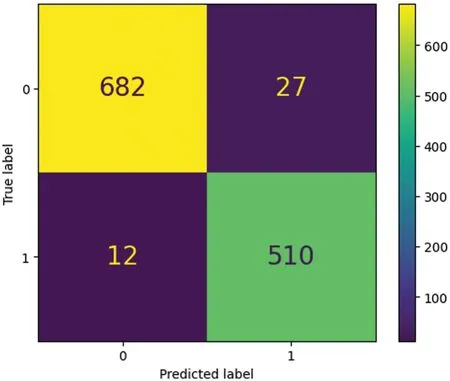
Figure 4:Confusion matrix of testing results on CASIA v2.0
Fig.5 depicts training losses and accuracy.Losses dropped with each iteration as the number of folds increased while accuracy rose.Accuracy in training and testing(the number of times features were correctly extracted)is shown in left figure and training and validation loss is shown in right figure.The opposing view explained the improper feature selection in training data and an incorrect prediction of class labels in testing data.

Figure 5:Cross-validation accuracy and loss of proposed method on CASIA v2.0
Table 4 shows the suggested method’s assessment metrics for authentic image and Copy-Move detection using the MICC-F2000 dataset.The model had good F1-scores for authentic picture detection and moderate precision for Copy-Move detection.Table 4 shows machine learning-based image forgery detection metrics for authentic and Copy-Move images.The authentic class has 128–147 pictures,and the Copy-Move class is 53–83.F1–F10 denote test sets.The model’s precision values range from 0.98 to 1,indicating that most authentic images are correct.The model can successfully identify legitimate images because recall values range from 0.93 to 0.99.The harmonic mean of precision and recall is high for all test sets,showing good picture authentication performance.The F1-score values vary from 0.97 to 0.99.The model accurately predicts positive cases for the Copy-Move class,with accuracy values from 0.84 to 0.97 and recall values from 0.96 to 1.The model can accurately recognize Copy-Move images with F1-score values from 0.91 to 0.98.The model can accurately distinguish between the two groups with ACC values from 95% to 98% and AUC values from 0.95 to 0.98.The table shows the model can detect authentic and Copy-Move images with good precision,recall,and F1-score values.
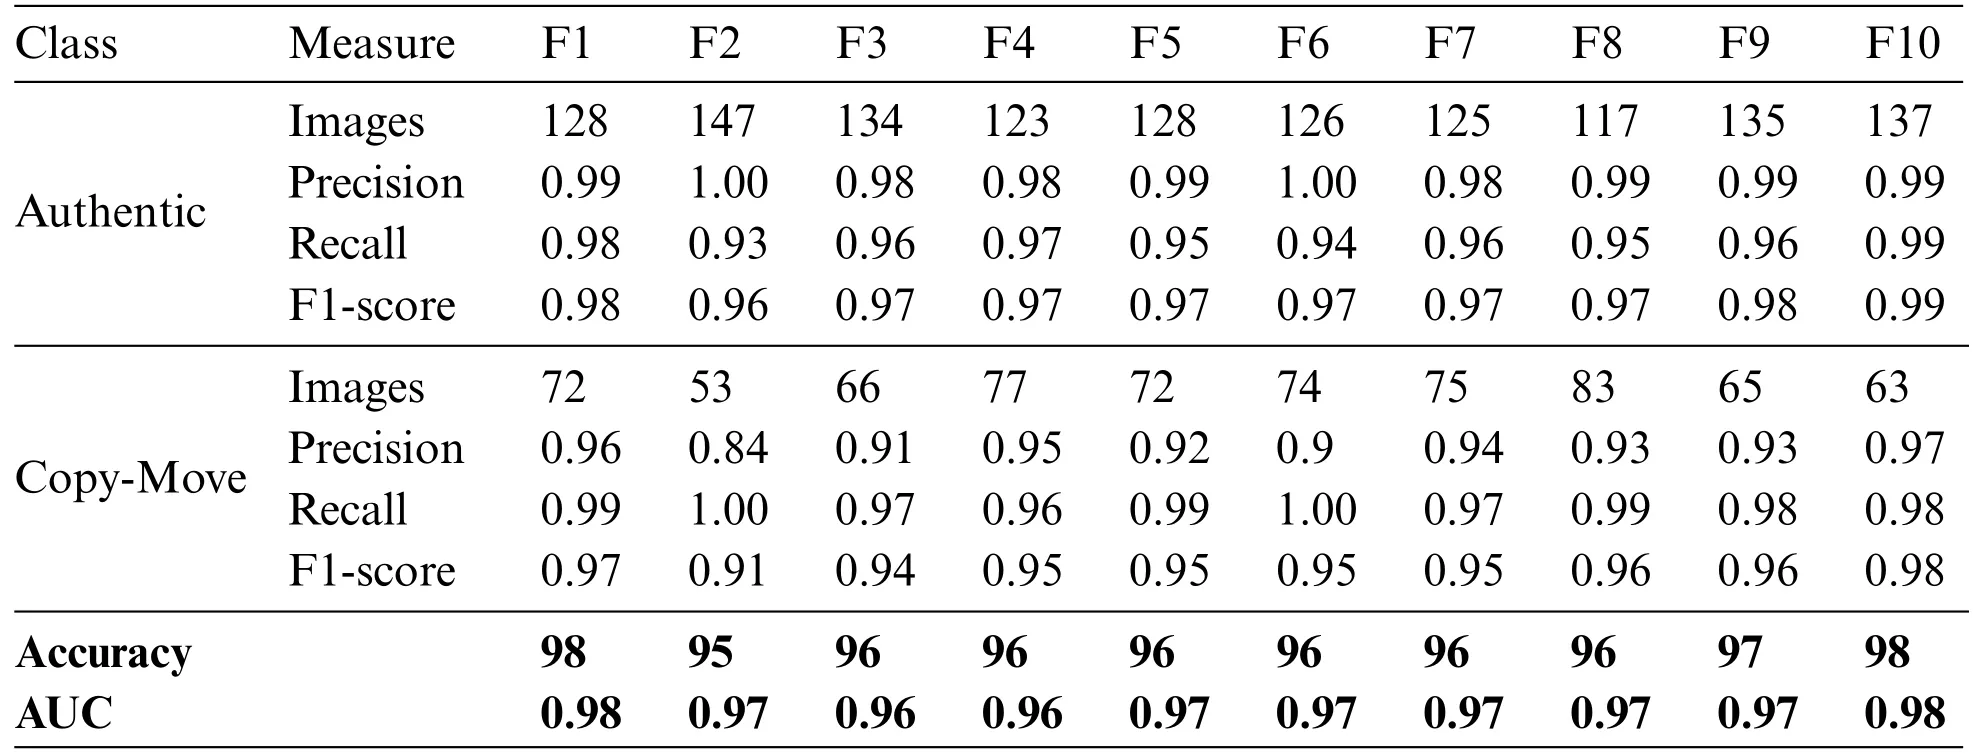
Table 4: 10-fold cross-validation results on MICC-F2000
Table 5 shows image forgery classification model evaluation metrics from different datasets.The algorithm successfully classified 98% of legitimate images.The honest class has good precision and recall,indicating low false positive and high true positive rates.Copy-Move class precision and recall are poorer than authentic class.This shows that the model struggles to identify Copy-Move and authentic images,resulting in more excellent false positive and false negative rates.Classification models may be less than 100% accurate for numerous reasons.One factor is model training data quality.The model may misclassify occurrences if the dataset is adequate,correct,or biased.Complexity may be another cause.Complex categorization tasks require more apparent class distinctions.In such instances,100%precision may not be attainable,and some mistakes may be acceptable.The classification approach mentioned properly categorized 98%of dataset occurrences.2%of cases may have been misclassified.Fig.6.Blue boxes indicate how often the model misclassified the sample.The other boxes show the number of correct class predictions.
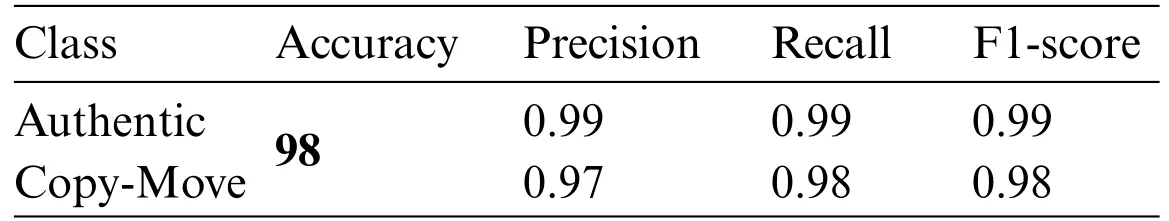
Table 5: Testing results on MICC-F2000
Fig.7 shows the training and validation accuracy with loss.Each fold enhanced accuracy and lowered losses.Each cycle improves accuracy,highlighting the necessity for continual model and data pretreatment modification to obtain the utmost accuracy.The figure on the right side shows feature extraction accuracy during training and testing.This alternative perspective illuminates the training data’s improper feature selection and testing data’s inaccurate class labels,which may have limited the model’s effectiveness.Fig.7 shows how selecting and preparing training and testing datasets optimize classification model performance.
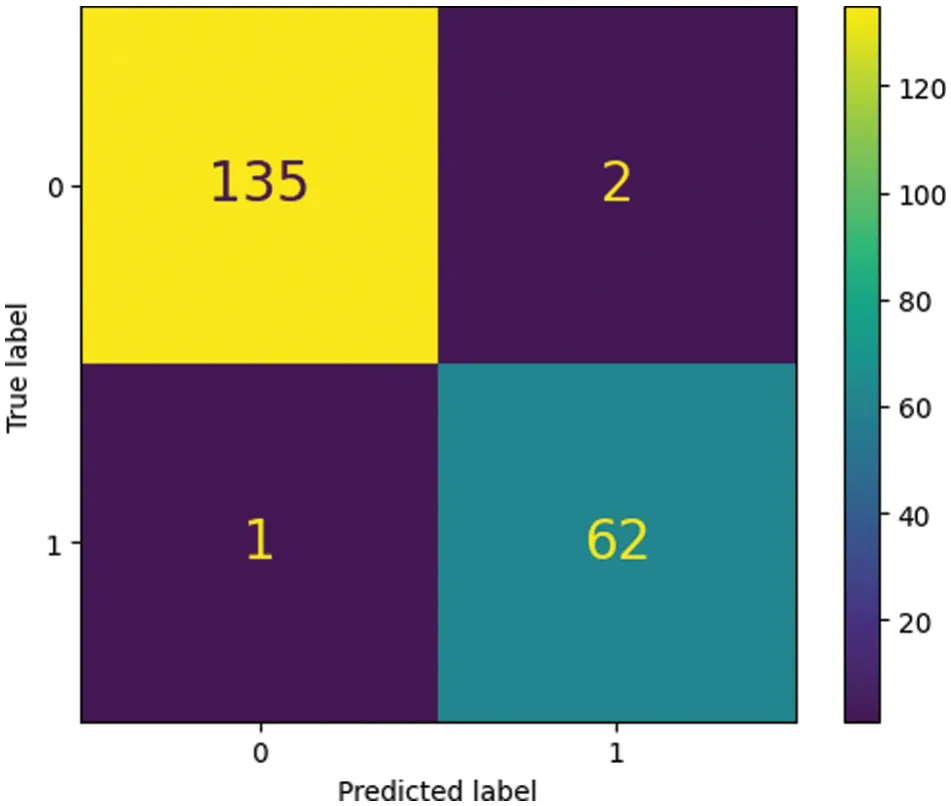
Figure 6:Confusion matrix of testing results on MICC-F200
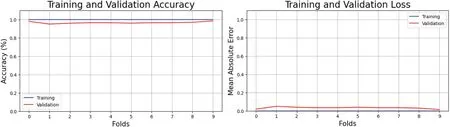
Figure 7:Cross-validation accuracy and loss of proposed method on MICC-F2000
4.2 Evaluation of Proposed Method on RCMFD
Table 6 shows the training model performance on numerous assessment parameters,demonstrating the strategy’s efficacy.The table provides XGBOOST cross-validation fold-wise results for Authentic and Copy-Move classes.The F1-score for the Authentic class ranges from 0.96 to 0.99 across folds,averaging 0.97.Precision is 0.94–1,and Recall is 0.94–0.98.Copy-Move class F1-scores vary from 0.97 to 0.99,averaging 0.98.Precision is 0.95–0.99,and Recall is 0.97–1.Both classes average 97%correctness.AUC is 0.95–0.99,averaging 0.97.The XGBOOST model has strong Precision,Recall,and F1-score in both classes.Performance varies among folds due to data dispersion or sample selection.The model may also need help distinguishing between classes based on the AUC values.Thus,tuning the model or adding features may increase performance.
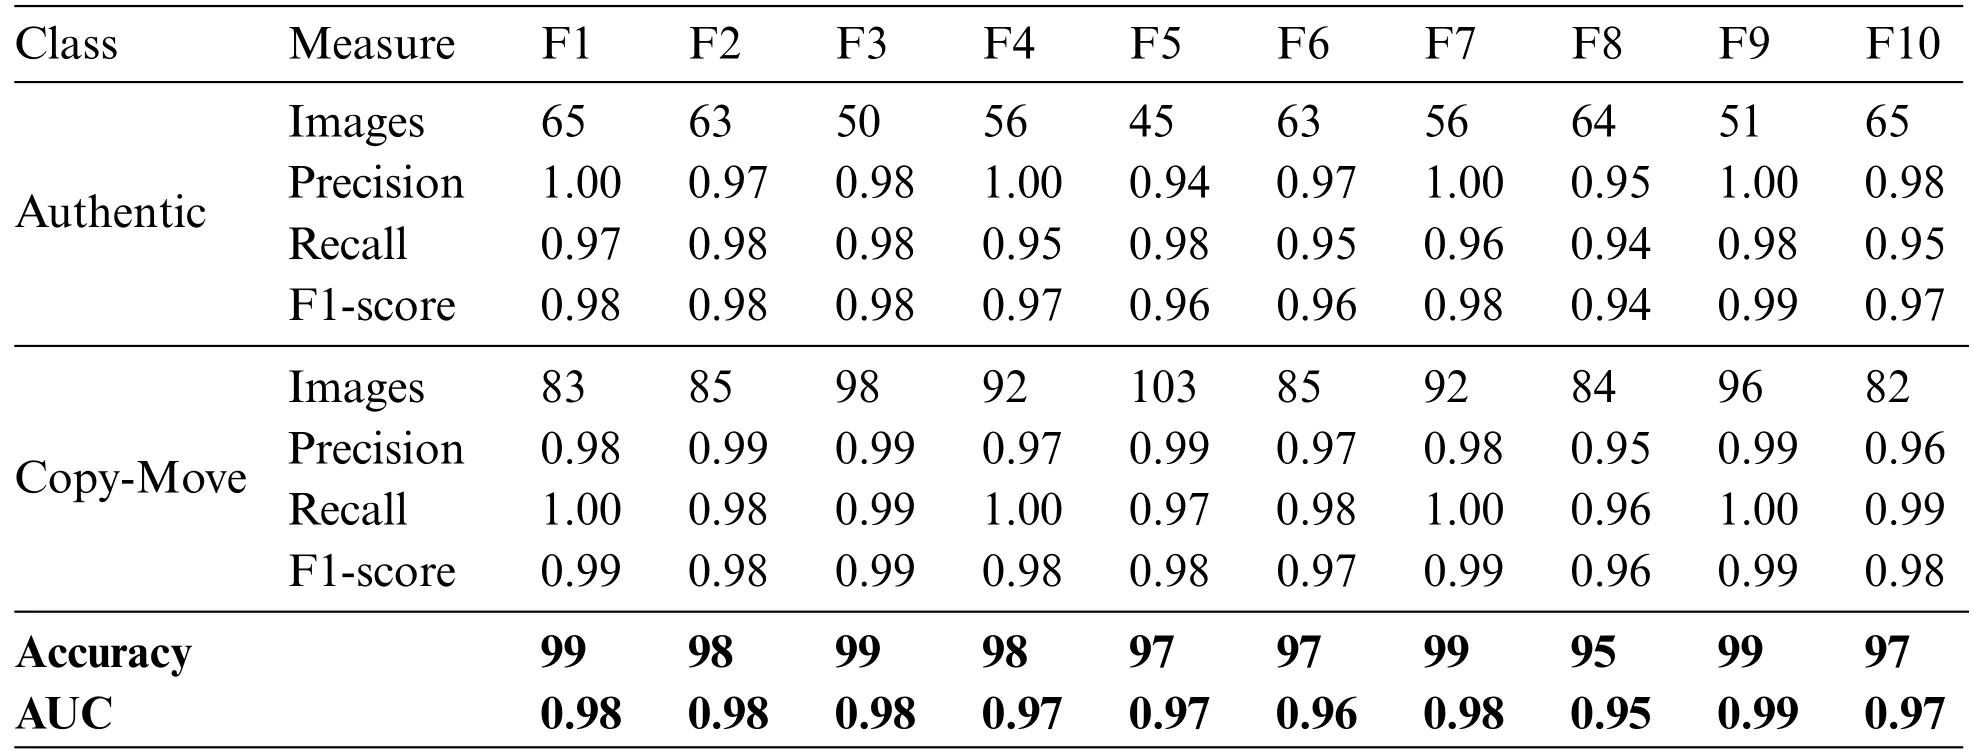
Table 6: 10-fold cross validation results on RCMFD
XGBOOST cross-validation showed that the model performed well in both classes with reasonable accuracy,precision,recall,and F1-score.The model predicted class labels for most test data with 99%accuracy for both categories.Both classes had 1 precision.Hence the model’s class label predictions were almost always true.Table 7 shows the model identified 98% of Authentic and 99% of Copy-Move class instances.Additionally,the confusion matrix of testing results shown in Fig.8 highlights the number of times the model incorrectly classified a sample in blue boxes.In contrast,the other boxes represent the number of times the correct class was predicted.

Table 7: Testing results on RCMFD
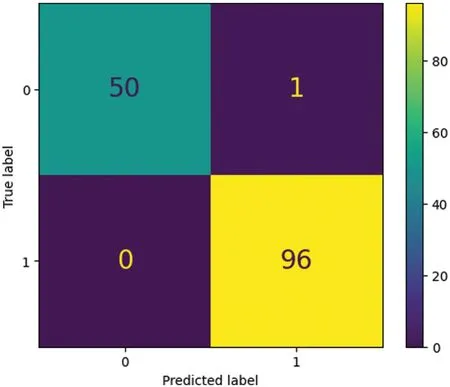
Figure 8:Confusion matrix of testing results on RCMFD
XGBOOST cross-validation produced the findings.A dataset with ten folds taught the model.The model predicts class labels effectively on training data.Fig.9 shows training accuracy loss.Fine-tuning the model and data preprocessing approaches for maximum accuracy reduces losses and increases accuracy with each repetition.The figure on the left shows training and testing accuracy,proving feature extraction.This view illuminates the model’s performance limits by revealing inaccurate class labels in the testing data and improper feature selection in the training data.Fig.9 emphasizes the importance of carefully selecting and preparing training and testing datasets to enhance classification model performance.
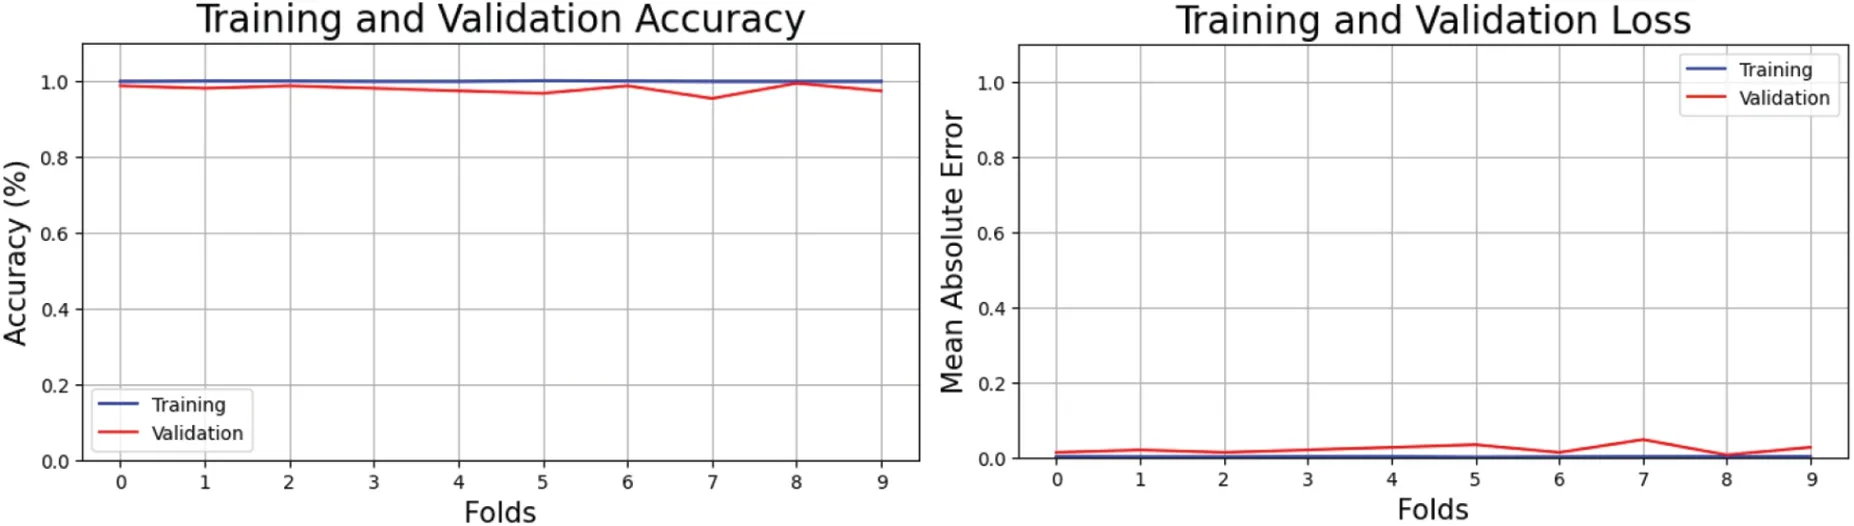
Figure 9:Cross-validation accuracy and loss of proposed method on RCMFD
4.3 Performance Evaluation of Proposed Method on Combined Dataset
Table 8 shows the proposed approach combined with dataset classification results.It shows four performance measures.Precision,recall,accuracy,and F1-score.Table 8 shows that XGBOOST’s cross-validation detects image alteration,notably genuine and Copy-Move types.These classes have F1-scores from 0.96 to 0.98,precision from 0.97 to 0.98,and recall from 0.93 to 0.96.All three categories have AUC values around 0.97 and accuracy from 95%to 96.6%.However,lower F1-scores and accuracy indicate splicing-type detection limits.XGBOOST may not identify splicing picture modification as well as other methods.The results show that XGBOOST can aid image forensics and alteration detection.Table 8 shows how XGBOOST detects picture modification.Explore different machine learning methods and methodologies that may better identify spliced picture alteration to overcome these constraints.Future research can expand this study’s dataset to increase accuracy and efficacy.
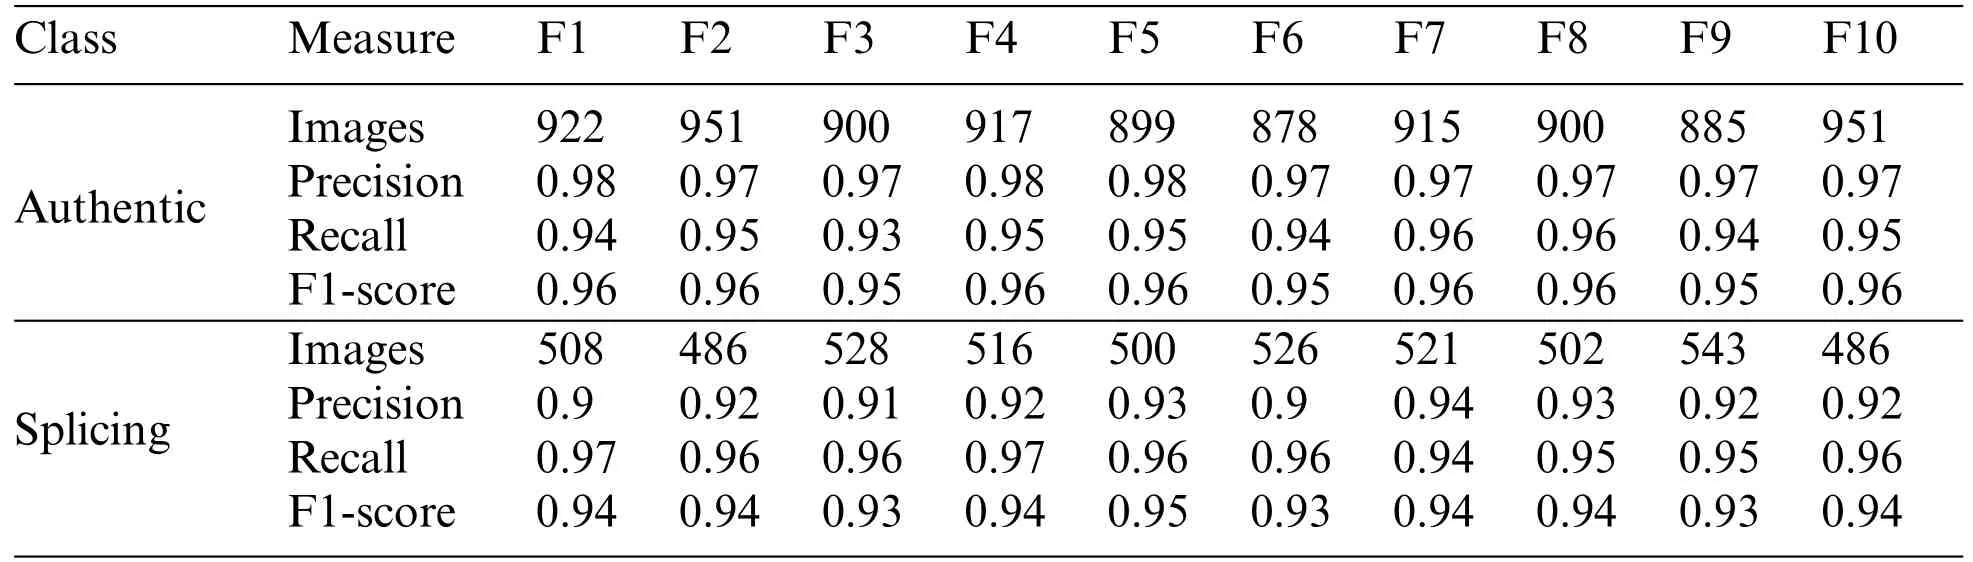
Table 8: 10-fold cross-validation results on the combined dataset
Table 9 cross-validates authentic,Copy-Move,and Splicing picture forgeries.Each class shows accuracy,precision,recall,and F1-score.The model identified 97%of authentic images.Copy-Move lessons were 95% accurate,and Splicing classes were 92%.Precision is the fraction of true positives among anticipated positives;recall is the fraction of actual positives.Authentic,Copy-Move,and Splicing precisions were 0.97,0.98,and 0.96.The class recall was 0.95,0.97,and 0.94.Class F1-scores were 0.96,0.97,and 0.95.XGBOOST detected all three image frauds.Dataset and training settings affect performance.The model’s real-world accuracy and reliability may need further testing.Fig.10 shows the confusion matrix of testing results,showing the number of times the model misclassified a sample in blue boxes.Other boxes show the number of valid class predictions.The confusion matrix helps enhance the model’s accuracy by revealing its performance.
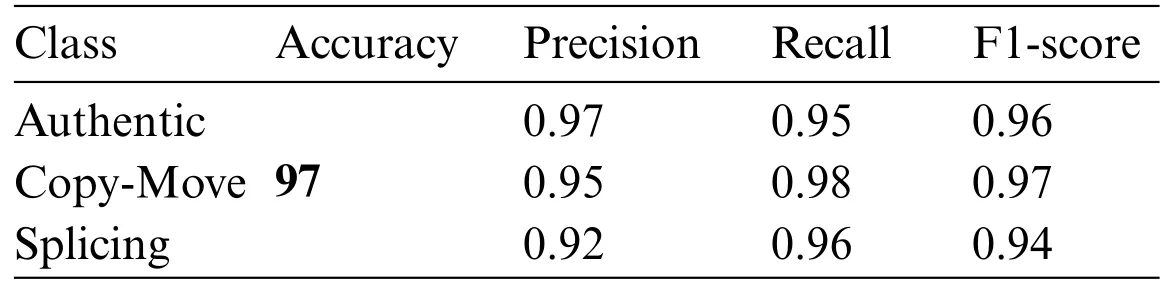
Table 9: Testing results on the combined dataset

Figure 10:Confusion matrix of testing results on the combined dataset
We may see the receiver operating characteristic by comparing the true positive rate(TPR) and false positive rate(FPR)at specific cutoffs.(ROC).Fig.11 shows the receiver operating characteristic(ROC)curve for classification tasks with different thresholds.In classification problems,AUC values between 0.8 and 0.9 on a ROC plot are satisfactory,while those between 0.9 and 1 are outstanding[31].The test set’s average AUC is 0.99,which suits the challenges.The approach performs well on all experimental datasets.
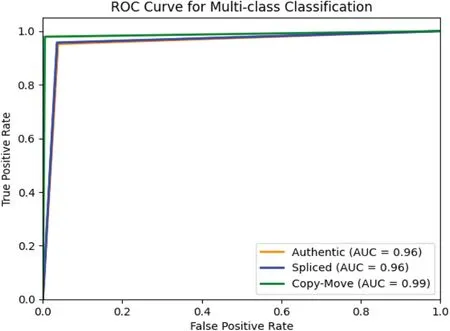
Figure 11:ROC of testing results on the combined dataset
Fig.12 shows training and testing accuracy,indicating good feature extraction.Training accuracy is seen in Fig.12.Losses decreased,and accuracy improved with each repetition,demonstrating the need to optimize the model and data preparation techniques.This perspective illuminates the probable involvement of poor feature selection in the training data and wrong class labeling in the testing data in the model’s underperformance.Fig.12 shows the importance of carefully selecting and arranging training and testing datasets for the best classification model performance.
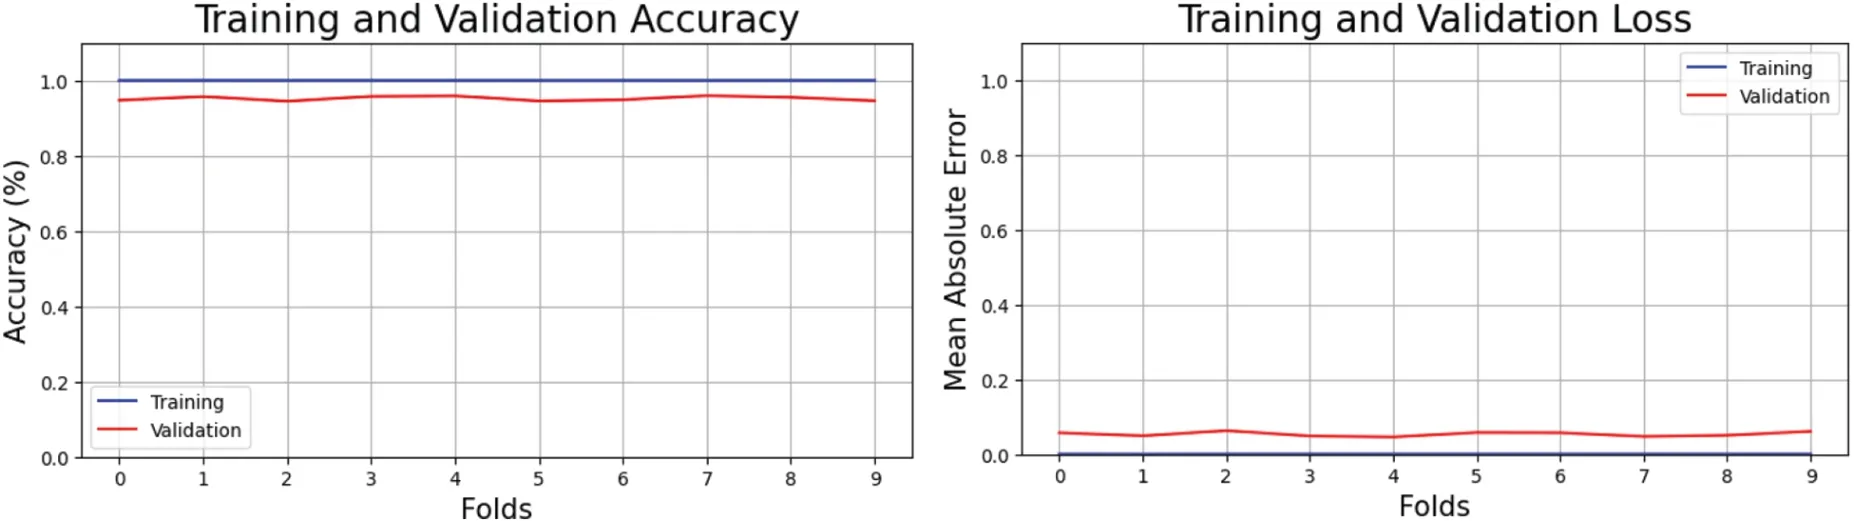
Figure 12:Cross-validation accuracy and loss of proposed method on combined dataset
4.4 Comparative Analysis with State-of-Art Methods
In Section 2,we looked at the many forgery detection methods available.Both machine learning and deep learning are used in some of them.Comparing a novel model to others tried and tested with the same data helps gauge their relative efficacy.As part of this study,we compared our method to existing methods with similar goals.The suggested approach is compared to existing state-of-theart methods regarding accuracy,precision,recall,and F1-score values.Priyanka et al.implemented support vector machines and discrete cosine transformation with single-value decomposition to accomplish feature extraction and classification.The MICC-2000 and CASIA V2.0 datasets achieved an accuracy of 0.91 using the method[6].Some researchers suggested using CNN-based techniques[32].Classifying images that have been tampered with involves the use of MobileNetV2 [33],an Autoencoder with CNN[34],and a fusion model[35]that combines two models.All these methods used benchmarked datasets MICC-F200 and CASIA V2.0 for experimentation.Table 4 demonstrates that the suggested technique surpassed these other studies,with an accuracy of 98.3%.Current best practices only work with a single dataset at a time,regardless of whether it was copied,moved,or sliced.The suggested research addresses this void by analyzing individual datasets and their combinations.Moreover,a custom dataset is also proposed for Copy-Move forgery classification and used in experimentation to achieve the best performance in classifying both types of forgeries,Copy-Move and splicing.Table 10 demonstrates that the proposed strategy outperformed popular methods in a recent study.
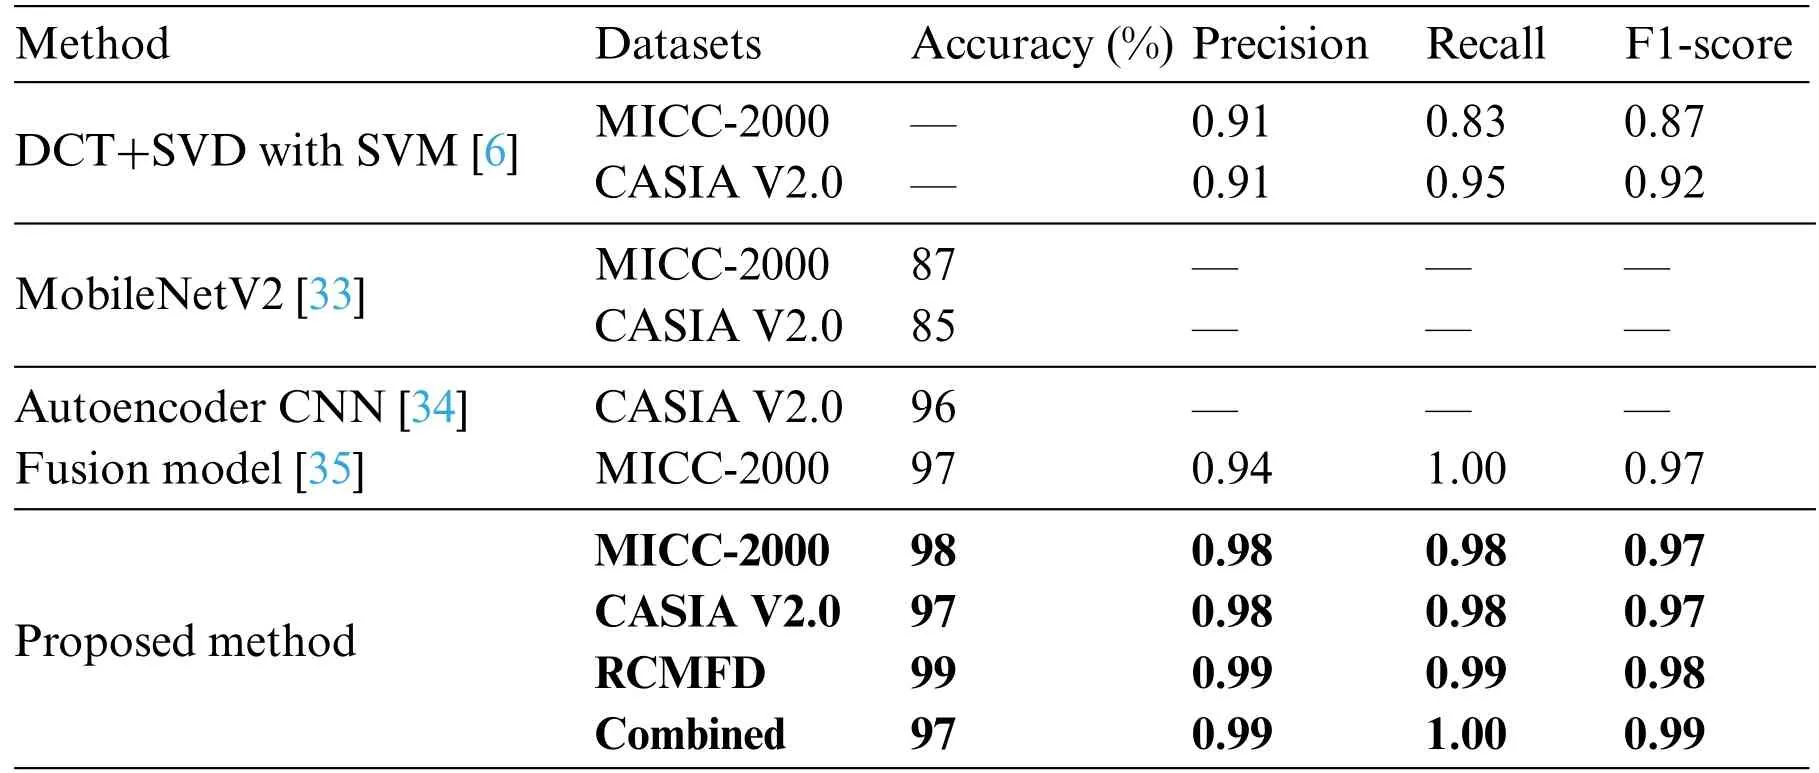
Table 10: Comparative analysis with state-of-the-art methods
5 Conclusion
Identifying forged images is an important area of research in multimedia security.In this study,we aim to detect fake motion picture copies using the Weber Local Descriptor(WLD)method.Our approach involves extracting blocks of color information from an image after removing the YCBCR channels.The WLD technique has proven robust to changes made to the copied and pasted area,such as rotation,scale,or distortion.However,to improve the effectiveness of our proposed method,we trained and evaluated it on an expanded dataset of images that have undergone various preprocessing operations on the cloned region.Our objective is to eventually localize altered sequences,whether they originated from a Copy-Move or a spliced region.We used the 10-fold cross-validation using XGBOOST classifier for classification and fine-tuned the extraction parameters to yield efficient and robust features,allowing maximum possible accuracy.The proposed method achieved a maximum accuracy of 97% on CASIA v2.0,98% on the MICC 2000,99% on the RCMFD,and 97% on the combined three-class dataset.The results of our study demonstrate the effectiveness of using the WLD method in identifying forged images.However,there are still some limitations that need to be addressed.For instance,our dataset is relatively small and may not represent real-world scenarios.Furthermore,our method may not be able to handle certain types of image manipulations,such as those that involve complex geometric transformations or high-level semantic changes.In conclusion,our study has contributed to developing techniques for identifying forged images using the WLD method.We plan to continue our research in this area by expanding our dataset and exploring other classification models further to improve the accuracy and robustness of our method.The ultimate goal is to develop a system that can detect image forgeries with high accuracy and efficiency in various real-world scenarios.
Acknowledgement:None.
Funding Statement:This work was funded by Princess Nourah bint Abdulrahman University Researchers Supporting Project number (PNURSP2024R236),Princess Nourah bint Abdulrahman University,Riyadh,Saudi Arabia.
Author Contributions:The authors confirm contribution to the paper as follows: study conception and design:A.Akram,A.Jaffar,J.Rashid;data collection:A.Akram,F.Hajjej,N.Sarwar,W.Iqbal;analysis and interpretation of results:A.Arshad,J.Rashid.W.Iqbal;draft manuscript preparation:A.Akram,J.Rashid,F.Hajjej,N.Sarwar,A.Jaffar.All authors reviewed the results and approved the final version of the manuscript.
Availability of Data and Materials:The data that support the findings of this study are available from the author,(Javed Rashid,RanaJavedRashid@gmail.com),upon reasonable request.
Conflicts of Interest:The authors declare that they have no conflicts of interest to report regarding the present study.
杂志排行

Computers Materials&Continua的其它文章
- Fuzzing:Progress,Challenges,and Perspectives
- A Review of Lightweight Security and Privacy for Resource-Constrained IoT Devices
- Software Defect Prediction Method Based on Stable Learning
- Multi-Stream Temporally Enhanced Network for Video Salient Object Detection
- Facial Image-Based Autism Detection:A Comparative Study of Deep Neural Network Classifiers
- Deep Learning Approach for Hand Gesture Recognition:Applications in Deaf Communication and Healthcare