Solute transport and geochemical modeling of the coastal quaternary aquifer,Delta Dahab Basin,South Sinai,Egypt
2024-03-06AmiraSamyMustafaEissaSehamShahenMoustafaSaidRababAboushahaba
Amira Samy·Mustafa Eissa ·Seham Shahen·Moustafa M.Said·Rabab M.Abou-shahaba
Abstract The wadi dahab delta is in a dry,arid coastal zone within Egypt’s south Sinai Peninsula’s eastern portion.The primary water source is the Quaternary coastal alluvial aquifer.The groundwater salinity varies from 890 to 8213 mg/L,with a mean value of 3417 mg/L.The dissolved major ions have been used to calculate the seawater mixing index (SWMI) using a linear equation that discriminates the groundwater mostly affected by water–rock interaction (SWMI 1>) and other samples mixed with Seawater (SWMI <1).The isotopic composition of groundwater for specifically chosen groundwater samples ranges from -0.645‰ to+5.212‰ for δ18O and from -9.582‰ to+22.778‰ for δ2H,where the seawater represented by a Red Sea water sample (δ18O+1.64‰-δ2H+9.80‰) and reject brine water are considerably enriched the isotopic groundwater values.The geochemical NETPATH model constrained by the dissolved significant ions,isotopes,and the rock aquifer forming minerals as phases indicate the mixing percent with the seawater ranges from 9% to 97% of seawater from 91% to 3% of original recharge water.According to the SEAWAT 3-D flow models,seawater has penetrated the Northeastern Dahab delta aquifer,with the intrusion zone extending 1500 m inland.The salt dissolution,upwelling of saline water,recharge from the upstream mountain block,and seawater encroachment are the primary aspects contributing to the deterioration of groundwater quality.These findings may have significance for effective groundwater withdrawal management in arid locations worldwide with similar hydrogeological systems.
Keywords Groundwater geochemistry·Seawater intrusion·Solute transport·SEAWAT
1 Introduction
Groundwater in arid coastal aquifers can be intensely vulnerable to seawater intrusion and contamination.The limited freshwater resources in arid regions can lead to excessive pumping of groundwater,which can cause seawater to infiltrate the aquifer and deteriorate the salinity of the freshwater supply.Furthermore,rising sea levels and climate change may exacerbate the issue of seawater encroachment in coastal arid aquifers (Eissa 2018).Effective management and conservation of these groundwater supplies are essential to ensuring a sustainable water supply for these populations.Due to overpopulation,the Middle East,North Africa,and Egypt are facing freshwater scarcity,especially in the arid coastal regions.Dahab is a town in Egypt’s south Sinai Peninsula,at the downstream portion of the Dahab Watershed along the Gulf of Aqaba coastline (Benaafi et al.2023;Alshehri et al.2021).The prevalence of aridity and consequent decrease in annual rainfall(The local rainfall ranges from 10.3 to 25 mm/year)leads to the exploitation of all existing water resources(Omran 2020).Groundwater is vital in supporting the life of the local inhabitants and agriculture as groundwater is considered the only source easily extracted from the coastal shallow Quaternary aquifer(Tantawi 2007).The scarcity of natural groundwater replenishment in arid coastal regions creates hydrogeological problems in coastal aquifers worldwide(Prusty and Farooq 2020;Sadeghi and Hosseini 2023).The groundwater over-pumping leads to a break in the natural balance between the groundwater and the seawater,leading to groundwater deterioration(Gopinath et al 2019;Maurya et al 2019;Kumar et al 2022).
Recently,the increased development activities in the Delta Dahab basin’s coastal areas,situated along the coast of Aqaba in Southern Sinai,Egypt,have necessitated an increase in demand for urban water supply (Eissa et al 2013).Groundwater salinization is a significant problem threatening groundwater characteristics in coastal arid aquifers(Vengosh 2013;Gomez et al 2021).In coastal arid aquifers,the groundwater quality deteriorated mainly due to evaporation,interaction with aquifer matrix,dissolution of minerals,redox,and mixing with Seawater(Richter and Kreitler 1993).The groundwater in Delta Dahab is considered the primary source for feeding the reverse osmosis(RO) desalination plants.The groundwater in Delta Dahab is mainly exploited from the coastal shallow unconfined Quaternary aquifer (Abdel-Shafy and Kamel 2016).The Quaternary aquifer comprises brackish and saline groundwater types.The brackish groundwater is a thin layer floating over deeper dense high,saline groundwater.Therefore,high groundwater abstraction leads to groundwater deterioration and salinization (Eissa et al 2016a,b).
This research aimed to optimize the groundwater pumping and delineate the brackish groundwater zones in the Quaternary aquifer to minimize the desalination cost.Therefore,an attempt has been made in the Dahab delta aquifer using logical inputs of hydrogeological and hydrochemical data sets to understand the groundwater flow hydrodynamics well and consequently manage the groundwater abstraction and delineate the brackish zones(Abd-Elhamid 2011;Prama et al 2020;El-Rawy et al 2023).Due to the shortage of freshwater supply,desalination plants are crucial to provide the necessary water as seawater/groundwater desalination is the primary alternative water resource (Abdel-Wahaab and El-Shazly 2007;Kessasra et al 2021;Elsaie et al 2022).
Hydrogeochemical characterization of groundwater has been investigated using chemical ratios,seawater mixing index(SWMI),and saturation indices(SI)for the dissolved minerals in the groundwater.The geochemical ion ratios were also used to identify processes leading to groundwater salinization (Cartwright et al 2009;Gopinath et al 2019;Ben Ammar et al.2020).The isotopic parts of groundwater(δ18O and δ2H) were also used to delineate the primary source(s) of subsurface recharge (Mazor 2003;Isawi et al 2016) and distinguish between processes such as evaporation,mineral dissolution,and mixing with the upconing of seawater and brine injection comes from the desalination plants(Clark and Fritz 1997).The geochemical NETPATH mixing model has been used to define the ratios mixing between groundwater and saltwater using the input of geochemical groundwater and isotope data.As a result,geochemical and stable isotopic data improve our knowledge of the groundwater hydrological system.Additionally,to understand groundwater flow hydrodynamics,regulate groundwater abstraction,and delineate brackish zones,a variable-density SEAWAT groundwater flow model is used (Abd-Elaty et al 2021;El Shinawi et al 2022).The SEAWAT,a miscible flow and transport model,has been widely used to forecast inland seawater passage and detect saltwater intrusion in coastal arid and semi-arid environments.(Guo and Langevin 2002).
The coastal aquifer in the Dahab Delta is a crucial source of potable water,but various water crises,such as declining water levels and groundwater salinization,have troubled it.The aquifer has not been extensively researched due to the absence of comprehensive geochemical,hydrogeological,and sample data resolution.Consequently,the primary goals of this research are to employ multi-chemo-isotope data to examine groundwater salinization in the Dahab delta aquifer.Furthermore,this study represents the first attempt to integrate isotopic and geochemical interaction models into a contaminant transport model to create a comprehensive model of the coastal aquifer.
2 Study area
The Delta Wadi Dahab is about 40 km2 in total area and lies on the Gulf of Aqaba western portion(Fig.1).The area is located between the longitudes 28°28′01′′and 28°31′02′′E and latitudes 34°32′01′′and 34°28′05′′N and is part of an arid zone.The recorded daily temperatures range from 30 to 38 °C and the annual rainfall is approximately 35 mm(Danin 1983;JICA 1999).Significant precipitation infrequently occurs due to convective clouds with a limited horizontal expanse (Abuzied and Mansour 2019).Regardless of the general aridity and low rainfall,hot temperatures,and evaporation rate of the study region,it is frequently prone to intense rainstorms that produce flash floods (Khedr et al 2017).

Fig.1 Location map of the delta wadi Dahab is located on the western side of Gulf of Aqaba
The relief is critical in increasing the quantity of precipitation.During the summer months (April to August),relative humidity varies between 53% and 60%,while in the winter (November to January),it ranges between 53%and 65% (Omran 2013).The Dahab basin’s western catchment area is 29.8%,with precipitation exceeding 50.5 mm/year.This watershed includes Saal,Nasab,and Rimthy sub-basins and gets approximately 3.5 million m3/year with rainfall varying from 20 to 33 mm.
Several studies have determined the different types of landforms in the Gulf of Aqaba (Issawi et al 1998;Hassan et al 2005,2007).Geomorphology can study everything from basement mountainous terrain to limestone flat-topped plateaus,alluvial fans,coastal plains,and network drainage units.The W.Dahab basin is part of the Arbo-Nubian Shield’s ancient Archean Triangle.The Dahab basin’s geological groups include igneous,metamorphic,and sedimentary rocks.(Hume 1906;El Shafei et al 1992;Zalata et al 1997;El Masry et al 2003;Ashmaway et al 2000).Most of the upper watershed comprises Precambrian metamorphic and igneous rocks and Cambrian to Quaternary sedimentary units (Said 1962;Soliman 1986;Kora and Genedi 1995;Hegazi 2006).
The Delta is an alluvial fan made up of Quaternary terraces and wadi fills.Alluvial fans comprise boulders,gravel,sand sizes,silts,and clays (Shabana 1998;El Kiki et al 1992).These deposits formed an important aquifer in the examined region because of their exceptional hydraulic features.The stream channel floors are covered in varied thicknesses and textures of alluvial deposits,where alluvial deposits’ thickness is 50 m.A significant portion of this rainfall was conveyed as surface runoff to the Gulf of Aqaba via the significant streams,considered the primary source of groundwater replenishment (Shalaby 2017).Additionally,upstream precipitation over basement rocks flows downstream,recharging the alluvial aquifers (Issar and Gilad 1982).The Quaternary groundwater has varied thicknesses and a lens shape above mean sea level (El-Refaei 1992;Shendi and El Rayes 1992;Oada 1995).The thickness of the body is highest in the west and gradually reduces as it travels east (Shendi et al 1997;Shendi and Oada 1999).The transmissivity of the aquifer varies in response to variations in lithology.The aquifer has a moderate to high potential and storativity of around 9.12×10⁻²,which is well within the limits of an unconfined aquifer (El-Refaei 1992;El Rayes 1992).According to the water table map,the flow pattern from the fracture basement outcrops flows northwest to the southeast or towards the Gulf of Aqaba (Shabana 1998).The thickness of the groundwater body ranges from 4.85 m to 0.86 m,with an average of 3 m(El-Refaei 1992),and the aquifer material’s specific yield is 15%.
3 Materials and methods
One field trip conducted in July 2019 collected forty-four water samples and ten rock samples from examining rockdrilled wells representing the aquifer located at the Delta Wadi Dahab basin along the Gulf of Aqaba representing the aquifer.Each water sample was filled into two plastic containers;one was a standard sample for determining chemical components,and the other was acidified with nitric acid before heavy metals analyses.Then they were labeled according to their sampling number,GPS reading and well serial number,and various field measurements.
3.1 Groundwater analyses
The groundwater samples were collected during the field trip on July 2019 and analyzed at the Desert Research Centre (DRC) laboratories based on methods reported by Rainwater and Thatcher 1960;Fishman and Friedman 1985;and the American Society for Testing and Materials ASTM 2002).

The electrical conductivity (EC) of groundwater,pH,and salinity (TDS) were measured during the field trip(Table 1).The EC (S/cm) was tested using a Thermo Electron Corporation Orion 150 A+EC meter model.A Jenway 3510 pH meter from the United Kingdom was used during the field trip.Ca2+,Mg2+,Na+,K+,SO42-,and chloride were measured using IC-Chromatography(Thermo Scientific Dionex ICS-1100 Ion Chromatography System) (Table 1).The alkalinity has been determined using titration against H2SO42-using phenolphthalein and methyl orange as indicators(Hem 1985).Thermo Electron Company’s Orion EA 940 ion selectivity meter measured bromide (Br-) and iodide (I-) levels.
3.2 Water extract and rock samples analyses
Ten rock samples were collected from the outcrops of basement rocks to determine the concentration of major oxides (Table 1).The rock samples were transported to a powdered grinder,and a (1:1 wt/wt) water extraction was performed to determine the number of anions and cations.Heavy metals were extracted from digestion samples using a microwave digestion system with added strong acids.Ten rock samples were analyzed using the x-ray fluorescence(NEX CG II,Cartesian Geometry-EDXRF) to determine the major oxides ratios (Table 2).

Table 2 The X-ray fluorescence data for rock samples in the study area

Table 3 Mineral saturation indices for phases in NETPATH geochemical models
3.3 NETPATH model
The geochemical analyses of major ions (Table 1),x-ray fluorescence data results for the collected rock samples(Table 2),and the mineralogical composition embedded in the aquifer matrix are considered as the primary data for geochemical NETPATH model.Based on the data used in the NETPATH-WIN model the saturation (SI) of minerals has been estimated (Plummer et al.1992).The SI of minerals was calculated (SI=log (IAP/KT),where IAP is the ion activity product,and K is the equilibrium constant at a given temperature (T) (Garrels and Mackenzie 1967)(Table3).
3.4 Saline water mixing index (SWMI)
An index known as the Saline Water Mixing Index(SWMI)was proposed to provide numerical evaluations of the proportionate influence of seawater mixing.The SWMI was determined using the equation described by Park et al.2005.Where;
Park et al (2005) calculated the constant factors a,b,c,and d from the concentrations of sodium,magnesium,chloride,and sulfate in seawater worldwide.Ti displays the threshold calculated values for various ions in a specific location.These values are discovered by inspecting cumulative probability curves.Cidenotes the ion concentration in milligrams per liter for dissolved ions(Ca2+,Mg2+,Na+,Cl-,and SO42-).A SWMI value greater than one indicates that mixing with seawater may have impacted groundwater,while SWMI<1 indicates freshwater (Mondal et al.2011).
3.5 Solute transport model (SEAWAT)
To evaluate the encroachment of seawater in the porous aquifer media of the delta,the SEAWAT software model was applied to solve density-dependent/solute transport flow equations developed by Guo and Langevin (2002),which combines the MODFLOW and MT3DMS solute transport equations(Harbaugh et al 2000;Zheng and Wang 1999).In this research the historical records of groundwater level and chloride concentration as a good conservative ion have been used to calibrate the SEAWAT model.
4 Result and discussion
4.1 Groundwater geochemistry
Groundwater salinity is represented by the sum of the dissolved major,minor,and trace elements in mg/L.The interaction between the groundwater and the mineral embedded into the aquifer matrix can significantly impact the solute concentration.The groundwater salinity of the Quaternary aquifer varies from 890 mg/L to 8213 mg/L,with an average of 3417 mg/L(Table 1).While the salinity of the six samples feeding the reverse osmosis desalination plant ranges from 33,500 mg/L to 53,200 mg/L.
Based on the salinity level,groundwater is classified into fresh,brackish,or saline based on total dissolved solids (TDS) levels (Chebotarev 1955).The bulk of groundwater samples in the research region is classed as saline(4%)or brackish(92%),with a minority classified as freshwater (4%).The majority of salty water samples are found along the shore.Subsurface seepage from fractured basement rocks is the recharge source for the coastal alluvial aquifer in Delta wadi Dahab.High salinity samples reflect the impact of leaching and dissolving of marine origin deposits and mixing with seawater.
In almost all groundwater samples in the investigated region,major ions.Calcium and magnesium are essential components of carbonate minerals (limestone and dolomite),and they dissolve in water as alkaline earth metals.They are commonly found in natural water as dissociated bivalent ions and are responsible for water hardness.The calcium concentration in the alluvium aquifer varies from 66.56mg/L to 873.6 mg/L with an average value of 418.1 mg/L,while the magnesium concentration ranges from 5.05 to 1453.14 mg/L with an average value of 260.4 mg/L.The water–rock interplay with a carbonate-rich aquifer matrix and/or mixing with saltwater are depicted in the figure (Vengosh and Rosenthal 1994;Oliva et al 2004).Sodium and potassium are the most common members of the periodic table’s alkali-metal group.The main sodium and potassium sources are sedimentary rocks such as clay minerals and evaporate.The high solubility of sodium and potassium ions and their restricted sportive bonding to clay minerals and other adsorbents significantly enriched the sea and evaporates deposits (Matthess 1982).The sodium concentration in natural water is typically less than 200 mg/L,reaching approximately 10,000 mg/L in saltwater and 25,000 mg/L in brines (Hem 1985).
The monovalent ion (Na+) ranges from 259 to 18,200 mg/L,with an average value of 1591 mg/L.Bicarbonates and carbonates are commonly found in natural groundwater due to weathering and decomposition of carbonate minerals and CO2,which aids in dissolving these elements(Rainwater and Thatcher 1960).Bicarbonate concentrations in groundwater vary from 48.8 to 207 mg/L,with amean value of 106.99 mg/L.Gypsum and anhydrite are the most significant contributors to sulfate in natural water(Hem 1985).Additional sulfate addition to groundwater occurs due to the breakdown of organic compounds in the soil and the addition of leachable sulfates in fertilizers(Omar 2008).The sulfate concentration in the Alluvium aquifer varies from 179.06 to 7266.4 mg/L,with a mean value of 1693 mg/L.The aquifer’s comparatively low sulfate concentrations (less than 2000 mg/L) result from water–rock interaction-induced leaching and dissolution.Higher sulfate concentrations,on the other hand,are primarily due to mixing with saltwater.The leaching of marine deposits and seawater intrusion are the two most significant sources of chloride in groundwater.Chloride can give drinking water a salty flavor and may hasten the corrosion of metals used in the water supply system,particularly when combined with calcium and magnesium.The chloride concentration in samples in the alluvium aquifer varies from 333.2 to 25,906.3 mg/L,with a mean value of 4930.06 mg/L.High chloride amounts are primarily due to the leaching and dissolution of oceanic origin.Overpumping groundwater in coastal aquifers lowers groundwater levels and allows saltwater to enter.
4.2 Hydrochemical facies evaluation
Chemical ion ratios enable the identification of geochemical processes affecting water quality,such as leaching,evaporation,and ion exchange,as well as the evaluation due to saltwater intrusion (Sukhija et al 1996;Vengosh et al 1999;El Moujabber et al 2006;Kouzana et al 2009).In the present study,the used ion ratios are rK+/rCl-,rNa+/rCl-,rCa2+/rMg2+,rMg2+/rCl-,rCa2+/rSO42-,rSO42-/rCl-,rNa++K+-rCl-/SO42-,rCl--(Na++K+)/rMg2+,rCl--rNa++K+/rCl-,rCl-/r(HCO3-+CO32-),Cl-/Br-and Br-/Cl-(Table 4,Figure 2).To describe the main source and the hydrochemical processes affecting the groundwater samples,the four end members,the recharge water (rain),the seawater,reject water from RO plants,and rock samples,are used.

Table 4 Hydrochemical ratio ranges and mean values for the several aquifers in the study area
The rCa2+/rMg2+ratio (ions are represented in meq/L)can differentiate the groundwater types in carbonate aquifer (Jacobson and Langmuir 1970).When this ratio approaches one,indicating that groundwater flows entirely through the dolomitic aquifer matrix.The groundwater in limestone has a ratio equal to or exceeding four (Miesler and Becher 1967).In Fig.2,the rCa2+/rMg2+ratio in groundwater samples collected from the study area varies from 0.2167 to 16.946,with a mean value of 4.1819,indicating meteoric water origin.There is an inverse relationship between rCa2+/rMg2+and TDS of groundwater due to seawater mixing with groundwater.This ratio could identify sulfate excesses in groundwater caused by CaSO4dissolution or CaCO3precipitation.

Fig.2 Hydrochemical ratios of the studied groundwater with respect to total dissolved solids level
The value of rNa+/rCl-(ions are represented in meq/L)ranges between 0.579 and 1.29 in the alluvium aquifer,with an average value of 0.8979.In fresh and meteoric water,the significance of rNa+/rCl-is always more than unity,while it is excluded in seawater (Hem 1985 and Khaska et al 2013).A value greater than one shows sodium has a considerably higher value than chloride.In Fig.2b,most groundwater has a value of rNa+/rCl-less than unity due to water–rock interaction.At the same time,high-saline groundwater has rNa+/rCl-exceeding unit due to groundwater mixing with Seawater (Alcala´ and Custodio 2008;Shunmugam 2022).77% of the groundwater had rNa+/rCl-a smaller amount than unity,while 23% have rNa+/rCl-exceeding unity.
The ration of rSO42-/rCl-ratio in rainwater is 0.86 and 0.11 in seawater.Figure 2c depicts a negative association between ratio value and total dissolved solids (TDS) as salinity increases due to seawater intrusion.The groundwater has rates ranging from 0.15 to 1.6,with a mean of 0.36.The calculation implies that 85% of (rSO42-/rCl-<0.25) indicates meteoric water origin.
The lower values of rMg2+/rCl-(ions are represented in meq/L)in the examined groundwater suggest the existence of saltwater intrusion or marine salt pollution(Fig.2d).The Cl-/(HCO3-+CO32-) parameter is used to differentiate between a salinization tendency and areas of seawater intrusion (Simpson 1946;Asare et al 2021;Chang et al 2022).The groundwater based on this ratio as;typically suitable groundwater (Cl-/(HCO3-+CO32-<1),slightly contaminated water (1>Cl-/(HCO3-+CO32-<2),moderately contaminated water(2–6)and seriously contaminated water(6–15),and e)highly contaminated water(more than 15).According to Fig.2e,6% of the groundwater is moderately contaminated,13% is seriously contaminated,and 81% is highly contaminated waters.
Br-/Cl-ratio can discriminate the marine from terrestrial salt content sources (Andreasen and Fleck 1997).These ions are considered conservative because they are unaffected by redox processes and are not adsorbed on mineral or organic surfaces (Fetter 1993).In Fig.2f,the Br-/Cl-values vary between 0.005 and 0.045,with an average value of 0.022,which is close to seawater(0.003),suggesting the presence of seawater intrusion.Figure 1 shows the Br-/Cl-ratio versus total dissolved particles.(Fig.7K) indicates that as salinity increases,the Br-/Clratio decreases,suggesting that salinization of these ground waters is caused primarily by mixing with seawater or upwelling deep saline groundwater.
4.3 Saturation indices
The saturation index (SI) gives good insights into the hydrochemical processes that influence groundwater chemistry(Langmuir 1997;Li et al 2010;Mohammed et al 2022).In water,minerals are in equilibrium (SI=0),undersaturation(SI<0),or indicate supersaturation(SI>0)(Appello and Postama 2005;Qian and ma 2005;Luo et al 2008;Ndjaka 2022).The NETPATH model was used to create an aqueous specification model,and saturation indices for all groundwater samples were acquired (Plummer et al 1992).In this research,the mixing with other fluids and the effects of the impact of aquifer matrix on groundwater and mixing with seawater were examined by using the NETPATH software package.The SI for carbonate minerals (calcite and dolomite),halite (NaCl),quartz,and sulfate mineral (gypsum) were calculated(Table 3,Fig.3a–e) and Table 3).
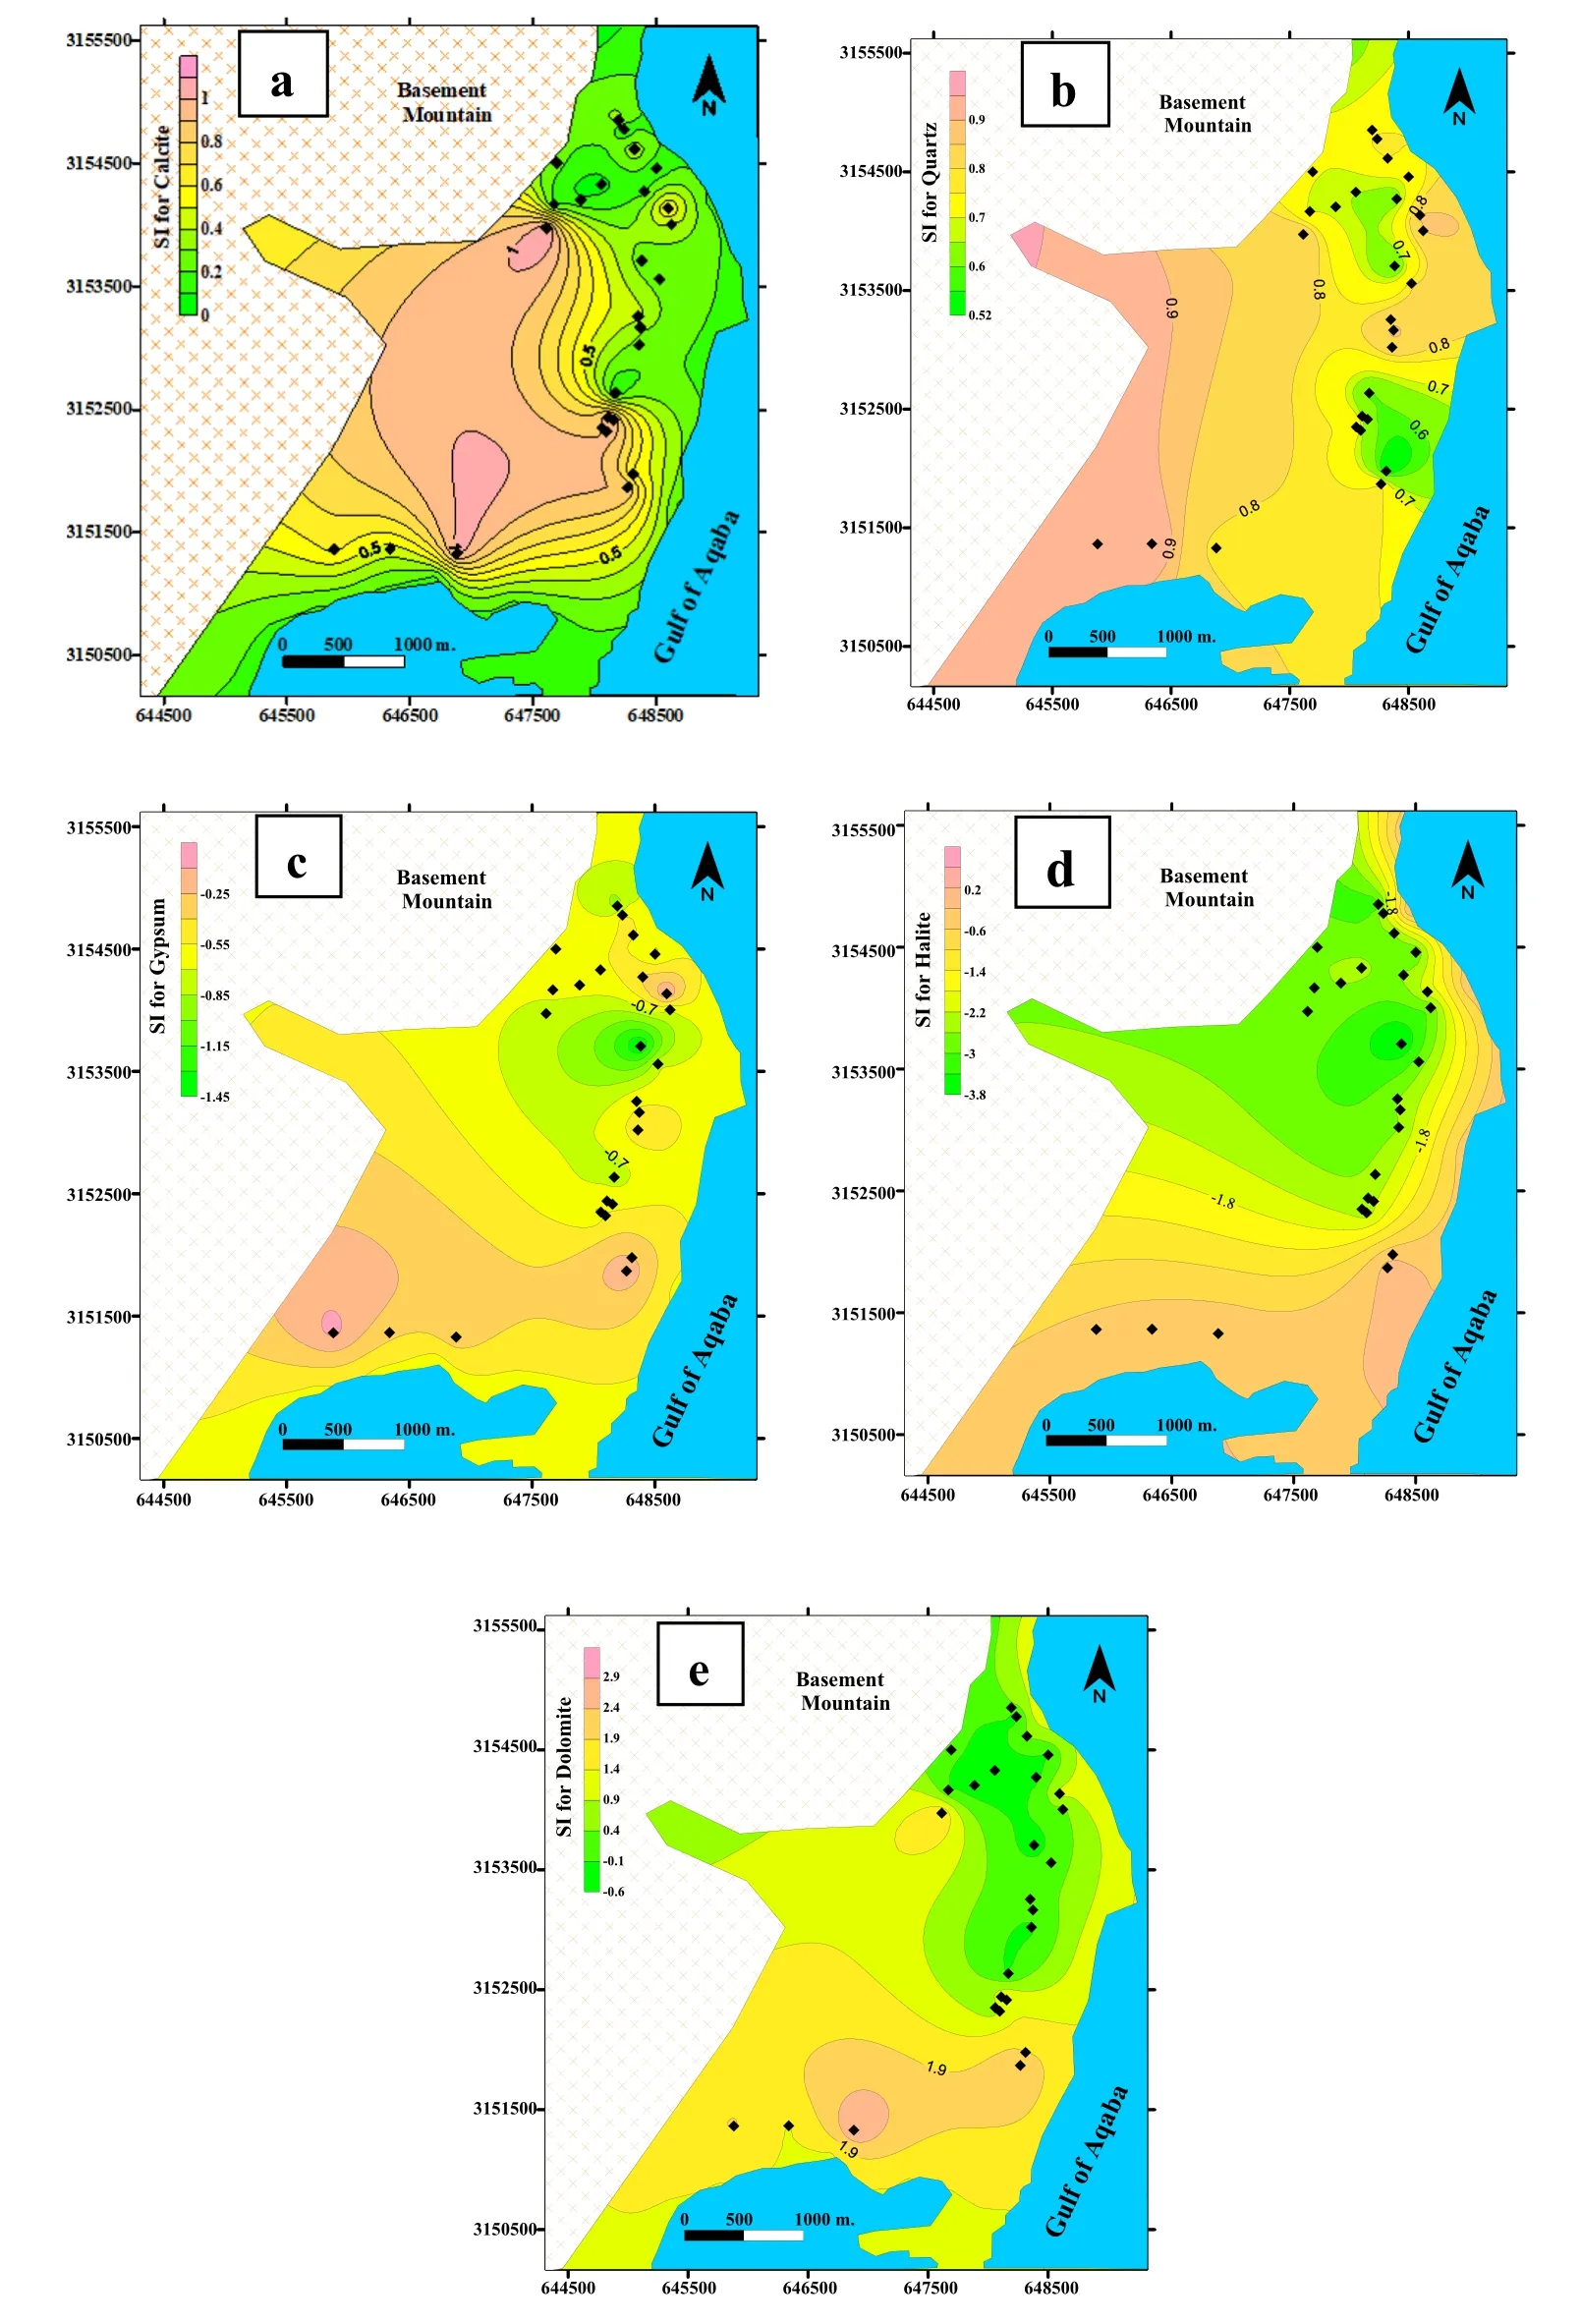
Fig.3 The spatial distributions of the saturation indices of several minerals

Fig.4 The spatial distributions of the saturation indices of several minerals
In Fig.3a and b,groundwater samples had positive saturation indices (SI>0 supersaturation of minerals) of calcite (97%) and quartz (100%) due to the leaching and dissolving of the limestone and felsic granitic rocks rich in silicate minerals embedded in the alluvial aquifers that comes from the upstream watershed.All groundwater samples tested had negative halite and gypsum indices (SI 0 sub-saturation and mineral dissolution),showing that the mineral was below saturation (Fig.3c and d).The spatial distribution of saturation indices shows lower SI values for calcite and halite along the coastal shoreline due to mixing with seawater (Appelo and Postma 2005).However,lower values of dolomite (Fig.3e) and halites were recorded at the northwestern portion of the delta,indicating subsurface groundwater replenishment and recharge come from the basement mountain.Figure 4a–e indicate the relationships between the groundwater salinity and the saturation indices of calcite,dolomite,gypsum,quartz,and halite.The groundwater samples have been plotted on the mixing line between two end members;the rain/rock extract end member and the sea/reject brine water end member.They are indicating meteoric recharge origin and mixing with seawater.
4.4 Seawater mixing index (SWMI)
The SWMI is a parameter chosen to indicate mixing and used to understand the mixing processes in coastal aquifers better(Eissa et al 2016a,b).Probability distribution curves are essential for analyzing geochemical data and distinguishing processes influencing groundwater (Shaw 1961;Sinclair 1974,1976;Abu Salem et al 2022).
In Fig.5a–d,Ti indicates the threshold value for Na+,Mg2+,Cl-,and SO42-ions (Mondal and Singh 2011;Kumar 2014).Inflections are determined using distribution probability curves;the inflections are mostly attributed to groundwater mixing with seawater.The estimated focal Ti value for Na+was 1600 mg/L,25.4 mg/L for Mg2+,3498.6 mg/L for Cl-,and 1809 mg/L for SO42-.Groundwater is classified into two types by the SWMI.(Fig.5).Group I(SWMI<1) has a groundwater TDS range (from 895 to 4793 mg/L) representing the subsurface meteoric groundwater recharge of the watershed.The salinity range of Group II (62.79 SWMI 104.38) is similar to that of seawater (TDS values range from 33,539 to 53,216).

Fig.5 Cumulative probability curves for the distribution of A Na+,B Mg2+,C Cl-,D SO42-in groundwater samples E Cross-plot of Seawater mixing index vs.total dissolved solids of the studied groundwater samples
4.5 Stable isotope for evaluation of groundwater origin
Isotope techniques can distinguish the processes contributing to groundwater salinization,such as salt leaching,meteoric recharge water,and mixing with seawater.The oxygen(δ18O)and hydrogen(δ2H)isotope values of water are perfect tracers for recognizing the recharge source(s)and mixing with other waters as they are not involved in geochemical reaction,and are sensitive to physical processes such as evaporation(s) (Dansgaard 1964;Clark and Fritz 1997).
The isotopic content of groundwater varies depending on the groundwater sample from -0.64 ‰ to+5.21 ‰ for δ18O and from-9.58‰to+22.77‰for δ2H,according to the findings results of δ18O and δ2H in Table 1.Seawater is represented by a Gulf of Aqaba water sample with considerably elevated isotope values (δ18O: 1.64 ‰;2H 9.80‰),and it is one of the primary sources of salt in the research region (Fig.11a).The samples are separated into two groups by plotting δ18O vs.δ2H (Fig.6a).The first group is relatively depleted with the content of both δ18O and δ2H.Brackish water samples and samples with high salinities are included in these samples.All samples are plotted close to the Global Meteoric Water Line(GMWL),obtained from (Craig 1961),indicating that they are of meteoric origin and have evaporated from shallow groundwater within the aridity condition.The isotopic fingerprints of these groundwater samples are plotted close to the weighted mean average of local precipitation in the hyper-arid zone of Southeast and Eastern Sinai reported by Eissa et al.(2013).The second group is distinguished by high values of δ18O and δ2H and proximity to the depicted seawater sample,implying mixing with saltwater and evaporation processes influence the samples to various degrees (WISER 2008;Anker 2003).The mixing ratio between fresh water and seawater is illustrated in fig.using the values of δ18O,chloride,and bromide.Rainwater affects samples 9,10,14,15,19,20,23,27,38,39,and 41,whereas the other samples show a mixture of rainwater and salt water (Fig.6c and b).

Fig.6 a δ 18O versus δ 2H for groundwater of the Dahab watershed.b δ 18O versus bromide for groundwater samples in the Dahab watershed.c δ 18O versus chloride for groundwater samples in the Dahab watershed
4.6 Geochemical NETPATH model
The NETPATH model used rock-forming minerals and x-ray fluorescence (XRF) data from the aquifer matrix to account for the reactions with aquifer matrix and estimate the mixing with different end members (Clark and Fritz 1997;Plummer et al 1992).The constraints are chosen based on the rock composition of the quaternary aquifer.Table 2 displays the XRF findings for the rock samples.The average geochemical composition of the rock samples has been calculated to reflect felsic,mafic,and intermediate rocks(felsic group:rock samples 1,1,3,5;the mafic group rock samples 2,4,6,and the intermediate group rock samples 1,4,6,7,8,10).The NETPATH model was presented to the three groups,simulating the mass-balance movement solely through water–rock interaction processes.The groundwater in the Quaternary alluvial aquifer flows toward the sea from the northwest to the southeast (Shabana 1998;Issar et al 1984).Groundwater analyses have constrained the NETPATH geochemical model,the aquifer matrix’s rock-forming minerals,and the XRF results(Table 5).

Table 5 Constraint,phases and parameters used as input data in the NETPATH geochemical model
The NETPATH findings indicate the dissolution of Gypsum,quartz,halite,mafic,intermediate,and strontianite with some cation exchange,sodium in the aquifer matrix exchanges with calcium in groundwater,and vice versa.At the same time,albite,alunite,anorth,calcite,chlorite,and k-mica are precipitated (Table 6).

Table 6 NETPATH modeling results (mmol/L) for the Wadi Dahab Delta Area.Positive values mean the phase is going into solution while negative values mean the phase is being removed from the solution
The NETPATH model accounted for mass balance transfer via water–rock interaction and computed seawater mixing ratios in ten wells.The NETPATH results show dissolution of gypsum,quartz,halite,felsic,mafic,intermediate,dolomite,and strontite.Sodium in the aquifer matrix exchanges with calcium in groundwater and vice versa.While albite,alunite,anorthite,calcite,chlorite,illite,and dolomite are precipitated (Table 6).The NETPATH model allowed mass balance transfer via water–rock interaction in six wells and calculated seawater mixing ratios.The calculated mixing in the delta aquifer ranges from 1% to 90.4% from seawater.
4.7 SEAWAT transport model
The SEAWAT (Reilly and Harbaugh 2004;Langevin and Guo 2006),a dependent variable density and solute transport flow model,was used to simulate the seawater mixingin the delta Dahab alluvial fan.The model area of Delta Dahab has been discreet into uniformed cells of 100 columns and 100 rows of a dimension of 50 m.
4.7.1 Boundary,initial conditions,and model parameters Three kinds of boundary conditions(Fig.7)are applied;1)Constant head boundary (CHB) where;h=0 m boundary has been applied along the Gulf of Aqaba 2) Constant concentration boundary (CCB) where;chloride concentration=22 kg/m3) boundary has been used to simulate the Gulf of Aqaba water chemistry (Langevin and Guo 2006)and 3) Solute flux is used to simulate the chemistry(Chloride concentration=130 mg/L) and subsurface recharge comes from the upstream watershed.The solute flux has been used at the boundary between the basement mountain and the Quaternary aquifer.The value chloride concentrations at the Gulf and upstream recharge were based on the chemical analyses of two samples during the field trip.The model has been stressed by pumping wells to simulate the daily pumping from the aquifer data collected during the field trip (5 to 10 m3/day for each well).The geographical limits of the study region were considered to have no flow boundary condition,suggesting that all four domains are inside the study boundary (Fig.7).The aquifer’s total porosity ranges between 20%and 30%,and the effective porosity ranges between 10%and 15%based on the range of alluvial deposits along the Gulf of Aqaba(Eissa 2018).The specific storage value assigned to the model was 1×10⁻⁵m-1(El Kiki et al 1992)(Table 7).The molecular diffusion coefficient was assigned by 0.308 m2/day (Guo and Langevin 2002).The assigned dispersivity value was 50 m,giving the best bound between the measured field and modeled calculated values,and was consistent with the dimension scale of the investigated aquifer (Gelhar et al 1992;Zheng and Bennett 1995).

Table 7 The model parameters used for the SEAWAT transport model
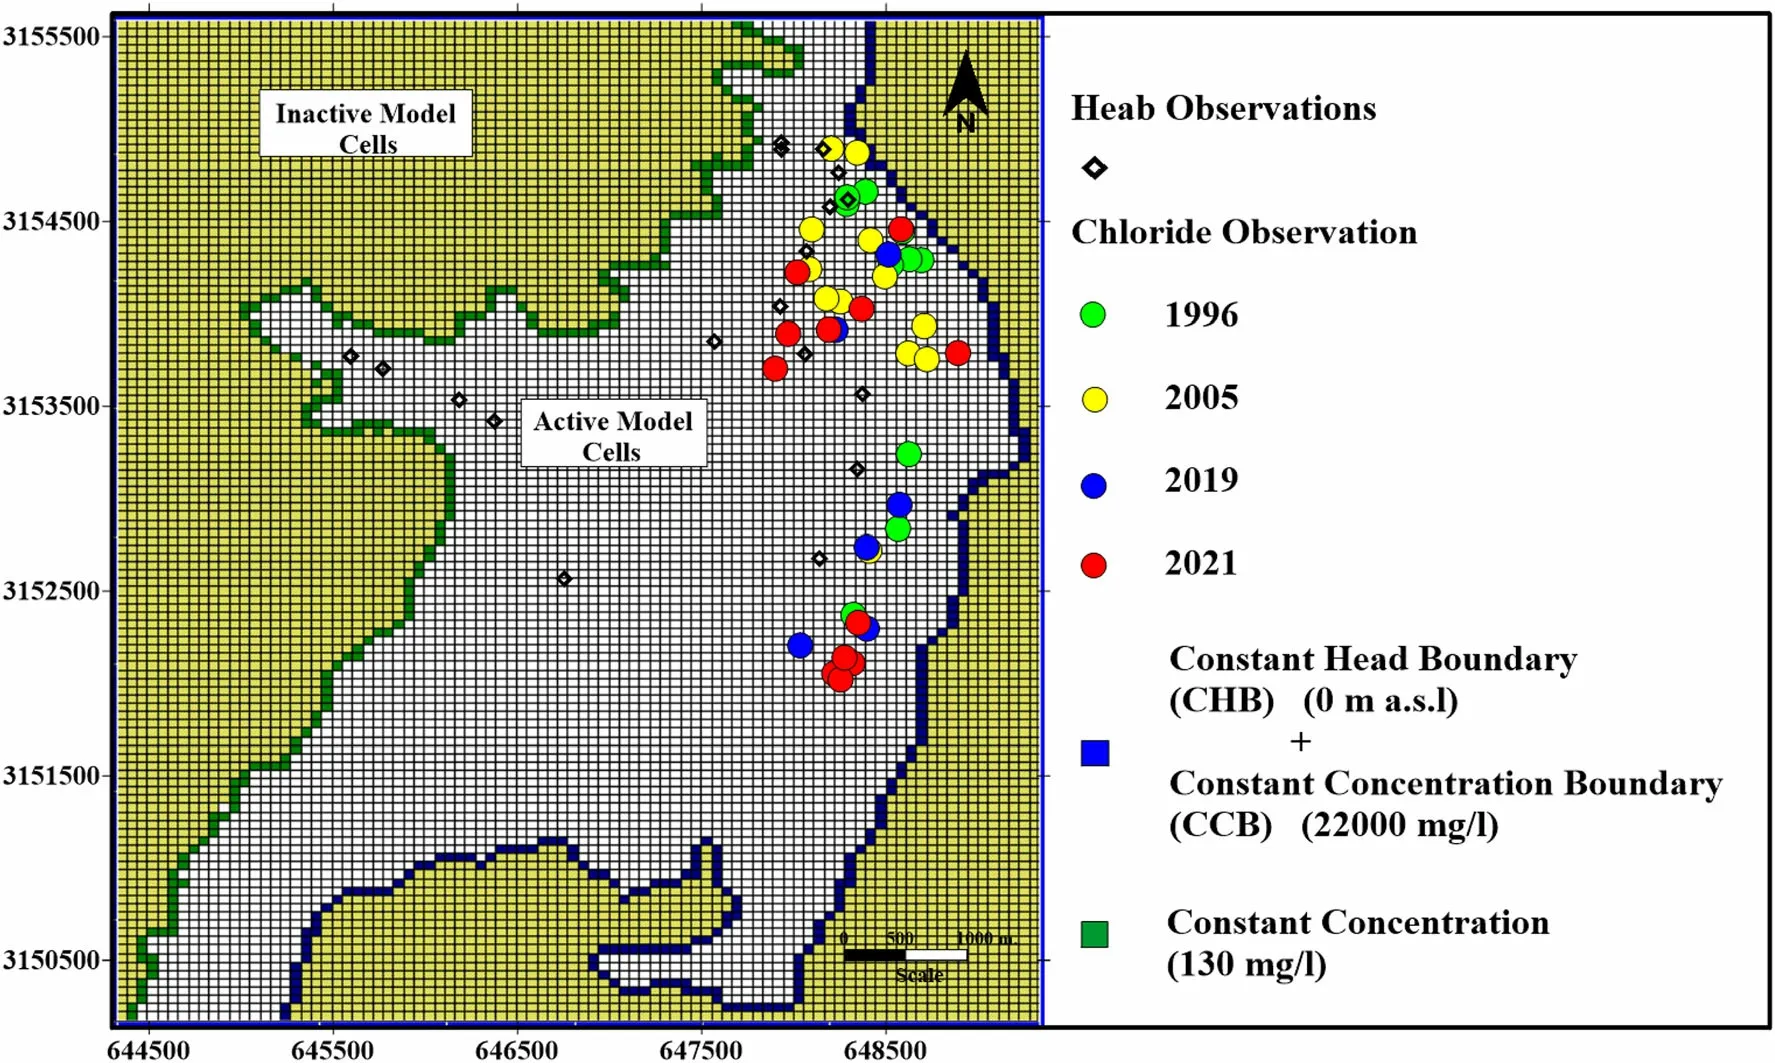
Fig.7 Boundary conditions,head observations,chloride observations for the SEAWAT model domain
The SEAWAT model has been run until reaching the steady state condition for the groundwater flow and using chloride ions as a transport specie.The steady-state condition has been reached when no further changes have been detected in both head and transport.The flow and solute transport governing equations and boundary parameters define the numerical model.Groundwater flow equations account for the hydraulic head.The head values were increased for representing samples distant from the coastal regions.
4.7.2 Model calibration and solute transport simulation Historical head and chemistry observation records have been used to calibrate the SEAWAT model.The head and salinity data were obtained from previous publications(Shabana 1996) and our field measurements were conducted in 2019.The model ran until we obtained general agreement between the measured data in the field and the calculated data from the model.The SEAWAT groundwater flow model for the Wadi Dahab Delta was calibrated using SEAWAT in a transient state using the chloride concentration tied with the head observations data from 1986 to 2019 (Fig.7).The model has been calibrated by optimizing the subsurface recharge values at the boundary between the basement mountains and the alluvial aquifer until the relative error between the simulated and measured chloride and head observations have been minimized(Fig.8).The relative error between the measured and calculated water levels was less than 10% and less than 15% for the chloride observations.The assigned pumping data were collected during the field trip from the well owners,ranging from 0.5 to 7 m3/day for the hand-dug wells and from 15 to 20 m3/day for the drilled wells which has submerged pump.

Fig.8 a Calculated versus observed head,and b Calculated versus measured chloride used for SEAWAT model calibration
The same framework was also used to forecast pumping rates,which varied until the calculated values’ salinity curve matched the observed values(Fig.8).The calibrated model models transient changes in groundwater levels and salinity flux based on pumping stresses.Using observed head and salinity for calibrating the SEAWAT model yields more precise estimates of model output parameters such as subsurface recharge and modeled pumping stresses(Eissa et al 2016a,b;Eissa 2018).
The calibrated SEAWAT model results show that the hydraulic head’s maximum drawdown has been observed at the Northeastern portion of the Wadi Dahab Delta,where the short inter-distance between wells is more closely crowded.The groundwater level has been decreased by 3 m from the steady state initial assigned values indicating overpumping and high withdrawal rates,which exceed the natural subsurface groundwater recharge(Fig.9a–e).The eastern side of the Delta maintained the natural subsurface flow and low drawdown values.The modeled estimated average of the total subsurface recharge from the mountainous basement attains 800 m3/day during the modeled time.The main recharge comes from the Northwestern portion of the study,mainly from the basement mountain,with scarce recharge from the Western side.

Fig.9 a The simulated groundwater head during different time steps for the SEAWAT calibrated model
The model well simulates the solute transport due to the seawater intrusion due to withdrawals and the upwelling underneath seawater.The seawater invades the subsurface groundwater and shows the area near the coastline.The distance of seawater invasion from the coastal shoreline was estimated at 250,300,500,1000,1500 m during the period of steady 1986(steady state),2000,2015,and 2040(Fig.10a–e).The estimated chloride concentration in the delta aquifer increased from 895 mg/L in the initial state to 4793 mg/L from 1986 to 2019 (Fig.11a–e).The extrapolated model shows increasing chloride concentrations in the Delta in case of using the same pumping stresses.The model poorly performed the simulation of solute transport due to the high gradient concentration between the Gulf water and groundwater and the large grid dimension.The seawater intrusion indicates scarce recharge in such coastal arid regions,and the groundwater has to be well managed the pumping has to be reduced.
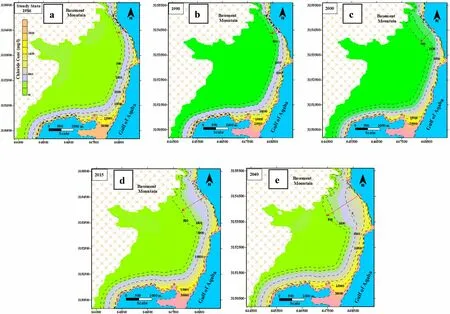
Fig.10 a The simulated chloride concentration (mg/L) during different time steps for the SEAWAT calibrated model

Fig.11 2-D cross section showing the chloride concentration (mg/L) during different time steps for the SEAWAT calibrated model
5 Conclusion
The groundwater chemistry within the alluvial aquifers of the Wadi Dahab delta transforms from brackish to saline water due to over-pumping.The high salt and chloride concentrations in groundwater are primarily due to the leaching and dissolving of marine origin.Overpumping groundwater in coastal aquifers degrades the groundwater quality due to declining groundwater level and,consequently,upconning of the saline wedge and inducing seawater intrusion.The rNa+/rCl-in most groundwater samples is less than unity due to water–rock interaction;at the same time,high saline groundwater that has rNa+/rClmore than unity due to groundwater mixing with seawater.The rCa2+/rMg2+shows an inverse relationship with the total dissolved solids due to seawater mixing with groundwater.This ratio indicates an excess of sulfate in the groundwater due to CaSO4dissolution or CaCO3precipitation.Also,the rSO42-/rCl-decreases by increasing salinity due to seawater intrusion.The groundwater samples have Br-/Cl-a ratio between 0.005 and 0.045 with a mean value of 0.022 (seawater has a value of 0.003),indicating the presence of seawater intrusion.Group I(1.56<SWMI<7.92)is more significant than unity and has a groundwater TDS range (from 895 to 4793 mg/L),indicating upstream meteoric groundwater recharge.
In contrast,Group II (62.79<SWMI<104.38) has a salinity range (TDS values ranging from 33539 to 53216 mg/L) that is near seawater.The geochemical NETPATH model constrained by the dissolved major ions,isotopes,and the rock aquifer forming minerals as phases indicates the mixing percent with the seawater ranges from 9% to 97% of seawater from 91% to 3% of original recharge water.SEAWAT modeled the estimated average subsurface recharge from the mountainous basement block by about 800 m3/day during the modeled time.The main charge comes from the Northwestern portion of the study,mainly from the basement mountain with scarce recharge from the Western side.The seawater invades the subsurface groundwater and shows the in area near the coastal shoreline.The distance of seawater invasion from the coastal shoreline was estimated at 250,300,500,1000,and 1500 m in 1986 (steady state),2000,2015,and 2040.The Wadi Dahab delta aquifer receives a limited recharge,and the pumping withdrawal quantity exceeds the natural subsurface recharge,and the aquifer is endangered by seawater intrusion.
FundingNo funding was/is available for this study.
Declarations
Conflict of interestThe article has not received any financial that are directly or indirectly related to the work submitted for publication.
Ethical approvalWe confirm that this manuscript has never been published before and is not being considered for publication in another journal.This paper reflects our own research and all the sources utilized are properly attributed in correct citation.
杂志排行
Acta Geochimica的其它文章
- Geochemistry and mineral chemistry of the armoor granitoids,eastern dharwar craton: implications for the redox conditions and tectono-magmatic environment
- The late Early-Paleozoic granitic magmatism in Northwestern Fujian,China: constraints on intraplate orogeny in the South China block
- Mineralogy and geochemistry of trachytic rocks from the Lichi Volcanics,Eastern Himalaya: insights into the Kerguelen mantle plume activity in the Eastern Himalayan Region
- Geochemistry,zircon U–Pb geochronology,and Hf isotopes of S-type granite in the Baoshan block,constraints on the age and evolution of the Proto-Tethys
- Distribution,health and ecological risk assessments of trace elements in Nigerian oil sands
- Petrogenesis and tectonic implications of the Silurian adakitic granitoids in the eastern segment of the Qilian Orogenic Belt,Northwest China