Toward Establishing a Low-cost UAV Coordinated Carbon Observation Network (LUCCN): First Integrated Campaign in China
2024-02-18DongxuYANGTonghuiZHAOLuYAODongGUOMengFANXiaoyuRENMinggeLIKaiWUJingWANGZhaonanCAISisiWANGJiaxuGUOLiangfuCHENandYiLIU
Dongxu YANG ,Tonghui ZHAO ,Lu YAO* ,Dong GUO ,Meng FAN ,Xiaoyu REN ,Mingge LI,Kai WU,Jing WANG,Zhaonan CAI,Sisi WANG,Jiaxu GUO,Liangfu CHEN,and Yi LIU
1Carbon Neutrality Research Center (CNRC), Institute of Atmospheric Physics,Chinese Academy of Sciences, Beijing 100029, China
2Key Laboratory of Middle Atmospheric Physics and Global Environment Observation (LAGEO),Institute of Atmospheric Physics, Chinese Academy of Sciences, Beijing 100029, China
3State Key Laboratory of Remote Sensing Science, Aerospace Information Research Institute,Chinese Academy of Sciences, Beijing 100101, China
4National Remote Sensing Center of China, Beijing 100036, China
5The Administrative Center for China’s Agenda 21, Beijing 100862, China
ABSTRACT In this study,we introduce our newly developed measurement-fed-perception self-adaption Low-cost UAV Coordinated Carbon Observation Network (LUCCN) prototype.The LUCCN primarily consists of two categories of instruments,including ground-based and UAV-based in-situ measurement.We use the GMP343,a low-cost non-dispersive infrared sensor,in both ground-based and UAV-based instruments.The first integrated measurement campaign took place in Shenzhen,China,4 May 2023.During the campaign,we found that LUCCN’s UAV component presented significant data-collecting advantages over its ground-based counterpart owing to the relatively high altitudes of the point emission sources,which was especially obvious at a gas power plant in Shenzhen.The emission flux was calculated by a crosssectional flux (CSF) method,the results of which differed from the Open-Data Inventory for Anthropogenic Carbon dioxide (ODIAC).The CSF result was slightly larger than others because of the low sampling rate of the whole emission cross section.The LUCCN system will be applied in future carbon monitoring campaigns to increase the spatiotemporal coverage of carbon emission information,especially in scenarios involving the detection of smaller-scale,rapidly varying sources and sinks.
Key words: CO2,measurement networks,power station,carbon emission,cross-sectional flux method
1.Introduction
Anthropogenic carbon dioxide (CO2) is one of the most important GHGs contributing to global warming.Insufficient understanding of CO2emissions in power generation,cities and industry has resulted in significant uncertainties in global carbon budgets,which hinders the carbon management required for reaching carbon neutrality targets.The construction of a MRV (Monitoring,Reporting and Verification) system requires comprehensive data on carbon emissions and sinks over several spatial and temporal scales.Inventories are the foundation to understanding the conditions of anthropogenic emissions in each country and sector.However,the lack of transparency and biases in inventories is still a topic of discussion;even the methodology of a global standard inventory was reviewed in the 2006 IPCC Guidelines for National Greenhouse Gas Inventories with several versions of refinement.Therefore,independent atmospheric inversions were included in the 2019 refinement,aimed at utilizing atmospheric measurements for verifying inventories.Atmospheric inversion is a numerical method for the near real-time optimization of an acknowledged inventory.The inversion efficiency depends both on the inversion methods and measurements.A lack of measurements reduces the information content in the inversion processes,leading to lower efficiencies during inventory optimizations.Most anthropogenic emissions originate from cities,power stations,and industrial parks.These emission sources are strong,complex,and fast-changing.Therefore,recording anthropogenic emissions requires dense and high-quality continuous measurements of CO2concentration variations.
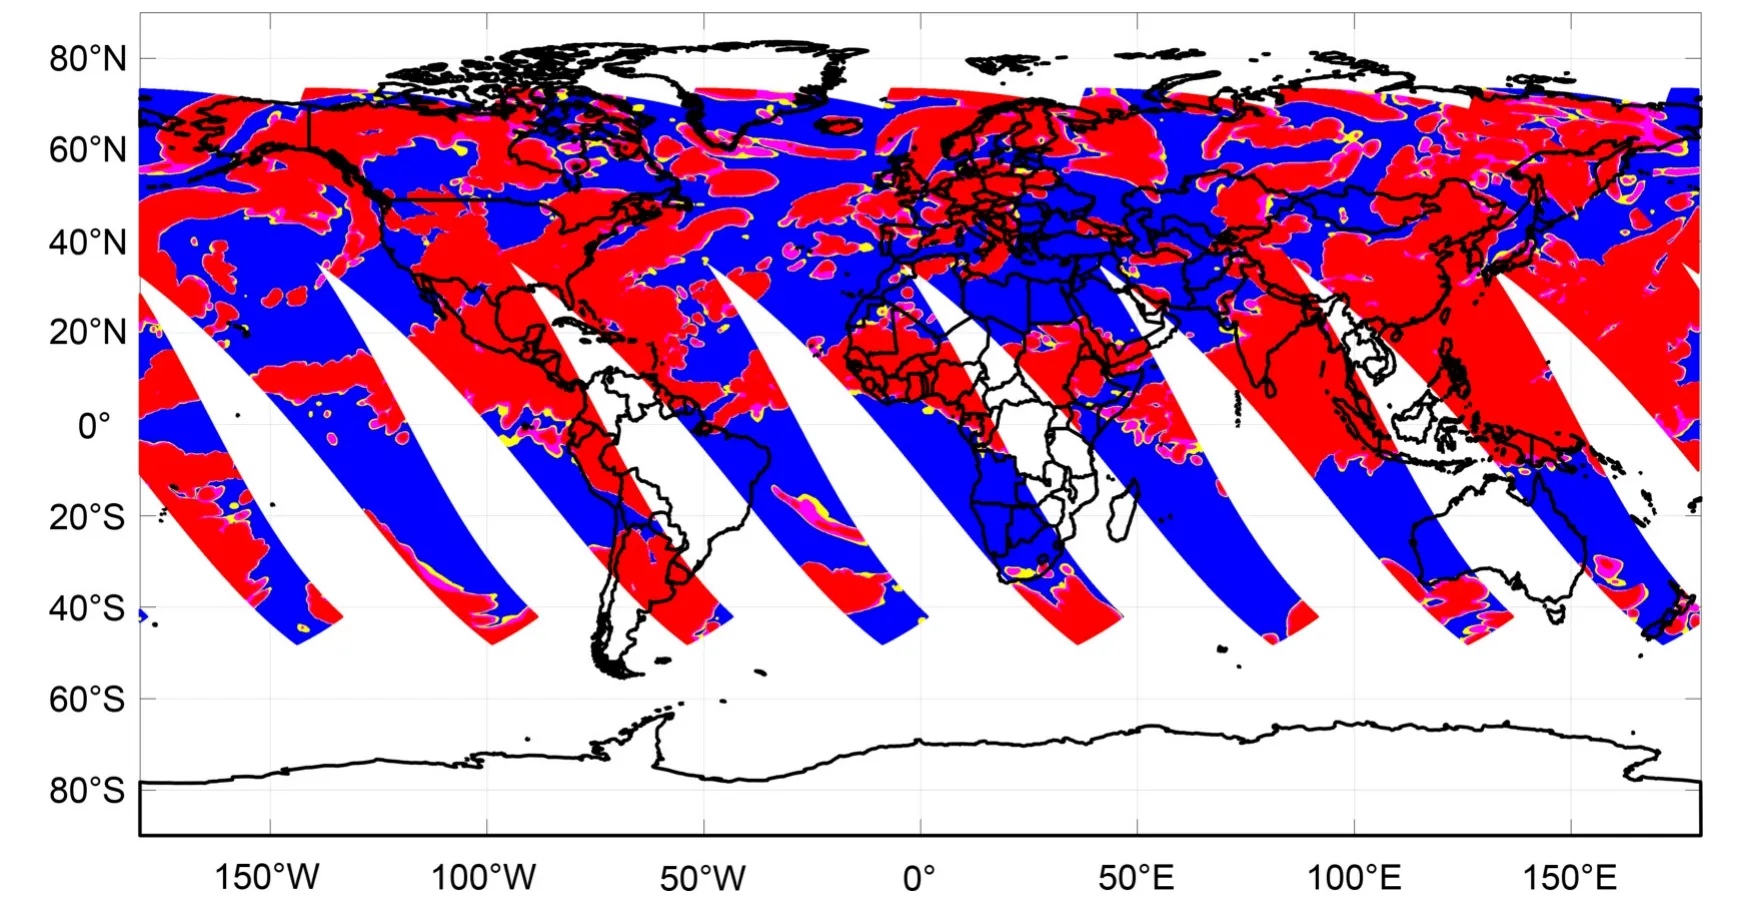
Greenhouse gas observation satellite missions,including the Chinese Global Carbon Dioxide Monitoring Scientific Experimental Satellite (TanSat) (Yang et al.,2018,2020,2021a),Japan’s Greenhouse gases Observing SATellite (GOSAT,2009) (Kuze et al.,2009),and NASA’s Orbiting Carbon Observatory-2 (OCO-2,2014) (Crisp et al.,2017),have archived the first phase of carbon monitoring from space and improved our understanding of the uncertainties in the global stocktake by analyzing the satellite data (Nassar et al.,2021;Yang et al.,2021b,2023).To meet the application requirements of MVS(Monitoring,Verification and Support) system services,the next generation of GHG monitoring satellites with a wider swath will focus on improving observational coverage,accuracy,and repeatability through satellite constellations such as the Copernicus Anthropogenic CO2Monitoring (CO2M) mission (Kuhlmann et al.,2019),or in an elliptical medium Earth orbit such as that of TanSat-2.Unfortunately,even in this case,cloud and heavy aerosol pollution can greatly impact the validity of sampling (Fig.1) and thus reduce the quality of discrete monitoring of various high-frequency carbon cycle processes(e.g.,traffic emissions or vegetation sinks from photosynthesis).The lack of measurements in complex regions still prevents us from understanding carbon fluxes,especially in cities and industrial areas.

Fig.1.The global cloud optical depth (COD) on 11 August 2021 from TanSat-2 sampling of Earth.The cloud optical depth data are from the MERRA-2 analysis cloud data product (https://disc.gsfc.nasa.gov/datasets/M2T3NVCLD_5.12.4/summary).The blue,yellow,pink and red shading indicates COD <0.3,between 0.3 and 0.5,between 0.5 and 1.0,and >1.0,respectively.The TanSat-2 mission has the potential to measure CO2 with 1 ppm precision when COD is <0.5,but can only obtain valid measurements when COD is <0.3.
To capture signal changes in the variation in CO2concentrations with atmospheric transport,a ground-based network is still necessary as a complement to satellite monitoring.By way of background,studies on carbon sinks in Southwest China show similar results with in-situ and satellite-only measurements in carbon flux inversions (Wang et al.,2020).Recent studies have demonstrated that a “dense”CO2network in an urban setting,e.g.,the Berkeley Environmental Air-quality and CO2Network (BEACO2N) (Shusterman et al.,2016,2018;Delaria et al.,2021),can help to better quantify urban CO2fluxes and verify mitigation strategies (Turner et al.,2016).In China,a low-cost network has been used in traffic measurements in the Beijing–Tianjin–Hebei region (Liu et al.,2021).Also,a new compact sensor with high precision and accuracy that can simultaneously measure multiple gas species (CO2,CH4,N2O and H2O) has emerged recently (Wastine et al.,2022).
In summary,an adaptable network is required to enhance the capacity for measurement collection in limited measurement sites.Benefiting from the rapidly developing field of unmanned aerial vehicles (UAVs),several studies on UAV greenhouse gas measurements have been conducted.Numerous attempts have been made to achieve high-precision measurements of GHG concentrations via UAV-based solutions;for example,a multirotor-drone-mounted active AirCore system (Andersen et al.,2018),a quantum cascade laser-based sensor on a multi-copter drone (Tuzson et al.,2020),a general airborne-capable payload equipped with a SenseAir AB sensor (Kunz et al.,2018),and a Vaisala GMP343 sensor integrated within an unmanned aerial system (Reuter et al.,2021).However,UAV-based in-situ measurements with only single flight per campaign cannot meet the requirements during the detection of complex carbon fluxes.
Considering future carbon monitoring requirements and the disadvantages of either ground-only or UAV-only measurements,we developed a novel measurement-fed-perception self-adaption Low-cost UAV Coordinated Carbon Observation Network (LUCCN) to optimize the information content within a single measurement.The intelligent multi-aircraft flight system in this network will fully exploit the benefits of multiple mobile sensors.
2.The LUCCN system
The LUCCN consists of two main components,including ground-based and UAV-based in-situ measurement.We use a low-cost non-dispersive infrared (NDIR) sensor from Vaisala CarboCap GMP343 in both ground-based and UAV-based instruments.
2.1.Ground-based measurement
At each ground-based station,the sensor is set in a compact and weatherproof enclosure (Fig.2).On the top of each enclosure,we mount a weather station to record the wind field,pressure,temperature,and humidity of the outside environment.Beyond that,the sensor chamber environment is very important for measurement accuracy.A previous low-pressure chamber test indicated significant biases resulting from environmental parameters,including pressure,temperature,and humidity.We therefore developed a bias-correction method to reduce the environment-induced biases,based on the standard corrections from the manufacturer (Vaisala).According to the intercomparison with in-situ measurements at Xianghe station(Picarro G2401 with an online calibration system;WMO standard),the hourly mean results show an RMSE of 0.7 ppm after six months.We also found that the relationship between environmental factors and biases varies for each sensor,with one of the main reasons being that the manufacturing of each specific sensor,but rough manufacturer calibration with coarse sampling in environmental factors might also be another reason.Therefore,we calibrated each sensor and will recalibrate all of them for each year in the future.The Internet of Things (IoT) technique has been used in data transfer,and we developed a database to receive and archive the measurement data.For data security considerations,the database software can be used for each local network without centralized storage.The power supply requirement is less than 5 W,which allows us to use solar panels instead of electric cables in extreme environments.We also optimized the closure design for alternative mounting requirements.

Fig.2.Photos of the campaign in Shenzhen.The left-hand panel shows the ground-based station near the power plant,with an NDIR sensor in the enclosure.The right-hand panel shows a swarm of drones for coordinated observation.
2.2.UAV-based measurement
A payload prototype mounting UAV has been introduced in a previous study (Zhao et al.,2022).In the LUCCN system,we continually use the Vaisala CarboCap GMP343 sensor but make light-weight modifications.The current LUCCN prototype uses two models of small quadcopter UAVs including the DJI Matrice 300 and DJI M30.We tested the M30-compatible lightweight payload by comparing simultaneous flights with the original GMP343 sensor carried by the Matrice 300.The M30-compatible payload was able to achieve similar in-flight accuracy.To implement LUCCN’s flight control for efficient data collection,we use a message queuing telemetry transport server as the IoT infrastructure for simultaneous low-latency message streamlining.Therefore,large quantities of messages containing flight commands and atmospheric measurements are exchanged at 1 Hz frequency.Before each flight command message is sent,we use a customized three-dimensional M*algorithm for efficient flight trajectory planning to avoid collisions between UAVs and static obstacles.M* is a multi-robot path planning algorithm adapted from the standard A* algorithm for optimal trajectory discovery (Wagner and Choset,2011).In essence,the system will make flight decisions autonomously after the first exploratory flight mission according to the collected information on gas concentrations,wind directions,ground topologies,and C2 (Control and Command) link conditions.
3.First integrated campaign in China
A prototype of the LUCCN system,including five ground-based stations and four UAVs,joined the integrated TanSat-2 mission ground system campaign in Shenzhen,China (Fig.3).This is the first campaign that mainly focuses on power stations to test prospective techniques to validate TanSat-2 measurements and potential future developments on ground-based measurements.A 1050 MW gas power station (three generators with 80-m height stacks,but only two running when the campaign took place),known as the SEG power plant,was selected as the campaign target.The campaign lasted three days from 4 to 6 May 2023 in eastern Shenzhen.Five ground-based CO2stations have been set up around emission sources that record the signal from the south (stations 1 and 3),east (station 5),and northwest (stations 2 and 4).The gas power plant is located in southern China and very close to the coastline of the South China Sea,and the wind direction is controlled by a traditional land and sea breeze in a daily cycle.The gas power plant is in the rural area east of Shenzhen city,and hence its emissions are not influenced by other strong anthropogenic emissions from elsewhere in the city.

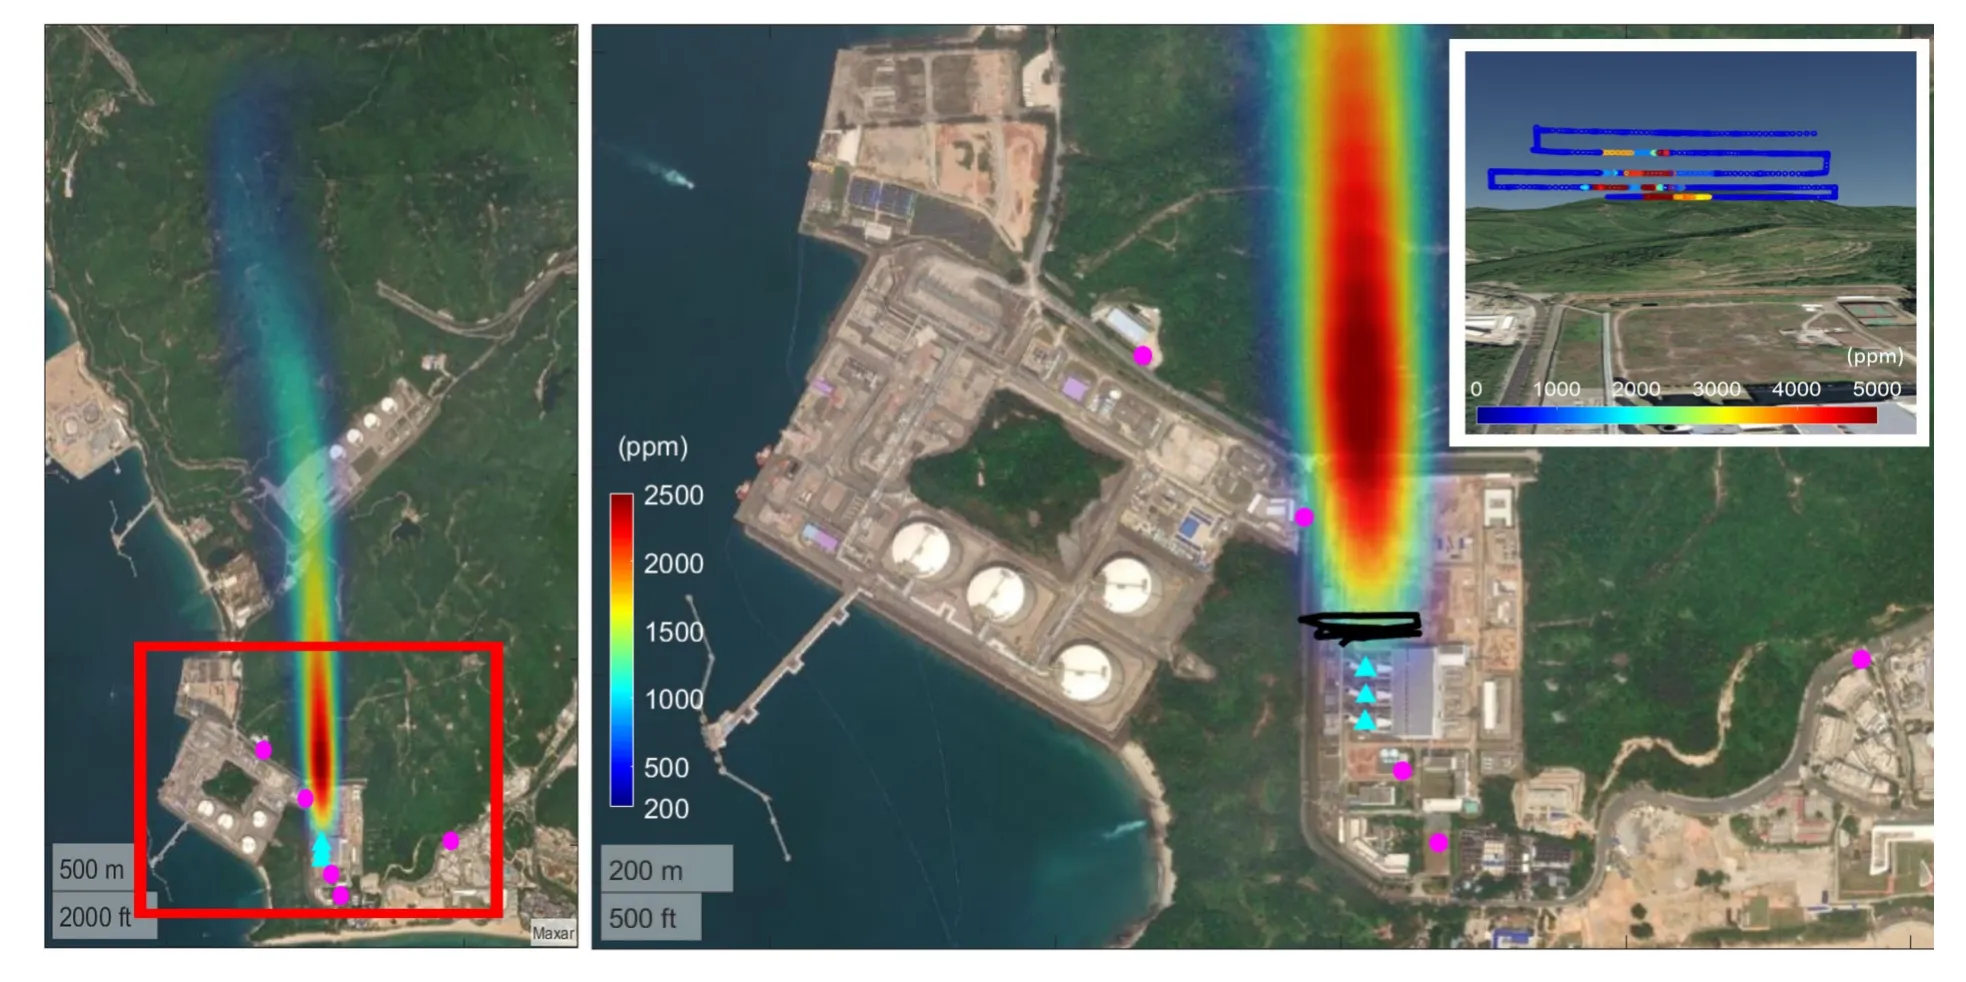
Fig.3.Plume simulation and observation of the campaign.The left-hand panel is a schematic overview of the campaign in the SEG power plant.The base map is a satellite image provided by Esri.The cyan triangles on the map indicate the locations of the power plant’s stacks,and the magenta dots indicate the ground-based observation sites.The right-hand panel is a zoomed-in view of the red framed area in the left-hand panel.The flight trajectory of the UAV is indicated by the black line,with the pre-simulated plume enhancements superimposed for reference.The cross section of the CO2 plume is shown in the top-right corner of the right-hand panel,which is captured by the UAV during the flight owing to the close distance to the point source and the favorable wind direction.
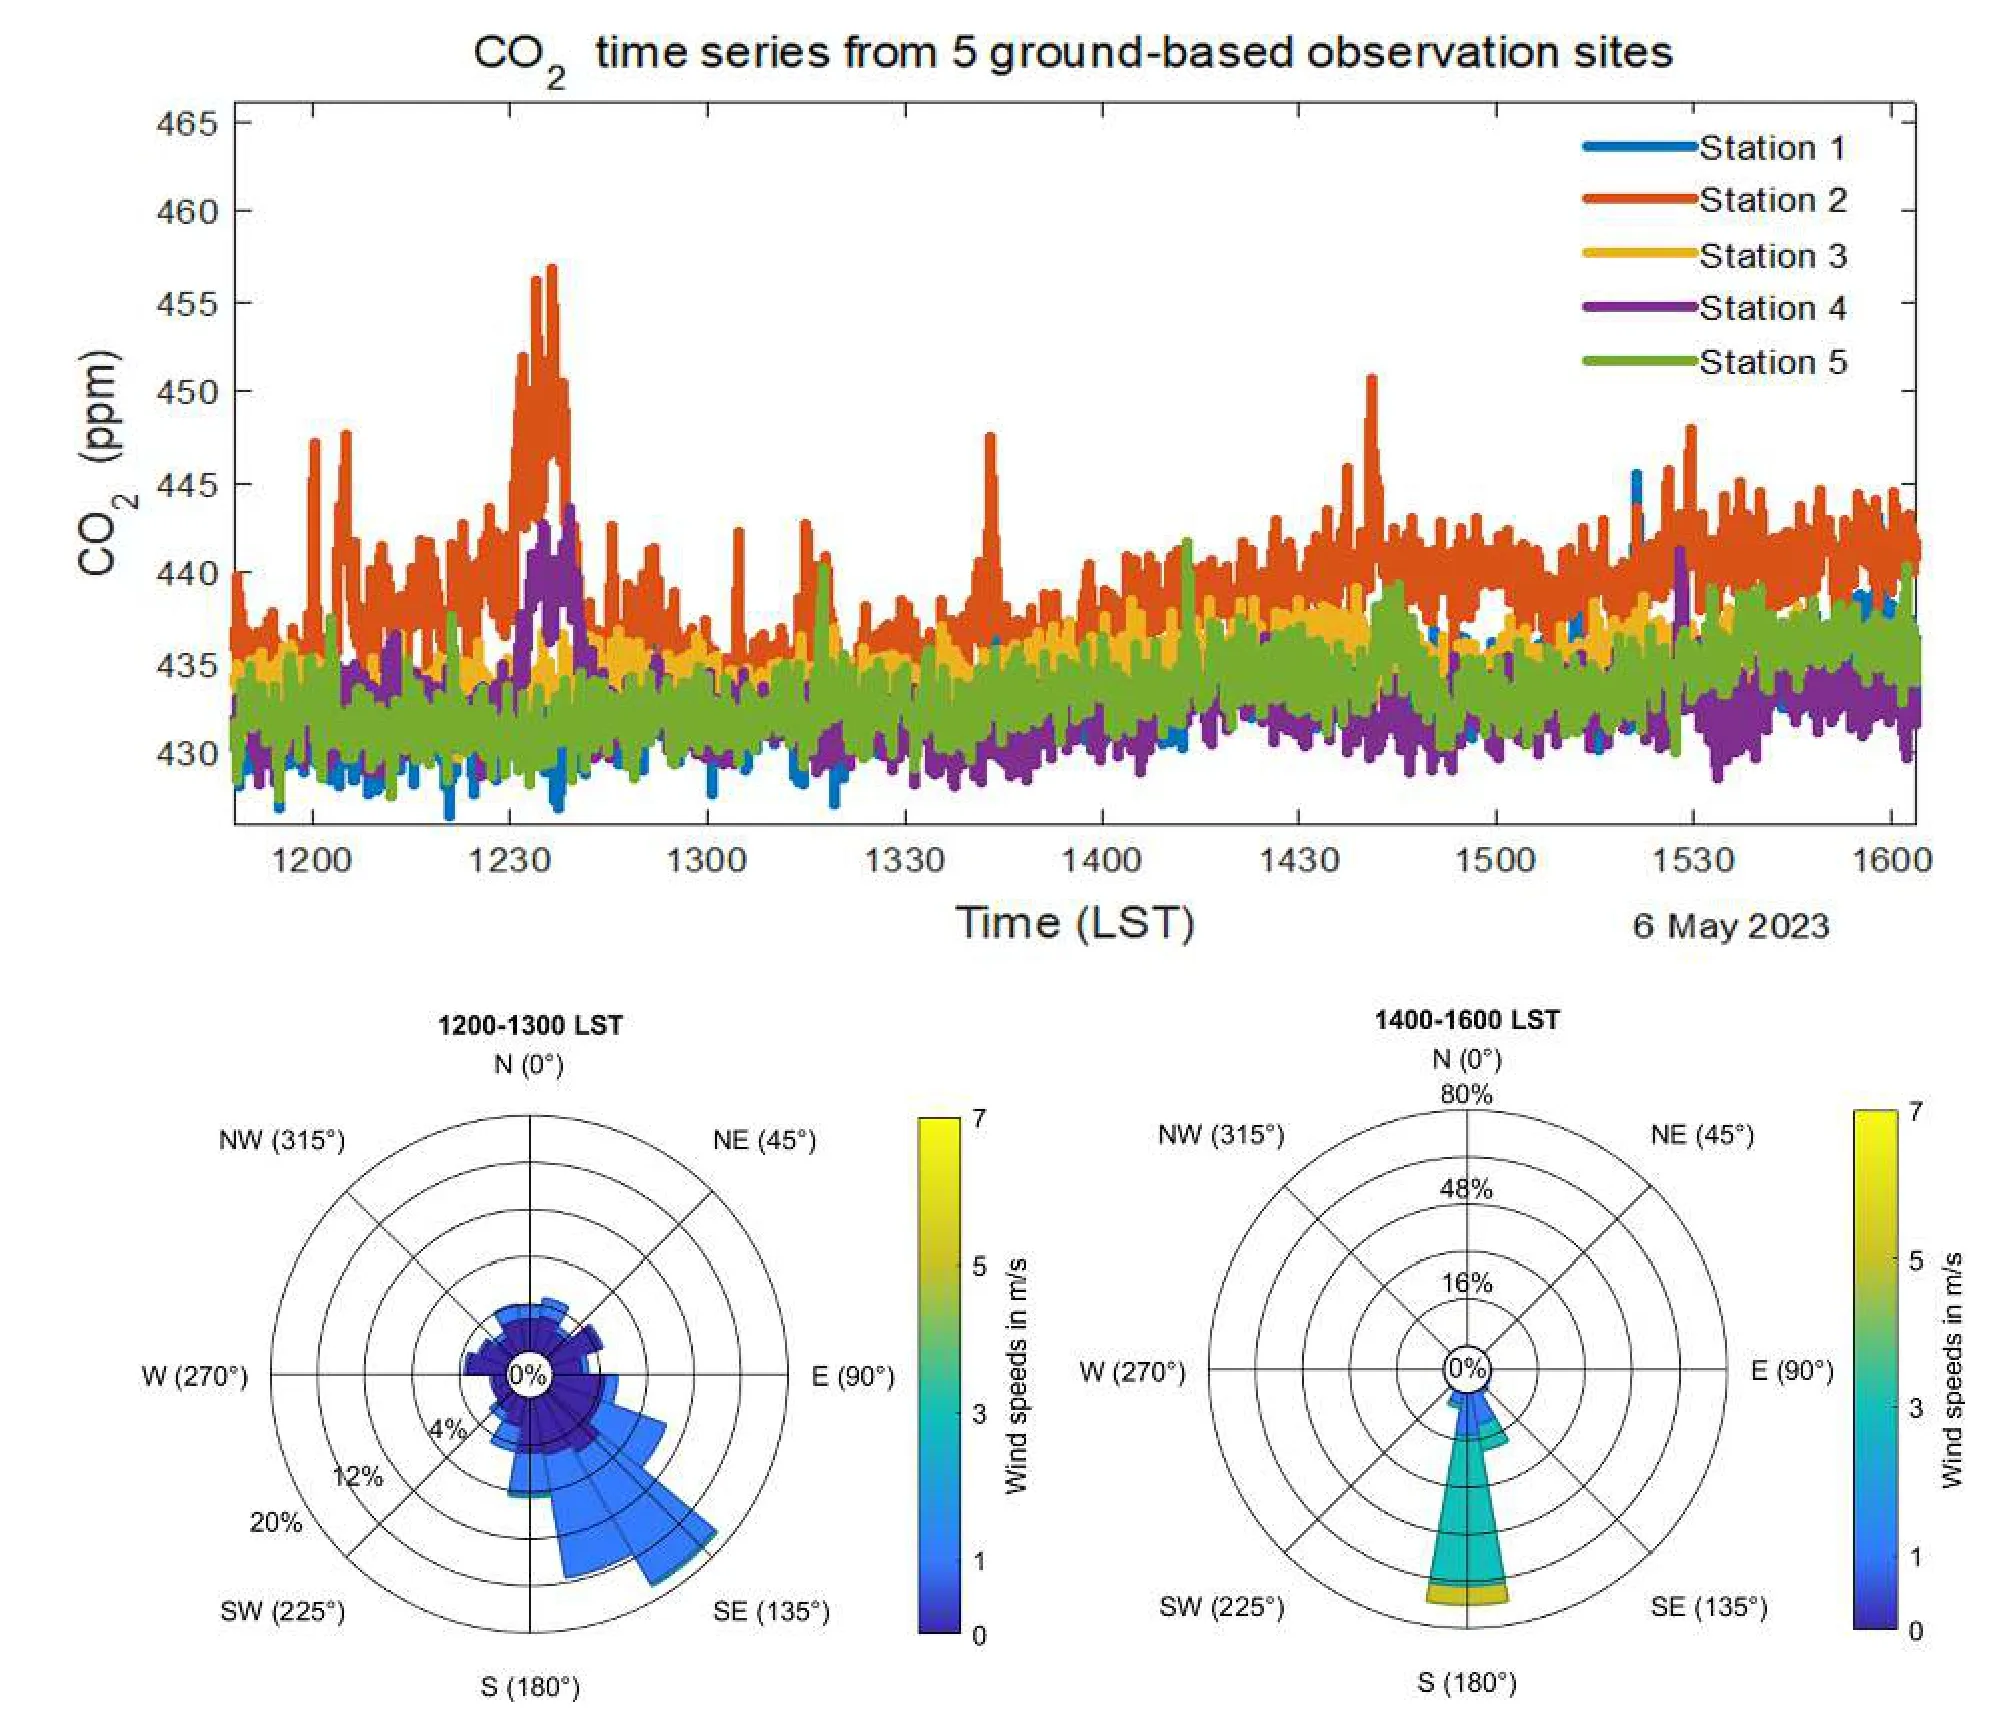
Ground-based measurements were set up around the power station.On 6 May 2023,we found that the ground-based measurements captured the enhancement during 1200–1245 LST (LST=UTC+8),which was verified by the concurrent wind direction observations (Fig.4).The enhancement was 5–25 ppm when compared with background measurements from other stations.Unfortunately,this was the only signal the ground-based measurements captured during the whole campaign.On the other hand,the UAV measured cross sections of the plume with the help of the CO2transportation forecasted by WRF-LES (run on a 66-m grid) (Fig.3) and the wind direction (Fig.5).The flight path was planned according to the forecast of CO2transportation with minor adjustments before the flight.In this campaign,we only tested our UAV system in crosssectional flights owing to the CO2concentration enhancements being easily observable.

Fig.4.The top panel illustrates the CO2 time series from five ground-based observation sites.The bottom panels (left and right) show the wind field near the point source during 1200–1300 LST and 1400–1600 LST,respectively.Site 2 was located downwind of the point source and the CO2 enhancement signal was observed during both periods.A synchronous CO2 enhancement was observed at sites 2 and 4 at around 1230 LST.
The emission flux was calculated from a well-known cross-sectional flux (CSF) method,which is mainly used to estimate emissions from in-situ observations (Conley et al.,2016) and has been applied in emission quantification with GHG column measurements from satellites (Varon et al.,2018) and aircraft (Krings et al.,2011).For in-situ measurement,the emission fluxQis formulated as
whereU(x,y,z)is the horizontal wind speed and ∆Ω(x,y,z) is the concentration enhancement in g m-3,in which thex-axis is defined by the wind direction (northerly by convention for our time-averaged plumes),they-axis is perpendicular to the wind direction,and thez-axis is upwards along the plume transect.The integral is computed between the plume boundaries[a,b] defined by the plume mask.This computation can be done at multiple downwind distancesxto improve the estimation ofQthrough averaging.In this experiment,we measured the CO2concentration and wind synchronously during the flight and calculated the emission flux approximately through discrete summation.Here,we compare the estimated emission flux with the Open-Data Inventory for Anthropogenic Carbon dioxide (ODIAC) data (Table 1),which computes emissions mainly from artificial light during nighttime.The CSF method provides marginally higher result than ODIAC.We found that the errors were mainly due to the lack of sampling in cross sections of the plume,which is the current disadvantage of UAV in-situ measurements.Atmospheric inversion is a good choice to avoid this problem,and this is our further plan in tracking anthropogenic emission,but this is far beyond the scope of this study and will be discussed in future work.

Table 1.Emission rate estimation of the target gas power plant.
4.Outlook
Sustainable economic development requires a reduction in carbon emissions for climate change mitigation whilst maintaining general productivity.Refined carbon management is one of the important ways to reduce wastage in energy consumption and resources.Accurately knowing the status of carbon emissions is a prerequisite for advanced governance.In line with our expectations,the next generation of TanSat missions (TanSat-2) will provide a high-resolution,full-coverage measurement,even at the urban scale.However,the near-infrared detection technique cannot avoid cloud contamination,and in this respect the LUCCN will provide more detailed measurements of local carbon emissions and even ecosystem carbon cycle processes.In this paper,we introduce our first integration campaign held in Shenzhen,China.The detection system was helpful to investigate the local carbon cycle in a very small-scale region.We found that ground-based measurements could barely capture the signal from an emission source located in a high position;hence,UAV-based measurement was helpful in this case.Beyond that,we are now developing a measurement-fed-perception self-adaption network strategy for the LUCCN system,which will improve the monitoring efficiency of information content.In summary,satellite remote sensing combined with near-ground measurement is required in the future,and the measurement efficiency is the key to improving our knowledge of carbon cycles in the earth system.
Acknowledgements.This work was supported by the National Key Research and Development Plan (Grant No.2021YFB3901000),the Chinese Academy of Sciences Project for Young Scientists in Basic Research (YSBR-037),the International Partnership Program of the Chinese Academy of Sciences (060GJHZ2022070MI),and the MOST-ESA Dragon-5 Programme for Monitoring Greenhouse Gases from Space (ID.59355).The authors thank the Finland–China Mobility Cooperation Project funded by the Academy of Finland (No.348596).
杂志排行
Advances in Atmospheric Sciences的其它文章
- A Quasi-Linear Relationship between Planetary Outgoing Longwave Radiation and Surface Temperature in a Radiative-Convective-Transportive Climate Model of a Gray Atmosphere
- Consistency of Tropospheric Water Vapor between Reanalyses and Himawari-8/AHI Measurements over East Asia
- Added Benefit of the Early-Morning-Orbit Satellite Fengyun-3E on the Global Microwave Sounding of the Three-Orbit Constellation
- Synergistic Interdecadal Evolution of Precipitation over Eastern China and the Pacific Decadal Oscillation during 1951–2015
- Diagnosis of the Kinetic Energy of the “21·7”Extreme Torrential Rainfall Event in Henan Province,China
- Simulation of the Ecosystem Productivity Responses to Aerosol Diffuse Radiation Fertilization Effects over the Pan-Arctic during 2001–19
