Body composition and metabolic syndrome in patients with type 1 diabetes
2024-01-26QiongZengXiaoJingChenYiTingHeZeMingMaYiXiWuKunLin
Qiong Zeng,Xiao-Jing Chen,Yi-Ting He,Ze-Ming Ma,Yi-Xi Wu,Kun Lin
Abstract BACKGROUND In recent years,the prevalence of obesity and metabolic syndrome in type 1 diabetes (T1DM) patients has gradually increased.Insulin resistance in T1DM deserves attention.It is necessary to clarify the relationship between body composition,metabolic syndrome and insulin resistance in T1DM to guide clinical treatment and intervention.AIM To assess body composition (BC) in T1DM patients and evaluate the relationship between BC,metabolic syndrome (MS),and insulin resistance in these individuals.METHODS A total of 101 subjects with T1DM,aged 10 years or older,and with a disease duration of over 1 year were included.Bioelectrical impedance analysis using the Tsinghua-Tongfang BC Analyzer BCA-1B was employed to measure various BC parameters.Clinical and laboratory data were collected,and insulin resistance was calculated using the estimated glucose disposal rate (eGDR).RESULTS MS was diagnosed in 16/101 patients (15.84%),overweight in 16/101 patients (15.84%),obesity in 4/101 (3.96%),hypertension in 34/101 (33.66%%) and dyslipidemia in 16/101 patients (15.84%).Visceral fat index (VFI) and trunk fat mass were significantly and negatively correlated with eGDR (both P < 0.001).Female patients exhibited higher body fat percentage and visceral fat ratio compared to male patients.Binary logistic regression analysis revealed that significant factors for MS included eGDR [P=0.017,odds ratio (OR)=0.109],VFI (P=0.030,OR=3.529),and a family history of diabetes (P=0.004,OR=0.228).Significant factors for hypertension included eGDR (P < 0.001,OR=0.488) and skeletal muscle mass (P=0.003,OR=1.111).Significant factors for dyslipidemia included trunk fat mass (P=0.033,OR=1.202) and eGDR (P=0.037,OR=0.708).CONCLUSION Visceral fat was found to be a superior predictor of MS compared to conventional measures such as body mass index and waist-to-hip ratio in Chinese individuals with T1DM.BC analysis,specifically identifying visceral fat (trunk fat),may play an important role in identifying the increased risk of MS in non-obese patients with T1DM.
Key Words: Body composition;Metabolic syndrome;Insulin resistance;Visceral fat;Estimated glucose disposal rate
INTRODUCTION
Individuals with type 1 diabetes (T1DM) are particularly susceptible to cardiovascular (CV) metabolic risk factors[1],including overweight or obesity,hypertension,dyslipidemia,and insulin resistance,which,over time,contribute to additional CV complications[2,3].CV disease (CVD) accounts for a substantial proportion of the increased mortality rate in T1DM patients,exceeding three times the rate observed in the general population[4].Notably,T1DM patients experience a higher incidence of CVD at a younger age compared to their non-diabetic counterparts[5,6].Recent research has shed light on the escalating prevalence of overweight and insulin resistance within the T1DM population[7],resulting in the coexistence of T1DM and metabolic syndrome (MS)-a condition also known as “double diabetes”[8].This dual diagnosis has been associated with heightened CV risk[9] and renal disease[10].Regrettably,MS in T1DM has not received commensurate research attention as its counterpart in type 2 diabetes (T2DM).Considering that CVD remains the primary cause of decreased life expectancy in T1DM[11],urgent consideration is warranted for the implementation of strategies targeting insulin resistance-related characteristics in T1DM management.A comprehensive understanding of the insulin resistance status among T1DM patients holds paramount clinical significance as it can guide treatment interventions effectively.
The body mass index (BMI) is commonly used to assess obesity;however,it does not accurately measure adiposity and fails to capture the distribution of body composition (BC),including fat mass and non-fat mass[12].In individuals with diabetes,especially those with a normal BMI,the accumulation of adipose tissue,particularly in the abdominal region,is closely associated with insulin resistance and MS.Muscle mass also plays a significant role in overall health and metabolic regulation,Skeletal muscle accounts for up to 80% of glucose disposal[13].Evaluating BC provides valuable insights into metabolic risks and facilitates effective disease management[14].Dual-energy X-ray absorptiometry (DEXA) and bioelectrical impedance analysis (BIA) are commonly used techniques for BC assessment.While DEXA is considered the gold standard for measuring fat and lean mass,its use is limited to research settings due to equipment costs,radiation exposure,and lack of portability.In contrast,BIA is a practical,non-invasive,and easily applicable tool.BIA demonstrates comparable accuracy to magnetic resonance imaging scanning in predicting MS and offers the advantages of radiation-free measurement,cost-effectiveness,and wider applicability[15,16].In this study,we employed BIA to assess BC in patients with T1DM and investigate the relationship between BC,MS,and insulin resistance.
MATERIALS AND METHODS
Study population
This cross-sectional study included patients diagnosed with T1DM from July 2021 to June 2023.The participants were recruited from the Department of Endocrinology and Metabolism at the First Affiliated Hospital of Shantou University Medical College.Some of the patients were originally part of our center's 3C follow-up cohort[17,18].The inclusion criteria for this study were: (1) Clinical confirmation of T1DM;(2) age of 10 years or older;(3) informed consent;and (4) disease duration of more than 1 year.The exclusion criteria were: (1) Other types of diabetes;(2) severe hepatic or renal dysfunction;(3) acute stress conditions such as infection,inflammation,or tumors;and (4) pregnancy.This study was approved by the First Affiliated Hospital of Shantou University Medical College,and all participants provided signed informed consent.The study was conducted in accordance with the principles outlined in the Helsinki Declaration guidelines.
Data collection and physical examination
The demographic and clinical data of the enrolled patients were obtained through electronic medical record queries and on-site data collection.This included information such as gender,age,age of onset,family history of diabetes,smoking and alcohol history,daily insulin dosage,insulin treatment regimen,and presence of diabetes-related antibodies at the time of onset (GADA,IAA,ICA,and ZnT8A).The physical examination included measurements of height,weight,waist circumference,hip circumference,and blood pressure (BP).
Laboratory analyses
Laboratory analyses were conducted by collecting fasting blood samples to measure levels of glycated hemoglobin (HbA1c),fasting plasma glucose (FPG),lipid profile,creatinine,and uric acid (UA)[19].HbA1c concentration was determined using a high-performance liquid chromatography technique (BIO-RAD D100,United States).High-density lipoprotein cholesterol (HDL-C) (CHOL),low-density lipoprotein (LDL) CHOL,total CHOL,and triglyceride (TG),creatinine,and UA were determined using an automatic biochemical analyzer (COULTER LX20;BECKMAN,United States).
BIA
BIA was conducted using the Tsinghua-Tongfang BC Analyzer BCA-1B to measure various BC parameters in all study participants[20].Prior to the measurement,participants were instructed to clean their hands and feet and stand still on the device with their arms extended laterally at approximately a 30° angle.They were asked to tightly grip the handles,remain motionless,and refrain from speaking during the measurement.The test duration was 40 s.
The BIA measurement provided valuable information on BC indicators,including muscle mass,fat mass,protein mass,lean body weight,body water content,bone mass,muscle mass in different body regions,fat mass in different body regions,water content,body fat percentage,and visceral fat index (VFI).VFI represents the level of visceral fat and is calculated by the analysis software based on the scanning results of the size of the fat area around the visceral area.The calculation method for VFI is as follows: VFI=visceral fat area (cm2) divided by 10cm2.
The definition of MS
According to specific Chinese Diabetes Society (CDS) criteria[21],MS is diagnosed when at least 2 out of 4 criteria are met: central obesity (a prerequisite for the age group < 18 years),hypertension,elevated TG levels,or decreased HDL-C levels.
In patients aged ≥ 18 years,overweight is defined as a BMI of 24-28 kg/m²,and obesity is defined as a BMI > 28 kg/m².Central obesity is defined as a waist circumference ≥ 90 cm for men and ≥ 85 cm for women,regardless of BMI.Hypertension is defined as repeated BP measurements ≥ 130/85 mmHg or the use of antihypertensive medications for diagnosed hypertension.Dyslipidemia is characterized by TG levels ≥ 1.70 mmol/L,HDL-C levels < 1.04 mmol/L,or the use of specific treatments for these lipid abnormalities.
In patients aged < 18 years,overweight and obesity are defined as a BMI ≥ 85% and 95%,respectively,adjusted for age and sex.Central obesity is defined as a waist circumference ≥ the 90thpercentile for age and sex.According to the 2017 criteria,hypertension is defined as BP ≥ the 95thpercentile for age,sex,and height.Dyslipidemia is indicated by TG levels ≥ 1.47 mmol/L or HDL-C levels < 1.03 mmol/L.
The calculation of insulin resistance
The calculation of insulin resistance is determined by estimating the glucose disposal rate (eGDR) based on the Epidemiology of Diabetes Complications study conducted in Pittsburgh[22].The eGDR is calculated using the formula: eGDR=24.31 -[3.29 × hypertension status (1 if present;0 if absent)] -[12.22 × waist-to-hip ratio] -[0.57 × HbA1c (%)].A lower eGDR value indicates a higher level of insulin resistance.
Statistical analysis
Statistical analysis was performed using SPSS 19.0.The measurement data were presented as the mean ± standard deviation,and the numeration data were expressed as ratio or constituent ratio.Independentt-tests (for continuous variables) or chi-square tests (for categorical variables) were employed to compare differences between groups.The correlation between variables (for continuous variables) was assessed using the Pearson correlation test.Forward conditional binary logistic regression analysis was used to find the independent risk factors for metabolic syndrome,hypertension and dyslipidemia.The logistic regression model included the following variables: Sex,age,duration,BMI,waist-hip ratio,family history of diabetes,eGDR,insulin dose,skeletal muscle mass,VFI and trunk fat mass.Statistical significance was set atP< 0.05.
RESULTS
The study included 101 Han Chinese individuals with T1DM,ranging in age from 11 to 62 years.The mean age of the participants was 30.97 ± 15.43 years,and the mean duration of T1DM was 11.35 ± 8.66 years.Among the participants,16/101 (15.84%) were diagnosed with MS,16/101 (15.84%) were overweight,4/101 (3.96%) were obese,34/101 (33.66%) had hypertension,and 16/101 (15.84%) had dyslipidemia.
The clinical characteristics of the subjects with and without MS are summarized in Table 1.There were no significant differences in age,duration of T1DM,sex,insulin regimen,insulin dosage,hypoglycemia frequency,FPG,and HbA1c between the groups.However,individuals with MS had significantly higher systolic BP (SBP),diastolic BP (DBP),BMI,waist circumference,HDL,LDL,TG,CHOL and UA levels compared to those without MS.The MS group also had a higher proportion of individuals with a positive family history of diabetes (68.75%vs.20%,P< 0.001) and lower estimated glucose disposal rate (eGDR) (4.02 ± 0.87vs.8.42 ± 1.88,P< 0.001).

Table 1 Clinical characteristics of type 1 diabetes with and without metabolic syndrome
Gender-specific differences in BC were observed and classified into four groups based on gender and the presence or absence of MS (Table 2).Regardless of gender,individuals with MS had significantly higher fat,bone,protein,water and skeletal muscle mass,compared to those without MS.In male patients,there were higher values of lean body mass,bone mass,protein content,and water content compared to female patients.Conversely,female patients had higher values of VFI,fat mass,and trunk fat mass compared to male patients.
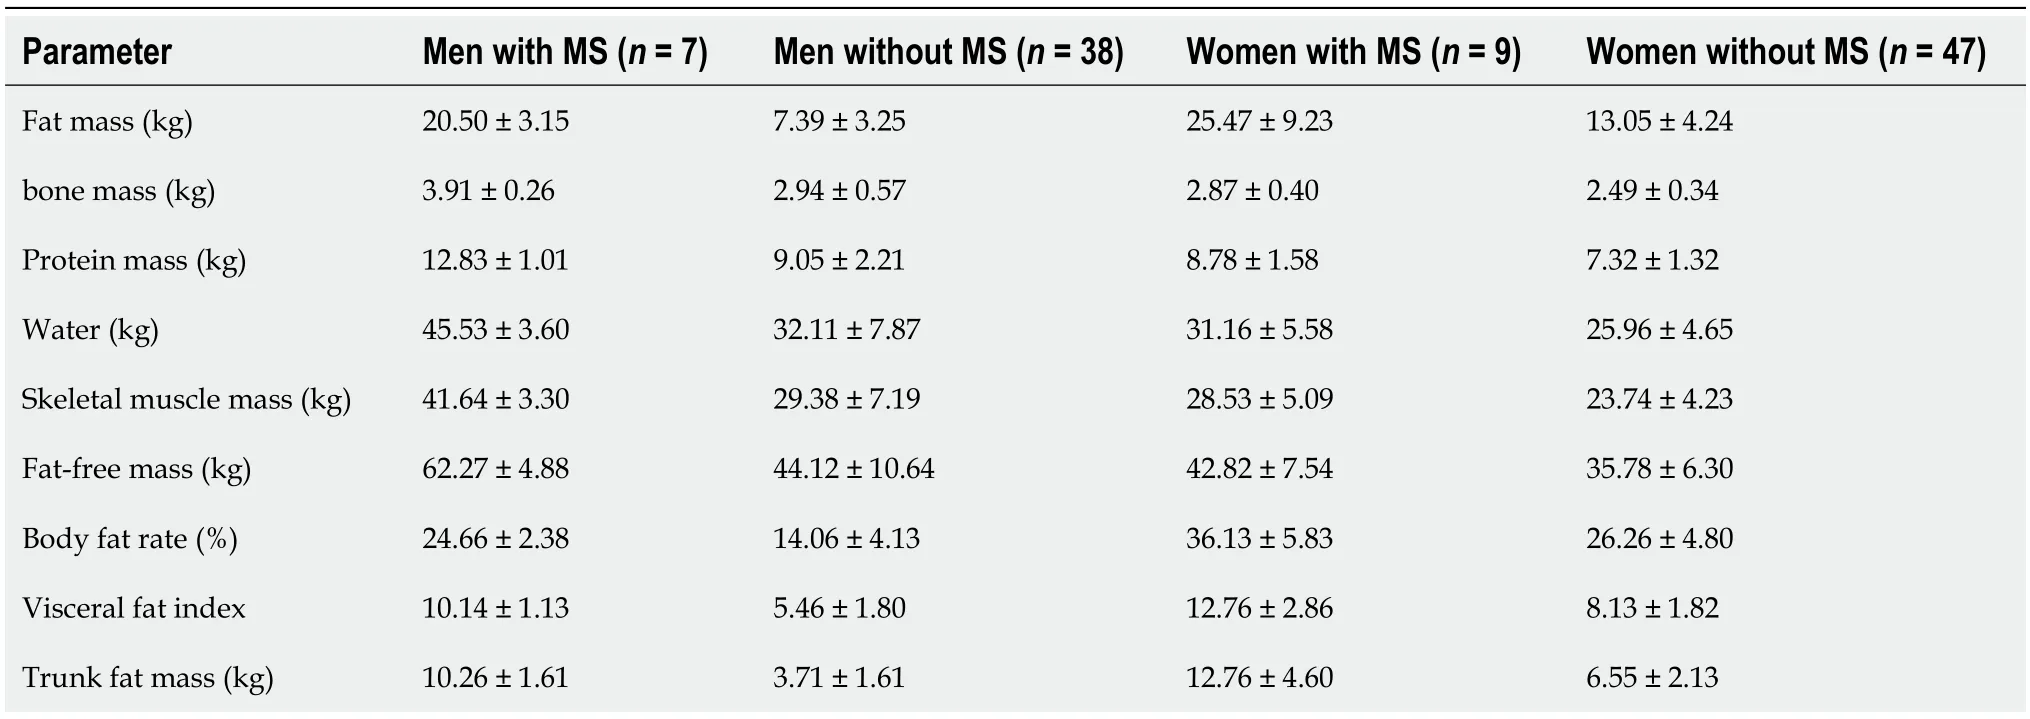
Table 2 Comparison of body composition parameters between women and men in type 2 diabetes with and without metabolic syndrome
Correlation analyses among composition parameters and clinical variables are shown in Table 3 and Figure 1.Both VFI and trunk fat mass were significantly and negatively correlated with eGDR (r=-0.486,P< 0.001,andr=-0.503,P< 0.001,respectively).The VFI and trunk fat mass were positively correlated with age,duration of T1DM,LDL,TG,while the skeletal muscle mass was significantly positively correlated with age,SBP,DBP,HDL,and UA.In this study,no significant associations were found between VFI,trunk fat mass,skeletal muscle mass and HbA1c levels or insulin dosage.
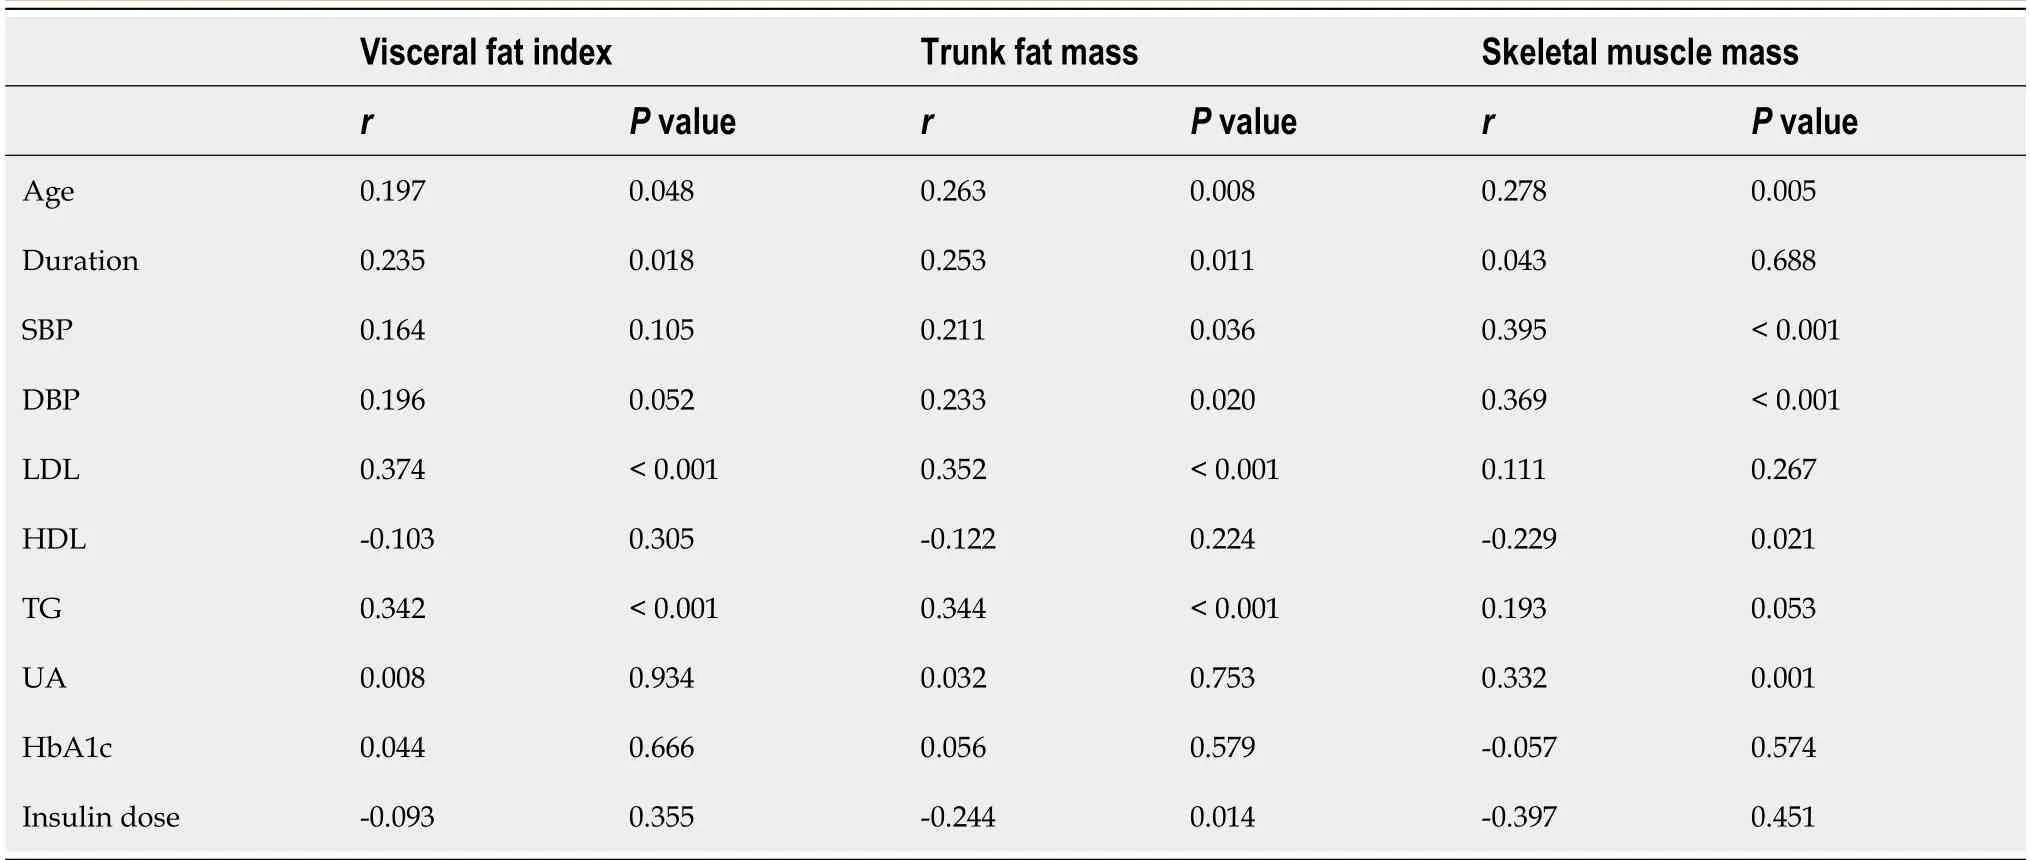
Table 3 Correlation analysis between body composition parameters and clinical variables in type 1 diabetes
To determine the independent factors associated with MS,hypertension,and dyslipidemia,a binary logistic regression analysis was performed using the forward conditional method,and the results are presented in Table 4.The analysis revealed that for MS,the significant factors included eGDR (P=0.017,OR=0.109),VFI (P=0.030,OR=3.529),and a family history of diabetes (P=0.004,OR=0.228).For hypertension,the significant factors were eGDR (P< 0.001,OR=0.488) and skeletal muscle mass (P=0.003,OR=1.111).Regarding dyslipidemia,the significant factors were trunk fat mass (P=0.033,OR=1.202) and eGDR (P=0.037,OR=0.708).

Table 4 Risk factors for metabolic syndrome,hypertension and dyslipidemia in binary logistic regression (forward conditional)
DISCUSSION
This cross-sectional study focused on a population of Chinese individuals with T1DM,characterized by a relatively low BMI and an obesity rate of only 3.96%.The study findings revealed several noteworthy observations: Female patients exhibited higher body fat percentage and visceral fat ratio compared to male patients;VFI and trunk fat showed a significant negative correlation with eGDR;Notably,visceral fat emerged as a superior predictor of MS compared to conventional measures like BMI and waist-to-hip ratio;VFI,eGDR,and a family history of diabetes were identified as independent risk factors for MS;skeletal muscle mass showed a significant positive correlation with BP and emerged as an independent risk factor for hypertension.These findings contribute to our understanding of the relationship between BC,insulin resistance,and MS in individuals with T1DM,particularly in the Chinese population.
Over the past 15 years,there has been a growing interest in examining the impact of BC in patients with T1DM,particularly in studies conducted in Europe since 2003.During this time,there has also been an observed increase in obesity rates among individuals with T1DM[23].Currently,studies consistently show an upward trend in obesity and the prevalence of MS among patients with T1DM.However,reported incidence rates vary across different regions,ranging from 3% to 50%[24,25].In this study,we found a prevalence rate of 15.84% for MS and 3.96% for obesity among T1DM patients.The prevalence of MS in T1DM is lower than in the general Chinese population and the most Caucasus population[25,26].Our findings align with similar studies conducted in Japan[27].Importantly,while the prevalence of MS in the presented study is lower than in the general Chinese population,there is still a noticeable increase compared to data collected from our center a decade ago.Specifically,during our center's participation in the IDF-CDS 3C study in 2011-2012,the prevalence of MS among Chinese individuals with T1DM was reported as 10.1%[28].
The explanation for the increasing trend of obesity and MS in patients with T1DM is multifaceted.The rise in overweight and obesity rates can be attributed to factors such as the anabolic effects of insulin therapy or increased calorie intake due to hypoglycemia episodes[2,29].Studies,such as the Diabetes Control and Complications Trial (DCCT),have shown that patients undergoing intensified insulin therapy experience weight gain over time compared to those on conventional treatment[30].However,in our study,we did not find any significant associations between insulin dosage,treatment regimen,and BC variables such as weight,BMI,and visceral fat.Similarly,no correlations were observed between hypoglycemia frequency and measures of weight,BMI,or visceral fat.While the DCCT study suggested a tradeoff between intensified glycemic control and insulin-induced adipogenesis[31],the Epidemiology of DiabetesInterventions and Complications (EDIC) study indicated that the negative effects of weight gain on CVD risk were minimal when considering the overall benefits of improved glycemic control[32].Additionally,the EDIC study,with a follow-up period of 17 years,demonstrated that intensified insulin therapy significantly reduced the risk of CVD events and mortality[33].Therefore,our perspective aligns with the notion that the impact of intensified glycemic control on factors like visceral fat is relatively modest.Considering the significant protective effects against microvascular complications and the substantial benefits for CVD,the potential risks associated with weight gain do not warrant significant changes in our clinical approach to intensified treatment strategies.
Our findings indicate that visceral fat content is an independent risk factor for MS in individuals with T1DMs.Visceral fat,as opposed to subcutaneous fat,plays a primary role in insulin resistance and related metabolic disorders[34].Interestingly,in our study,BMI and waist-to-hip ratio did not prove to be optimal measures of insulin resistance in T1DMs patients.This may be due to their focus on weight-to-height ratio and waist and hip circumference without considering the specific quantity of abdominal fat or body muscle composition.Our research suggests that analyzing BC,specifically identifying visceral fat (trunk fat),may be crucial for identifying the increased risk of MS in T1DM patients,particularly those who are non-obese.Although routine assessment of BC was not recommended in diabetes carestandards[35],analyzing BC may provide valuable information for disease management[14].
In our study,we observed that female patients with T1DM had higher rates of overweight,body fat percentage,and visceral fat ratio compared to male patients,which is consistent with findings from several studies conducted internationally.For instance,Krishnanet al[36] found that female adolescents with T1DM exhibited a more centralized fat distribution.Similarly,a Swedish study reported that girls with diabetes had higher body weight and BMI than boys[37].Additionally,A Szadkowskaet al's research indicated that women with diabetes were more susceptible to developing abdominal obesity compared to women in the control group[38].These gender disparities may be attributed to sexual dimorphism in insulin resistance and growth hormone levels[39].Given these findings,it is crucial to prioritize and implement early interventions targeting obesity and metabolic issues in female patients with T1DM.
This study also identified a family history of diabetes as an independent risk factor for the development of MS in individuals with T1DM.It has been observed that individuals with both T1DM and MS have a higher prevalence of a family history of T2DM[40].These individuals demonstrate a lower frequency of major histocompatibility complex genes and a stronger association with genes that contribute to the risk of T2DM[41-43].The DCCT study found that individuals with a family history of T2DM had higher rates of T2DM,weight gain,central fat distribution,waist circumference,insulin dose,and severity of dyslipidemia compared to those without a family history of T2DM[44].This may be due to the expression of T2DM susceptibility genes in this population.The study suggests that individuals with T1DM and a family history of T2DM or obesity may experience greater weight gain and the appearance of other features associatedwith MS when receiving intensified insulin therapy.Therefore,it is crucial to give increased attention to individuals with a family history of T2DM among those with T1DM in clinical practice.Close monitoring and stricter surveillance should be implemented to reduce their risk of developing MS or "dual diabetes".
An unexpected finding of this study is the positive correlation between skeletal muscle mass and BP in individuals with T1DM.Traditionally,the impact of diabetes on skeletal muscle has received less attention compared to adipose tissue.Studies have indicated structural and metabolic impairments in muscle mass,as well as decreased muscle function in individuals with T1DM.However,there is limited research on the correlation between skeletal muscle and BP.Data on whole-body DXA measurement from the National Health and Nutrition Examination Survey showed that total fat mass,total muscle mass,and trunk fat mass significantly and positively associated with BP.Among them,total muscle mass made relatively great contribution (35%-43%) to SBP[45].Another study published in Hypertension in 2017 demonstrated a correlation between reduced skeletal muscle attenuation and incident hypertension in African American men[46].The underlying mechanisms linking skeletal muscle and hypertension remain unclear,but it is speculated that infiltration of intramuscular adipose tissue may play a role.Insulin resistance is considered a direct regulator in the complex interplay between skeletal muscle obesity and hypertension[47],although other indirect mechanisms such as inflammation or oxidative stress may also be involved[47,48].Skeletal muscle accounts for up to 80% of glucose disposal.Further research is needed to investigate the underlying mechanisms and conduct larger-scale population studies to explore this relationship in more detail.
This study has several limitations.Firstly,it is a cross-sectional study,which means that the results can only suggest correlation and not establish causation.Secondly,the sample size of the study is relatively small,which may introduce sample bias and limit the statistical power.Larger-scale studies are needed to further investigate these findings.
CONCLUSION
Visceral fat emerged as a superior predictor of MS compared to conventional measures like BMI and waist-to-hip ratio in Chinese T1DM patients.VFI,eGDR,and a family history of diabetes were identified as independent risk factors for MS.BC analysis,specifically identifying visceral fat (trunk fat),may be important in identifying the increased risk of MS in patients with T1DM,particularly those who are non-obese.
ARTICLE HIGHLIGHTS
Research background
At present,the mechanism of insulin resistance in patients with type 1 diabetes (T1DM) is not completely clear;The reasons for the increase in obesity and metabolic syndrome in T1DM patients are also unclear.Clarifying the relationship between body composition,metabolic syndrome and insulin resistance is of great significance for the implementation of strategies targeting insulin resistance-related characteristics in T1DM management.
Research motivation
In this study,we employed bioelectrical impedance analysis (BIA) to assess body composition (BC) in patients with T1DM and investigate the relationship between BC,metabolic syndrome (MS),and insulin resistance.
Our study contribute to our understanding of the relationship between BC,insulin resistance,and MS in individuals with T1DM,particularly in the Chinese population.
Another important significance of the study is to verify that BC studies,specifically detecting visceral fat (trunk fat),may be useful in recognizing the elevated risk of MS in non-obeseT1DM patients.
Research objectives
The objective of the research was to assess BC in T1DM patients and evaluate the relationship between BC,MS,and insulin resistance in these individuals. This study would contribute to identify the independent risk factors for MS in Chinese T1DM and verify that BC studies,specifically detecting visceral fat (trunk fat),may be useful in recognizing the elevated risk of MS in non-obese T1DM patients.
Research methods
A total of 101 subjects with T1DM,aged 10 years or older,and with a disease duration of over 1 year were included.BIA using the Tsinghua-Tongfang BC Analyzer BCA-1B was employed to measure various BC parameters.Clinical and laboratory data were collected,and insulin resistance was calculated using the estimated glucose disposal rate (eGDR).
The BIA measurement provided valuable analysis data such as muscle mass,fat mass,and visceral fat index (VFI).In this study,VFI represents visceral fat volumeas and was calculated as follows: VFI=visceral fat area (cm2) divided by 10 cm2.
Research results
Several important research achievements are as follows: Visceral fat was found to be a superior predictor of metabolic syndrome compared to conventional measures such as BMI and waist-to-hip ratio in Chinese individuals with T1DM;VFI,eGDR,and a family history of diabetes were identified as independent risk factors for metabolic syndrome in Chinese individuals with T1DM;skeletal muscle mass showed a significant positive correlation with blood pressure and emerged as an independent risk factor for hypertension in Chinese individuals with T1DM.
Research conclusions
Visceral fat,eGDR,and a family history of diabetes are important independent risk factors for metabolic syndrome while skeletal muscle mass acts as an independent risk factor for hypertension.Body composition analysis,specifically identifying visceral fat,has unique value in identifying metabolic syndrome in Chinese patients with T1DM.
Research perspectives
The future research direction is to evaluate the relationship between BC and MS,mortality through expanding sample size and cohort studies.
ACKNOWLEDGEMENTS
The authors would like to thank Mr.Hassan Nabulsi for his language assistance.
FOOTNOTES
Author contributions:Lin K and Zeng Q designed the research study;Chen XJ,He YT,Ma ZM and Wu YX performed the research;Zeng Q and Chen XJ contributed new reagents and analytic tools;Lin K and Zeng Q analyzed the data and wrote the manuscript;All authors have read and approve the final manuscript.
Supported bythe “SDF-sweet doctor cultivation” Project of Sinocare Diabetes Foundation,No.2022SD11 and No.2021SD09.
Institutional review board statement:The study was reviewed and approved by the First Affiliated Hospital of Shantou University Medical College (approval No.B-2022-236).
Informed consent statement:All study participants,or their legal guardian,provided informed written consent prior to study enrollment.
Conflict-of-interest statement:There are no conflicts of interest to report.
Data sharing statement:No additional data are available.
STROBE statement:The authors have read the STROBE Statement-checklist of items,and the manuscript was prepared and revised according to the STROBE Statement-checklist of items.
Open-Access:This article is an open-access article that was selected by an in-house editor and fully peer-reviewed by external reviewers.It is distributed in accordance with the Creative Commons Attribution NonCommercial (CC BY-NC 4.0) license,which permits others to distribute,remix,adapt,build upon this work non-commercially,and license their derivative works on different terms,provided the original work is properly cited and the use is non-commercial.See: https://creativecommons.org/Licenses/by-nc/4.0/
Country/Territory of origin:China
ORCID number:Kun Lin 0000-0003-1714-7183.
S-Editor:Qu XL
L-Editor:A
P-Editor:Chen YX
杂志排行

World Journal of Diabetes的其它文章
- Effects of Tai Chi in diabetes patients: Insights from recent research
- Management of monogenic diabetes in pregnancy: A narrative review
- Prediabetes: An overlooked risk factor for major adverse cardiac and cerebrovascular events in atrial fibrillation patients
- Predictive value of bilirubin and serum γ-glutamyltranspeptidase levels in type-2 diabetes mellitus patients with acute coronary syndrome
- Clinical study of different prediction models in predicting diabetic nephropathy in patients with type 2 diabetes mellitus
- Heterogeneously elevated branched-chain/aromatic amino acids among new-onset type-2 diabetes mellitus patients are potentially skewed diabetes predictors