Do forest health threats affect upland oak regeneration and recruitment?Advance reproduction is a key co-morbidity
2024-01-22LnceVickersBenjminKnppDnielDeyLurenPileKnpp
Lnce A.Vickers, Benjmin O.Knpp, Dniel C.Dey, Luren S.Pile Knpp
aSchool of Natural Resources, University of Missouri, 203 Anheuser-Busch Natural Resources Building, Columbia, MO, 65211, USA
b USDA Forest Service Northern Research Station, 202 Anheuser-Busch Natural Resources Building, Columbia, MO, 65211, USA
Keywords:Temperate deciduous forest Regeneration ecology Forest inventory and analysis Oak/hickory Forest pests Insect Disease Harvesting
ABSTRACT We analyzed national forest inventory data collected from circa 2000-2018 across 37 states in the eastern United States to better understand the influence of forest health related canopy disturbances on the regeneration and recruitment dynamics of upland oaks (Quercus).We found low levels of oak recruitment across all disturbance types examined but limited evidence of any direct effects from the type of disturbance on the population of regenerating oaks.The general lack of differences in oak regeneration response between forest health disturbances and disturbances caused by harvested or non-disturbed plots does not indicate that the effects of forest health disturbances were benign, however.Instead, low level of oak recruitment across all disturbance types highlights the pervasiveness of the trend of shifting composition in once oak-dominated forests where oak is absent or sparse in the regeneration layer.Our results show that oak recruitment was higher when oak was present as advance reproduction prior to disturbance from any cause examined.Collectively,these results lead us to conclude that the widespread inadequacy of oak advance reproduction in mature oak-dominated forests is the prevailing threat to oak forest health and sustainability.We suggest the status of advance reproduction be treated as a co-morbidity when weighing the risk and potential outcomes from other threats to upland oak forests in the eastern United States.
1.Introduction
Oaks (Quercus) are an important genus in the eastern United States(US),comprising 11%of all living trees,16%of all standing dead trees,and occurring on over 76 million hectares(Miles,2017).In much of the eastern US, oaks are a foundation species with outsized importance for carbon sequestration and storage(Cavender-Bares,2016;2019),wildlife forage and habitat (McShea et al., 2007), and economic value (e.g.,Stringer et al., 2021).On upland sites in these forests, prominent oaks include Quercus alba, Q.rubra, Q.montana, Q.velutina, Q.stellata,Q.coccinea,Q.macrocarpa,Q.falcata,Q.muehlenbergii,Q.ellipsoidalis,and Q.marilandica.
On upland oak sites in the eastern US,soils tend to be categorized into Alfsiol, Inceptisol, or Ultisol soil orders (https://casoilresource.lawr..ucdavis.edu/soil-properties/) and oaks tend to be less nutrient demanding than common competitors such as Acer rubrum and Liriodendron tulipifera (Kolb et al., 1990; Wurzburger et al., 2023).Most of the upland oaks are classified as intermediate in shade tolerance,though Q.coccinea, Q.muehlenbergii, and Q.stellata are considered intolerant to shade (Burns and Honkala, 1990).Generally considered tolerant of periodic drought stresses and lower nutrient availability, upland oaks project to be well-adapted to future climate scenarios in many places across their current range(Peters et al.,2020 but see Novick et al.,2022).
Much of the forest in the eastern US where upland oaks are prevalent is maturing,with at least 70%of the forestland approaching stages when regeneration considerations arise (Shifley et al., 2014; Miles, 2017).Recent studies have documented that mortality associated with disturbances from forest pest invasions caused considerable loss of mature trees and reduced stand occupancy in the US(Fei et al.,2019).The most recent published information on forest health trends estimated that over 700,000 ha(i.e.,0.5%)in the eastern US are impacted by mortality inducing forest health disturbances annually and over 1.2 million ha (i.e., 0.8%)are impacted annually by defoliating disturbances(Potter and Conkling,2021).The risk of loss to these threats is anticipated to increase with global climate change and the introduction and translocation of non-native insects and disease(Conrad et al.,2020).
Despite their ubiquity in the canopy of many eastern US forests, upland oaks can be sporadic in the understory, indicating problems in regeneration and sustaining future oak stocking.Maintaining oaks when regenerating upland forests is often difficult, requiring thoughtful planning and potentially decades of active forest management (Loftis and McGee,1993;Dey,2014;Johnson et al.,2019).Such concerns have been reported in many oak ecosystems across the world (e.g., G¨otmark and Kiffer,2014;Heydari et al.,2017;Bobiec et al.,2018).Untimely canopy mortality may exacerbate regeneration difficulties (Gottschalk, 1993;Appel, 1995; Heitzman et al., 2007) by further favoring established,competitive species instead of oaks.However,little information exists on the impact of declining upland oak forest canopies from pest and disease on the regeneration and recruitment of oak seedlings and saplings, and ultimately the sustainability of upland oak forests into the future.When canopy disturbances alter mature stands with a sparse or absent understory,any disturbance may be untimely if regenerating a similar species composition is the desired outcome (Egler, 1954).Likewise, if forest health disturbances initiate the regeneration process in mature oak stands that are not poised for successful regeneration,the consequences could be more lasting than any immediate or direct effects of reduced vigor in mature trees.
With an overarching goal to understand regeneration and successional dynamics induced from forest health related canopy reductions and triage the regeneration risk of upland oak forests, this analysis examined seedling and sapling dynamics related to declines in forest health through time and at broad spatial scales.To ascertain whether forest health issues in upland oak forests of the eastern US affect oak regeneration and recruitment, we address three specific Research Questions:
1) Do forest health disturbances affect upland oak regeneration abundance(seedlings and saplings)?
2) Do forest health disturbances affect upland oak sapling recruitment(sapling ingrowth)?
3) Does the magnitude of forest health-related canopy disturbance affect upland oak sapling recruitment?
2.Materials and methods
2.1.Data source
This project relied on data collected as part of the USDA Forest Service Forest Inventory and Analysis Program (FIA; https://www.fia.fs.usda.gov/).FIA collects data on permanent sample plots at known locations that are systematically distributed across all forested lands around the country such that each sample plot represents about 2,430 ha,though certain areas such as national forests are sampled with higher intensity.At each FIA plot location,attributes are collected on a cluster of four circular subplots, each approximately 168 m2and arranged such that the footprint of the cluster encompasses approximately 0.4 ha(Bechtold and Patterson, 2005).At each plot location, one or more conditions, which include information on forest/nonforest, stand type,ownership,and accessibility,are recorded.Then,tree data are collected for all trees with diameter at breast height(dbh)≥12.7 cm on each of the 168 m2subplots including species,dbh,status as live or dead,whether a dead stem is to be counted as a harvest removal or other mortality and the likely cause of that mortality, and several other attributes.Sapling(dbh 2.5-12.6 cm)attributes are collected on an approximately 13.5 m2circular microplot nested within each subplot.On the microplots,species,dbh,and location are consistently collected for live stems only(the fates of dead or possibly harvested stems of this size are not tracked).Seedling(dbh <2.5 cm and height ≥15 cm for softwoods or ≥30.5 cm for hardwoods) attributes are also collected on the microplots and include a simple tally by species.In addition to various tree-centric measures, inventories record several site attributes such as ownership group, forest type, stand size/maturity, visible signs of disturbances including forest health and harvesting operations, and more ancillary site attributes to help describe the condition (Burrill et al., 2018).Around 2000, FIA adopted an annualized inventory protocol in which the inventory was continuous,i.e.,a fixed percentage of inventory plots is measured every year in every state such that plots are remeasured every 5-7 years and,after the initial cycle, statewide inventories are updated yearly as the oldest data are replaced by the remeasured data.
2.2.Data filtering and preparation
The data selection process below was intended to construct a‘natural experiment analytical approach’for this observational data.In this case,we filtered the data such that all plot locations included in our analysis began the time series (‘t1’) as undisturbed mature upland oak forests,later encountered one of the disturbance types of interest (described later) by the second inventory ‘t2’, and their responses to those disturbances were examined at the third inventory ‘t3’ (Supplementary Materials Fig.S1).
At the time of data acquisition, inventories from circa 2000 through 2018 were available from across the eastern US analysis region (forestland portions of 37 continental US states east of 100°W longitude)varying slightly by state within the region.Within this period, we collated records from three complete inventories (t1-t3) for each plot location.Any plot locations without at least three consecutive inventories recorded were discarded.For each individual inventory through time at a given plot location, data from all subplots were combined into a single plot location summary following the FIA sample design procedures described by Bechtold and Patterson(2005).
From the first inventory cycle in this timespan (hereafter, t1), we identified locations with mature,upland oak characteristics that,at that time, did not show signs of recent disturbance.Mature characteristics included the following plot-level attributes: a)a preponderance of large or medium tree diameters(≥50%of trees ≥12.7 cm dbh),b)an average(quadratic)tree diameter ≥18 cm,and c)a recorded stand age ≥50 years old.For reference, most upland oaks begin seed production at approximately 20-30 years old (Burns and Honkala, 1990).Upland oak characteristics included plots that had at least 10% of living plot-level stocking (sensu Gingrich, 1967) comprised of upland oak species (as defined in introduction) but were not located on hydric sites or floodplains/bottomlands.Evidence of recent disturbance included: a) any disturbances or treatments recorded in the inventory record, b) any artificial regeneration recorded in the inventory record, c) canopy stocking <60% since the average mature canopy stocking was >100%,and d)a standing-dead basal area >1 standard deviation more than the average standing-dead basal area across all mature upland oak plots in the analysis region.Plot locations that met any of the criteria above at t1 were considered recently disturbed and excluded from analysis.A summary of stand attributes of these mature plots is provided in Supplementary Materials Table S1.As noted in Supplementary Materials Table S2,these stands are quite diverse on average,with species spanning the range of silvical characteristics and life history traits.
For the second inventory cycle(hereafter,t2),any mortality of trees present at t1 was considered a disturbance and we categorized the onceundisturbed,mature upland oak plot locations based on which tree-level cause of death (AGENTCD in the inventory record), if any, affected the most basal area since t1(the previous measurement,≈5-7 years earlier).We limited our analyses to the following four disturbance categories:insect, disease, harvesting, or undisturbed.Plot locations that experienced multiple types of disturbance were discarded.A total of 3,302 plot locations within the data available for the period of interest met all the t1 criteria above,of which 97 were categorized as insect disturbances at t2,335 were categorized as diseased, 326 were categorized as harvested,and 549 were categorized as undisturbed,meaning no trees died from t1 to t2.The final 1,327 FIA plot locations used in our analyses were dispersed throughout the eastern US upland oak forest (Supplementary Materials Fig.S2).Because of variation in state-level sampling schedules,the time since disturbance can range from 5 to 14 years or be ongoing in the case of a single disturbance type that continued from t2 to t3 (Supplementary Materials Fig.S3).We quantified the magnitude of disturbance as the proportion of t1 canopy crown competition factor (CCF,Krajicek et al.,1961)lost to mortality by t2.CCF is the sum of maximum crown areas(empirical values from open grown trees of a species)for all trees on a plot, which can be calculated in upland oak stands (using US customary units) as 0.0176N+ 0.0206 ∑Di+ 0.00603 ∑D2i, where:summations are over all trees on the plot expanded to their unit area,Diis the dbh of tree i and N is the number of trees per unit area.We defined the canopy as trees that were recorded as having dominant or codominant crown classes.Additional information on the magnitude of disturbance observed in the analyzed plots is provided in Supplementary Materials Table S3 and Fig.S4.
The same dataset was used to address all three hypotheses.The data uses are publicly available at https://www.fia.fs.usda.gov/ and were retrieved via the rFIA package (Stanke et al., 2020) for R statistical software (R Core Team, 2021).All analyses were conducted with R statistical software.
2.3.Data analyses - general
To address all Research Questions,we used either negative binomial or logistic generalized linear mixed models via the“glmmTMB”package for R (Brooks et al., 2017).Negative binomial models are appropriate when the dependent variable is count data(Hilbe,2011)as was the case for our post-disturbance density analyses.Logistic regression is appropriate when the dependent variable is proportional count data (Zuur et al., 2009) as was the case for our post-disturbance relative density analyses.In either case,our primary explanatory variable of interest was the type of disturbance that occurred at t2(insect,disease,harvesting,or undisturbed).Here,the harvesting and undisturbed categories served as disturbed and undisturbed‘controls’,respectively.Because oak strongly relies on advance reproduction to regenerate, we expected that the oak regeneration response variables(at t3)for all of our Research Questions would vary depending on the presence (or absence) of upland oak advance reproduction prior to disturbance (at t1) and included it as a fixed-effect covariate to account for its expected overriding influence.We also included an offset variable based on the time since disturbance for each plot to account for differences attributable to temporal stand development given the variation in time since disturbance and remeasurement periods found in FIA plots.
Given the breadth of the analysis region and that oak regeneration is known to be influenced by site factors (Johnson et al., 2019), we suspected there could be natural variation arising from regional and/or physiographic site differences.During preliminary analysis for each objective, we investigated whether including random effect terms for ecological section(McNab et al.,2007)and/or topographic class(Burrill et al.,2018)were needed to account for these likely sources of variation.If the inclusion of either random effect term resulted in superior model fit according to the Schwarz Information Criteria,RMSE,and other metrics reported by the“performance”package for R(Schwarz,1978;Burnham and Anderson, 2002; Lüdecke et al., 2021), it was retained in the final model form used in our analyses.
We used Analysis of Deviance with Wald type III χ2tests via the“car”package for R (Fox and Weisberg, 2019) to determine whether the explanatory variables under investigation were statistically significant sources of variation in the response variables for each Research Question.If any explanatory variable was deemed statistically significant (α =0.05),we continued with our pre-planned contrasts between factor levels via the“emmeans” package for R (Lenth,2023).
2.4.Data analyses - specific
The description of the analyses specific to each Research Question is organized by the three main Research Questions below.
Research Question 1)Do forest health disturbances affect upland oak regeneration abundance(seedlings and saplings)?
To address the first Research Question, we examined both the absolute and relative density of upland oak regeneration.In the case of absolute density, the dependent variable was the combined density of upland oak seedling and sapling reproduction at t3, which included seedlings ≥30.5 cm in height and saplings with a dbh 2.5-12.6 cm.During preliminary analyses,we determined that an interaction term for disturbance category and presence of advance reproduction did not improve model performance, but random effects for both ecological section and physiographic class did.Thus, the final model used in our analysis of absolute density for Research Question 1 was:
where: ︿yijk= estimated conditional mean density of upland oak reproduction post-disturbance, Di= one of four disturbance categories included in this study(denoted by i and includes none,harvested,insect,disease),Aj=one of two advance reproduction categories(denoted by j and includes present or absent),Tkis an offset variable representing time since disturbance (or remeasurement period if undisturbed) for a given plot (denoted by k),αris a random effect for each individual ecological section (denoted by r), τsis a random effect for each individual physiographic class (denoted by s), and β0, β1and β2are parameters to be estimated from the data.Note: Parameters were fit based on plot-level count data with model estimates expanded to the hectare basis for presentation herein.
For our analysis of relative density, the dependent variable was the upland oak proportion of the combined density of all seedling and sapling reproduction from all species at t3.Such an analysis necessitated plots totally lacking in reproduction of any species be discarded.During preliminary analyses, we determined that an interaction term for disturbance category and presence of advance reproduction did not improve model performance, nor did random effects for ecological section or physiographic class.Thus,the final model used in our analysis of relative density for Research Question 1 was:
where: logit(P)= estimated conditional mean relative density of upland oak reproduction post-disturbance, Di= one of four disturbance categories included in this study(denoted by i and includes none,harvested,insect, disease), Aj= one of two advance reproduction categories(denoted by j and includes present or absent), Tkis an offset variable representing time since disturbance (or remeasurement period if undisturbed)for a given plot(denoted by k),and β0,β1and β2are parameters to be estimated from the data.Note: Parameters were fit based on plotlevel count data with model estimates expanded to the hectare basis for presentation herein.
Research Question 2)Do forest health disturbances affect upland oak sapling recruitment(sapling ingrowth)?
To address the second Research Question, we again examined both the density and relative density of post-disturbance upland oak sapling ingrowth,which was defined as saplings that first reached the 2.5 cm dbh threshold after disturbance (at either t2 or t3).For our analysis of absolute density,we simply adapted Eq.1a for this analysis by changing the dependent variable to density of post-disturbance upland oak sapling ingrowth at t3.During preliminary analyses, we determined that an interaction term for disturbance category and presence of advance reproduction did not improve model performance,but random effects for both ecological section and physiographic class did and they were retained in the final model.
For our analysis of relative density towards the second Question,we adapted Eq.2 by simply changing the dependent variable to proportion of post-disturbance sapling ingrowth that upland oaks made up of all species at t3.As was the case for the relative density analysis for Research Question 1,this analysis necessitated plots totally lacking in reproduction of any species be discarded.During preliminary analyses,we determined that an interaction term for disturbance category and presence of advance reproduction did not improve model performance, nor did random effects for ecological section or physiographic class.
Research Question 3) Does the magnitude of disturbance affect upland oak sapling recruitment?
To address the third Research Question, we examined the absolute density of post-disturbance upland oak sapling ingrowth,which included those saplings that first reached the 2.5 cm dbh threshold at either t2 or t3.This was the same dependent variable from the absolute density analysis in Research Question 2.However, in this analysis, we not only adapted Eq.1a by changing the dependent variable but also included an additional explanatory variable, as the primary explanatory variable of interest for this Research Question was the magnitude of disturbance,which we defined as the proportion of upper canopy crown competition factor(Krajicek et al.,1961)at t1 that was lost to mortality by t2.During preliminary analyses, we determined that an interaction term for disturbance category and presence of advance reproduction did not improve model performance, but random effects for ecological section and physiographic class did.Thus,the final model used in our analysis of absolute density for Research Question 3 was:
where: ︿yijk= estimated conditional mean density of upland oak postdisturbance sapling ingrowth (incl.t2 + t3; 2.5 cm threshold), Di=disturbance category (harvested, insect, disease), Aj= presence of advance reproduction (present, absent), Mkis the magnitude of disturbance(proportion of upper canopy death)for a plot(denoted by k),Tkis an offset variable representing time since disturbance(or remeasurement period if undisturbed) for a plot(k),αris a random effect for ecological section,τsis a random effect for physiographic class,and β0,β1,β2and β3are parameters to be estimated from the data.Note:Parameters were fit based on plot-level count data with model estimates expanded to the hectare basis for presentation herein.
3.Results
3.1.General
There were differences in the observed range of disturbance magnitude between the three disturbance types included in our analysis, with harvesting >insect >disease in terms of average canopy reduction.On average, disturbances captured in our data induced about 12% canopy mortality,i.e.,the CCF lost to mortality from previously living dominant or codominant trees was 12%lower at t2 than the live CCF in dominant or codominant trees recorded at t1.Disease disturbances averaged 6%canopy reductions and never induced >44%canopy mortality while insect disturbances averaged 12% canopy reduction and were always≤60%canopy mortality.Harvesting disturbances averaged 37%canopy reductions and resulted in complete canopy removal in some cases.
3.2.Specific
The description of the results specific to each Research Question is organized by the three main Research Questions below.
3.2.1.Research Question 1)Do forest health disturbances affect upland oak regeneration abundance (seedlings and saplings)?
3.2.1.1.Absolute density.A likelihood ratio test comparing the fitted model from Eq.1a for the post-disturbance density of upland oak seedlings and saplings to a null(intercept-only)model showed that the model in Eq.1a was statistically superior and explained about 42% of the variation.The random effects of region and site type accounted for 26%of that explained variation.Analysis of deviance indicated the type of disturbance(p ≤0.0001)and the presence of advance reproduction(p ≤0.0001) were both statistically significant predictors according to the Wald type III test(Table 1).
Our analysis shows (Fig.1a) that the presence of advance reproduction had a greater effect on the number of upland oak seedlings and saplings present eight years post-disturbance than did the types of disturbance.Regardless of disturbance category,post-disturbance upland oak regeneration was fewer than 500 stems per hectare without advance reproduction.When advance reproduction was present,regeneration was 3-5 times more numerous across all disturbance categories.In both cases,there was statistically more upland oak regeneration eight-years following harvesting than any other disturbances (Fig.1a).
3.2.1.2.Relative density.A likelihood ratio test comparing the fitted model from Eq.2 for the post-disturbance relative density of upland oak seedlings and saplings to a null(intercept-only)model showed that Eq.2 was statistically superior and explained 13%of the variation.Analysis of deviance from that model indicated that disturbance type was not a statistically significant predictor of the relative density of upland oak seedlings and saplings according to the Wald type III test (p = 0.6372),but presence of advance reproduction was(p <0.0001,Table 2).Without upland oak advance reproduction,upland oak regeneration averaged 5%of all regeneration present after eight years with <1% difference across disturbance categories (Fig.1b).When advance reproduction was present, upland oak averaged 19% of all regeneration after eight years but differences across disturbance categories were <5%and not statistically significant.Only three oak species were within the top 20 species for relative density of total seedlings and saplings, including Quercus alba(8th, 3%), Quercus rubra (12th, 3%), and Quercus montana (13th, 2%)when averaged across all conditions study-wide (Supplementary Materials Table S2).
3.2.2.Research Question 2)Do forest health disturbances affect upland oak sapling recruitment (sapling ingrowth)?
3.2.2.1.Absolute density.The fitted model from Eq.1a for postdisturbance upland oak sapling ingrowth was statistically superior to a null (intercept-only) model and explained 31% of the variance.The random effects for region and site type accounted for 28% of that explained variation.Analysis of deviance indicated disturbance type was not statistically significant (p = 0.1596) according to the Wald type III test, but presence of advance reproduction was (p <0.0001, Table 3).Eight years following disturbance, an average of 21 new upland oak saplings per hectare had entered the 2.5 cm diameter class when there was no advance reproduction present (Fig.2a).There was a nonstatistically significant spread of 11 stems·ha-1across the disturbance types in the absence of advance reproduction.The three-fold greater number of new upland oak saplings when advance reproduction was present (67 stems·ha-1) was statistically significant, but there were no detectable differences among disturbance types.
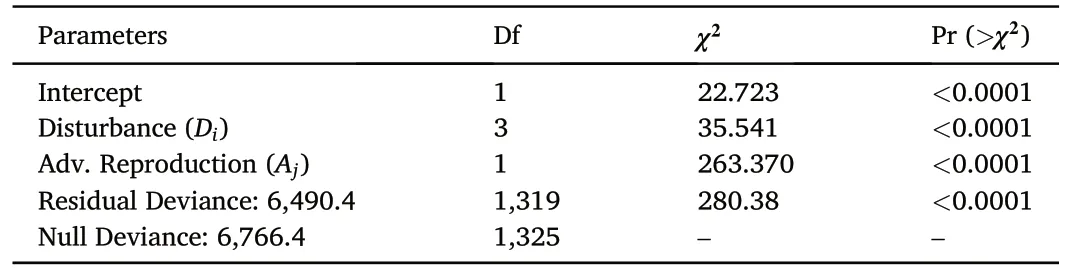
Table 1Analysis of Deviance table as calculated from a negative binomial generalized linear model (Eq.1a) for post-disturbance density upland oak seedling and sapling regeneration by disturbance category and presence or absence of upland oak advance reproduction in mature upland oak forests in the eastern US.
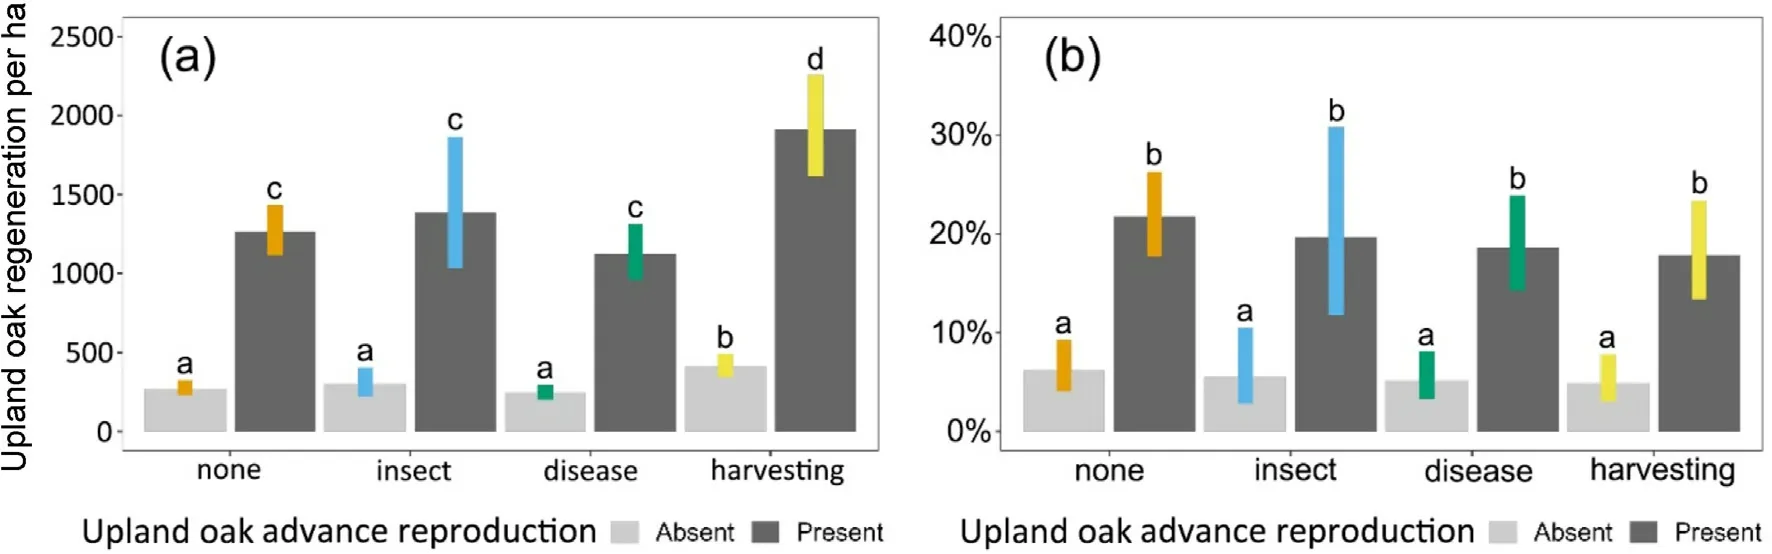
Fig.1.Density of upland oak seedling and sapling reproduction(a, left) and their relative density compared to all seedling and sapling reproduction (b,right) eight years post-disturbance by disturbance category and presence or absence of advance reproduction in mature upland oak forests in the eastern US.Columns depict average values and error-bars depict 95% confidence intervals.Columns not sharing any letters were statistically different (p <0.05).

Table 2Analysis of Deviance table as calculated from a logistic generalized linear model(Eq.2) for post-disturbance relative density of upland oak seedling and sapling regeneration by disturbance category and presence or absence of upland oak advance reproduction in mature upland oak forests in the eastern US.Note:plots lacking post-disturbance regeneration from any species were excluded from this analysis.
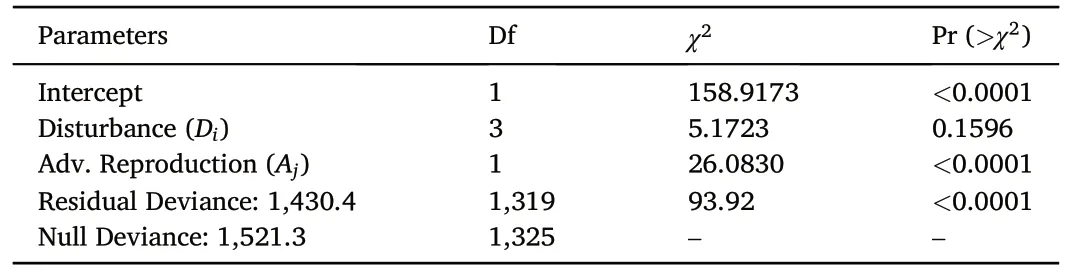
Table 3Analysis of Deviance table as calculated from a negative binomial generalized linear model (Eq.1a) for post-disturbance upland oak sapling ingrowth density by disturbance category and presence or absence of upland oak advance reproduction in mature upland oak forests in the eastern US.
3.2.2.2.Relative density.The fitted model from Eq.2 for the relative density of post-disturbance upland oak sapling ingrowth was statistically superior to a null (intercept-only) model and explained 11% of thevariation.Analysis of deviance from that model indicated that disturbance type was not a statistically significant predictor (p = 0.4831) according to the Wald type III test, but presence of advance reproduction was (p = 0.0003, Table 4).Eight years following disturbance, upland oaks averaged about 3% of all new saplings, varying no more than 2%across disturbance types, which was not a statistically significant difference(Fig.2b).The increase to 10%of all new saplings when upland oak advance reproduction was present was statistically significant.Across all conditions, the only oak species within the top 20 species in terms of relative density of new sapling ingrowth was Quercus alba which was ranked 19th, averaging approximately 1% study-wide (Supplementary Materials Table S2.)

Table 4Analysis of Deviance table as calculated from a logistic generalized linear model(Eq.2) for post-disturbance upland oak sapling ingrowth relative density by disturbance category and presence or absence of upland oak advance reproduction in mature upland oak forests in the eastern US.Note: plots lacking sapling ingrowth from any species were excluded from this analysis.
3.2.3.Research Question 3)Does the magnitude of disturbance affect upland oak sapling recruitment?

Fig.2.Upland oak sapling ingrowth density into the 2.5 cm diameter class (a, left) and their relative density compared to all sapling ingrowth into the 2.5 cm diameter class (b, right) eight years post-disturbance by disturbance category and presence or absence of advance reproduction in mature upland oak forests in the eastern US.Columns depict average values and error-bars depict 95% confidence intervals.Columns not sharing any letters were statistically different (p <0.05).
A likelihood ratio test comparing the fitted model from Eq.1b for post-disturbance upland oak sapling ingrowth density to a null(intercept-only)model showed that Eq.1b was statistically superior and explained about 24% of the variation in disturbed plots.Analysis of deviance from that model indicated that disturbance type was not a statistically significant predictor(p=0.2807)according to the Wald type III test, but both the magnitude of disturbance (p = 0.0019) and the presence of advance reproduction were(p <0.0001,Table 5).
Increased magnitude of disturbance leads to an increased occurrence of upland oak sapling ingrowth no matter the disturbance type(Fig.3).A disturbance magnitude of 45%, about the upper limit of disease-based disturbances observed in this data, resulted in 97% more new upland oak saplings after 8 years compared to a canopy disturbance that removed only 5%of the canopy.A disturbance that induced 60%canopy mortality,about the upper limit of insect-based disturbances observed in the plots used for this analysis, increased upland oak sapling ingrowth 176% over a 5% canopy disturbance.Complete overstory removal increased upland oak sapling ingrowth by over 400%,but this magnitude of canopy reduction was only observed on plots that were harvested.
The presence of advance reproduction resulted in a 290%increase in upland oak sapling ingrowth on average, regardless of disturbance type or magnitude.Moreover, the influence of advance reproduction tended to be greater than the effect of increasing disturbance magnitude.For example, the estimates from the fitted model in Eq.1b indicate that it takes an increase in disturbance magnitude of 80%(e.g.,increasing from 5%to 85%disturbance magnitude)to produce a similar change in upland oak sapling ingrowth as the difference that arises from the presence of advance reproduction.Accordingly, when advance reproduction was absent, upland oak sapling ingrowth remained low for all disturbance categores at all levles of disturbance magnitude,with the average never more than 50 new upland oak saplings per hectare in the range of conditions observed.
4.Discussion
There are numerous threats to the health of tree species found in eastern US upland oak forests,but recently common oak-specific threats in the region include spongy moth (Lymantria dispar) and oak decline complexes (Potter and Conkling, 2021).Several other oak-specific threats or potential-threats vary in temporal or geographical extent including oak wilt (Bretziella fagacearum), sudden oak death (Phytophthora ramorum) and several Agrilus beetles (Meunier et al., 2019; Haller and Wimberly, 2020; Conrad et al., 2020).The severity of these disturbances varies with the cause of disturbance, but the initial stand conditions at the time of disturbance and many other factors contribute to the ultimate effects (Edmonds et al., 2010).For example, older ages, poor vigor,high competition,shallow soils,drought,and mesic slope positions have been identified as predisposing factors for oak mortality(Radcliffe et al.,2021).
Recognizing that understory dynamics influence future forest composition, health, and sustainability, our analysis aimed to evaluate the influence of current forest health induced canopy reductions on regeneration in upland oak forests across the eastern US.Collectively,wefound limited evidence that the forest health related canopy disturbances observed had meaningful direct effects on the regeneration and recruitment of upland oaks.The only evidence for a direct effect was statistically lower total oak reproduction observed following insect or disease-based disturbance compared to harvesting, but, in those cases, oak reproduction was still comparable to that of undisturbed plots.Forest health disturbances resulted in about as many new upland oak saplings several years following disturbance as harvesting or no disturbance did.However, the lack of differences found among disturbance categories in our analysis does not necessarily mean that the effects of the forest health disturbances were benign.The estimated 21-67 new upland oak saplings per hectare (Fig.2a) that developed across disturbance categories falls short of even the lowest estimates of sapling recruitment suggested to plausibly avoid composition shifts in upland oak forests(212-327 per ha,Vickers et al.,2019a,b)as well as the 150-175 per ha estimated to simply maintain an economically viable oak component in such stands (Miller et al.,2007; Brose et al., 2008;Ward, 2009).Moreover,the 3%-10%of sapling ingrowth comprised by upland oaks eight years after disturbance across disturbance categories points to a considerable regeneration debt(sensu Miller and McGill,2019)compared to the average of nearly 50%upland oak component in the canopy of these plots at maturity prior to disturbance.
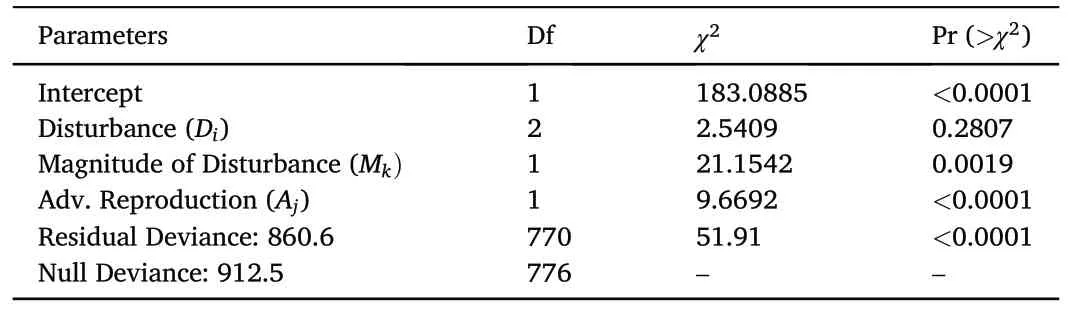
Table 5Analysis of Deviance table as calculated from a negative binomial generalized linear model (Eq.1b) for post-disturbance upland oak sapling ingrowth density by disturbance category, magnitude of disturbance, and presence or absence of upland oak advance reproduction in mature upland oak forests in the eastern US.Note: plots lacking sapling ingrowth from any species and those in the no disturbance category was excluded from this analysis.
Our results show that forest health disturbances are a catalyst in the widespread phenomena of composition shifts in oak stands without necessarily negatively impacting oak seedling and sapling populations.Instead,the effect is indirect,releasing saplings from the suite of common competitors that currently inhabit the understory of upland oak stands,which includes several species in the Acer genus, Nyssa sylvatica, Fagus grandifolia,and others(Supplementary Materials Table S2),all of which vary in prevalence across the region.The transition of oak forests to nonoak species is a widespread concern that is driven, at least in part, by changing disturbance regimes and growing conditions that do not favor oak regeneration and recruitment(Larsen and Johnson,1998;Fei et al.,2011;McEwan et al.,2011;Wurzburger et al.,2023).Similar conclusions have been reached outside the eastern US region that our study focused on (Bobiec et al., 2018).Recent broad-scale studies have documented a lack of ‘regeneration-ready’ mature oak stands in the eastern US, evidenced by a lack of sufficient advance reproduction (McEwan et al.,2011; Miller and McGill, 2019; Vickers et al., 2019b).This landscape-scale concern is not regarded as a conventional forest health issue.However,we submit that classifying the current regeneration and recruitment bottlenecks encountered by most mature oak forests in the eastern US as a prevailing forest health crisis is an appropriate step.A loss of oaks in the eastern US forest would be monumental given their current prevalence and influence on the forest, making up as much as 43% of eastern US timberland(Moser et al.,2006).Given that prevalence,failure to regenerate and recruit oaks has considerable ecological and economic implications for the region,where acorns are the most important wildlife food source (McShea and Healy, 2002) and oak dominated forests can contribute as much as 13 billion US dollars and 50,000 jobs to the economy of a single US state,for example(Stringer et al.,2021).
Regeneration and recruitment of upland oak in our analysis was greater when advance reproduction was present and alarmingly low when it was absent.This points to the status of advance reproduction as a key co-morbidity for any oak forest health threat and the advantages afforded by management that promotes a robust population of advance reproduction.Upland oaks are strongly reliant on competitive advance reproduction to regenerate,which is often scarce,and their recruitment into dominant canopy positions following canopy disturbance is usually commensurate with the abundance of competitive advance reproduction(Sander, 1971; Brose et al., 2008).Though variable, the densities of seedling-sized and larger upland oak regeneration that were present following disturbances where advance reproduction was in place beforehand(Fig.1a)leaves open the possibility that oak management could be a part of these stands in the future.It remains to be seen what proportion,if any,of those seedling-sized stems will survive and recruit into the sapling size class as the plots continue their post-disturbance development.Prior research has shown that proportion typically is low and dependent on their size (Loftis, 2004), which was not collected in the data available to us.Focused silviculture has been shown to improve this condition in some cases(Loftis,1990;Brose et al.,2008;Johnson et al.,2019), and indeed, the densities of post-disturbance oak regeneration were higher in harvested plots in our analysis.However, we cannot ascertain from our dataset what the objectives of the harvesting may have been when implemented.

Fig.3.Density of upland oak sapling ingrowth into the 2.5 cm diameter class eight years post-disturbance by disturbance category, presence or absence of advance reproduction, and magnitude of disturbance in mature upland oak forests in the eastern US.Error-bands depict 95% confidence intervals.Gray depicts “no disturbance” disturbance category for reference.
Given the observational nature of this study and the limitations of the data used,we could only examine forest health issues as detected by new tree deaths recorded in the inventory record.There are certainly instances where canopy trees do not exhibit widespread mortality but nonetheless are experiencing forest health related disturbances that alter canopy health and subsequently influence understory populations either directly or indirectly through altered light levels and other ways.While FIA does record certain aspects of tree and canopy health on a subset of plots(Schomaker et al.,2007),the sample sizes are comparatively sparse(Randolph et al., 2010) and the attributes collected and protocols used have changed through time (Woudenberg et al., 2010; Burrill et al.,2018),which may complicate potential inferences that may be attainable from such data.Future research directions would ideally include longer durations and better attribution of disturbance including specific types of pests.This will become increasingly possible as updated protocols have addressed some of those limitations (Burrill et al.,2018).
Availability of data
Data are available on request from the authors.
CRediT authorship contribution statement
Lance A.Vickers:Writing - original draft, Methodology, Funding acquisition, Formal analysis, Data curation, Conceptualization.Benjamin O.Knapp:Writing - review & editing, Supervision, Project administration, Methodology, Funding acquisition, Conceptualization.Daniel C.Dey:Writing - review & editing, Project administration,Funding acquisition,Conceptualization.Lauren S.Pile Knapp:Writingreview& editing, Methodology, Conceptualization.
Declaration of competing interest
The authors declare that they have no competing interests.
Acknowledgements
This project falls under Task Agreement 18-JV-11242311-084 with the USDA Forest Service,Northern Research Station,within master joint venture agreement 18-JV-11242311-093 under the Great Rivers Cooperative Ecosystems Studies Unit.We are appreciative of the USDA State and Private Forest Health Monitoring program for funding this work and for Dennis McDougall in helping initiate the project.The funding source was not involved in the study design,analysis,interpretation,or writing of this report.We appreciate the efforts of the USDA FIA program in collecting and curating the data analyzed here.We thank John Lhotka and Alejandro Royo for their helpful comments on earlier drafts of this manuscript.
Appendix A.Supplementary data
Supplementary data to this article can be found online at https://doi.i.org/10.1016/j.fecs.2023.100152.
杂志排行

Forest Ecosystems的其它文章
- Divergent responses of Picea crassifolia Kom.in different forest patches to climate change in the northeastern Tibetan Plateau
- Tree-based ecosystem services supply and multifunctionality of church forests and their agricultural matrix near Lake Tana, Ethiopia
- Influence of climate fluctuations on Pinus palustris growth and drought resilience
- Nutrient retranslocation strategies associated with dieback of Pinus species in a semiarid sandy region of Northeast China
- Book review “Continuous Cover Forestry - Theories, Concepts, and Implementation” by Arne Pommerening
- Impact of black cherry on pedunculate oak vitality in mixed forests:Balancing benefits and concerns