A guide for selecting the appropriate plot design to measure ungulate browsing
2024-01-22SuzannevanBeekCalkoenmeMilhAndreaKupfershmidChristianFidererMaroHeurih
Suzanne T.S.van Beek Calkoen, Jérôme Milh, Andrea D.Kupfershmid,Christian Fiderer, Maro Heurih,d
a Department of Visitor Management and National Park Monitoring, Bavarian Forest National Park, Freyunger Straße 2, 94481 Grafenau, Germany
b Wildlife Ecology and Management, Albert-Ludwigs-University of Freiburg, Tennenbacher Str.4, 79106 Freiburg, Germany
c Swiss Federal Research Institute WSL, Zürcherstrasse 111, 8903 Birmensdorf, Switzerland
d Faculty of Applied Ecology, Agricultural Sciences and Biotechnology, Institute for Forest and Wildlife Management, Campus Evenstad, Koppang, Norway
Keywords:Ungulate Browsing impact Monitoring Indicator Decision matrix Forest management
ABSTRACT Ungulate browsing often impairs tree regeneration,thus preventing the achievement of economic or conservation goals.Forest ungulate management would thus benefit from a practical decision tool that facilitates method selection from a wide range of monitoring methods and indicators currently available.In this study,we first provide an overview of the different browsing-impact monitoring methods and indicators currently applied.We then present a newly developed decision matrix for method evaluation that can assist forest stakeholders in choosing the browsing-impact monitoring method best suited to their needs,based on the selected indicators.The first step involved two separate literature reviews to create an overview of the currently applied methods and to select the indicators best suited for measuring browsing impact.Three types of indicator groups with their respective parameters were considered important for method evaluation: browsing indicators (e.g.regeneration density,browsing incidents), performance indicators (e.g.expense, expertise) and data quality indicators (e.g.susceptibility to measurement errors).Subsequently,all parameters defined within each indicator group were categorised and a grade was assigned to each category.To create the final method-indicator matrix, each browsing-impact monitoring method received a grade for each parameter within all indicator groups, reflecting the specific advantages and disadvantages of implementing the respective parameter within a specific method.The utility of the matrix in selecting the most suitable monitoring method was then demonstrated using the example of Germany's national parks.Based on the weights added to the method-indicator matrix, as defined by national park representatives,and considering local requirements the nearest-tree method was favoured over the other two methods.This newly developed matrix provides a more scientific objectification of ungulate browsing-impact measures and can be easily used by forest managers to address their own requirements, based on a consideration of the advantages and disadvantages of the included methods.
1.Introduction
Ungulates are recognised as ecosystem engineers, as they strongly influence the structure, composition and development of terrestrial ecosystems(Gill,1992;Smit and Putman,2010).However,the increased density of ungulate populations across many temperate regions (Apollonio et al., 2010) has intensified the effects on forest ecosystems to an extent that has provoked intense discussions among foresters, wildlife managers and scientists(Côté et al.,2004;Valente et al.,2020).Browsing by ungulates adversely impacts forest regeneration density (Tremblay et al., 2007; Kuijper et al., 2010) and tree diversity (Gill and Beardall,2001; Rooney and Waller, 2003; Schulze et al., 2014), which, among other consequences, may limit the ecological resilience of the affected forest to climate change (Morin et al., 2018).Nonetheless, any consideration of the successional dynamics of forests must take into account the differential responses of trees to browsing,which depends on the traits of the affected species, the site conditions and the impact history (Gill,1992; Edenius et al., 1995; Cailleret et al., 2014; Kupferschmid et al.,2017).Indeed,rather than a decrease,some studies have found a neutral(Pellerin et al., 2010) or even an enhancing (Boulanger et al., 2018;Simonˇciˇc et al., 2019) effect of browsing on biodiversity as well as the overcompensation of tree growth under certain conditions (Kupferschmid and Bugmann, 2013).These contradictory findings partly explain the differing opinions on the appropriate management of ungulate browsing in forest ecosystems (Reimoser and Putman, 2011) and the ongoing discussions on the optimal approaches to measure and understand browsing effects in the field (Reimoser et al., 2014; Huber et al.,2018).
Regardless of the management focus or whether the effects of ungulate browsing are interpreted as positive or negative, managers need accurate information about ungulates and their impact to implement ungulate management policies(Nichols and Williams,2006).Continuous tree regeneration monitoring is pivotal for assessing browsing trends,as it facilitates open and informed debate about management practices and the trade-offs involved and is thus crucial for adaptive wildlife management.An accurate assessment of the effects of browsing and the subsequent selection of the optimal monitoring method require the formulation of management objectives that serve as clear decision criteria.Informed decision-making relies upon the selection of indicators of browsing effects that are concise, relevant and meaningful to managers,as mistakes in indicator selection can result in an inability to assess policy performance and therefore in unwanted financial or socio-economic consequences (Failing and Gregory, 2003).A prerequisite of indicator selection, and thus in the selection of the most appropriate monitoring method, is a clear understanding of how and to what extent each indicator informs management decision-making (Legg and Nagy,2006;Lindenmayer and Likens,2010).
Various methods differing in their measured indicators have been applied to assess the impact of browsing.Although ungulates often target understory vegetation and by regulating tree regeneration, growth, and survival can impact understory plant communities (Gill, 1992; Habeck and Schultz,2015;Bernes et al.,2018),this study is aimed at facilitating the selection of a scientifically appropriate method by forest managers to measure ungulate browsing impact on the economically valuable tree regeneration layer.We first provide an overview of the wide range of browsing-impact monitoring methods and indicators currently in use.Second, we present a newly developed decision matrix for method evaluation aimed at assisting forest stakeholders in choosing the browsing-impact monitoring method best suited to their needs,based on the selected indicators.This involved the following steps:(i)A literature review was conducted to create an overview of current browsing-impact monitoring methods and (ii) a second literature review to select indicators best suited to measuring browsing impact,and thus to effective monitoring.The method-indicator-matrix was constructed by first assigning grades to each indicator category (iii) to reflect the specific advantages and disadvantages that could be encountered by employing a particular set of indicators.In the second step,a grade for each indicator was assigned to each browsing-impact monitoring method(iv).Last,(v)the utility of the matrix in selecting the most suitable monitoring method(s)was demonstrated in a case study of Germany's national parks.
2.Methods
Browsing-impact methods and ungulate-effect indicators were extracted in two separate literature reviews.The aim was to create a sound summary of the methods used to measure browsing impact on tree regeneration (i) and find useful indicators of browsing effects (ii).A detailed description of both literature reviews is provided in the Supplementary Material.
To evaluate the browsing-impact monitoring methods chosen based on the literature review,the selected indicators were categorised,with a grade assigned to each category(iii).The categorisation was based on a five-point grading system in which 1 or 2 indicated a positive value,and 4 or 5 a negative value.The final method-indicator matrix was then created by (iv), assigning a grade to each browsing-impact monitoring method for each indicator based on the literature and according to the expert assessments of the authors.The assigned grades reflected the specific advantages and disadvantages of employing the indicator within a specific browsing-impact monitoring method.
Last, when making trade-offs among management objectives, it is crucial to define the relative importance of each indicator (Failing and Gregory,2003).By altering the weighting of the different indicators,the matrix can be easily adjusted to meet the demands of different stakeholders.The latter can then choose the monitoring method best suited to their needs and therefore obtain objective, sound and comparable data enabling adaptive ungulate management.Within this study,the weights applied as an example reflected the needs of German national park wildlife management authorities as expressed during workshop discussions.For the weighting factors,high importance was indicated by values of 3 or 4 and low importance by values of 1 or 2.An overall grade for each method was then calculated as follows:
3.Results
3.1.Method search
The methods to measure browsing impacts as identified in the literature can be described as fixed-area, fixed-count and N-highest tree methods(Table 1).
3.1.1.Fixed-area methods
Fixed-area methods are classical forest inventory approaches with predefined, fixed plot sizes.The number of trees that need to be measured depends on the tree abundance in the plot area (Avery and Burkhart, 2002; Kramer and Akça, 2008).Three types of fixed-area methods are employed: i) methods examining a single plot or cluster of plots,ii)exclosure methods and iii)methods based on expert estimations(Table 1).Both single-plot and cluster-plot methods are also referred to as plot count methods(Huber et al.,2018).The single plot,whether circular or rectangular, is an often-used plot design in forestry (Düggelin et al.,2020).Cluster plots are a group of sub-plots that together form one plot and are distinguished by their spatial arrangement (Kleinn and Vilˇcko,2005).They are used to improve data accuracy by allowing for a larger number of measurements per plot, thus reducing the variance (Scott,1998).In the commonly used exclosure method, measurement results from an open, unfenced plot are compared with those from an adjacent fenced plot in which ungulate browsing is prevented (Abrams and Johnson, 2012).The expert estimation method is a special form of fixed-area plot design in which the attributes of interest are estimated rather than precisely measured(Kennedy and Addison,1987).
An obvious consideration in selecting a monitoring method is the objective.If this includes density estimations(and estimate precision)or obtaining information of high statistical accuracy on the effect of browsing intensity on stem numbers,a fixed-area method is likely to be appropriate(Cantarello and Newton,2008).Fixed-area methods offer the statistical advantage of unbiased estimates of tree density, due to their simple geometric relationships (i.e.extrapolation to a larger unit area;Kramer and Akça,2008).However,this is only the case if the entire plot is measured or an area-based stop criterion is defined(e.g.¼of the plot area).An area-based stop criterion generally reduces the measurement effort,but its pitfalls need to be considered.For example,if the measured sub-area is not representative of the whole plot, the stop criterion can produce over- or underestimations to an unknown degree (Reimoser et al.,2014).This is also true if the stop criterion is based on the number of trees,irrespective of their species(e.g.Rüegg and Nigg,2003).In that case,there will be a particularly high bias for rare species,depending on whether they are included or excluded by chance.In addition, the plot area will change over time due to tree growth and mortality, thusprohibiting later comparisons with older data.Although fixed-area methods with a stop criterion based on a predefined maximum number of trees are very often used in monitoring,they are not further discussed herein due to their high bias.Thus, this study differentiates between single-plot and cluster plots using either no stop criterion or an area-based stop criterion(see Table 1 for details).
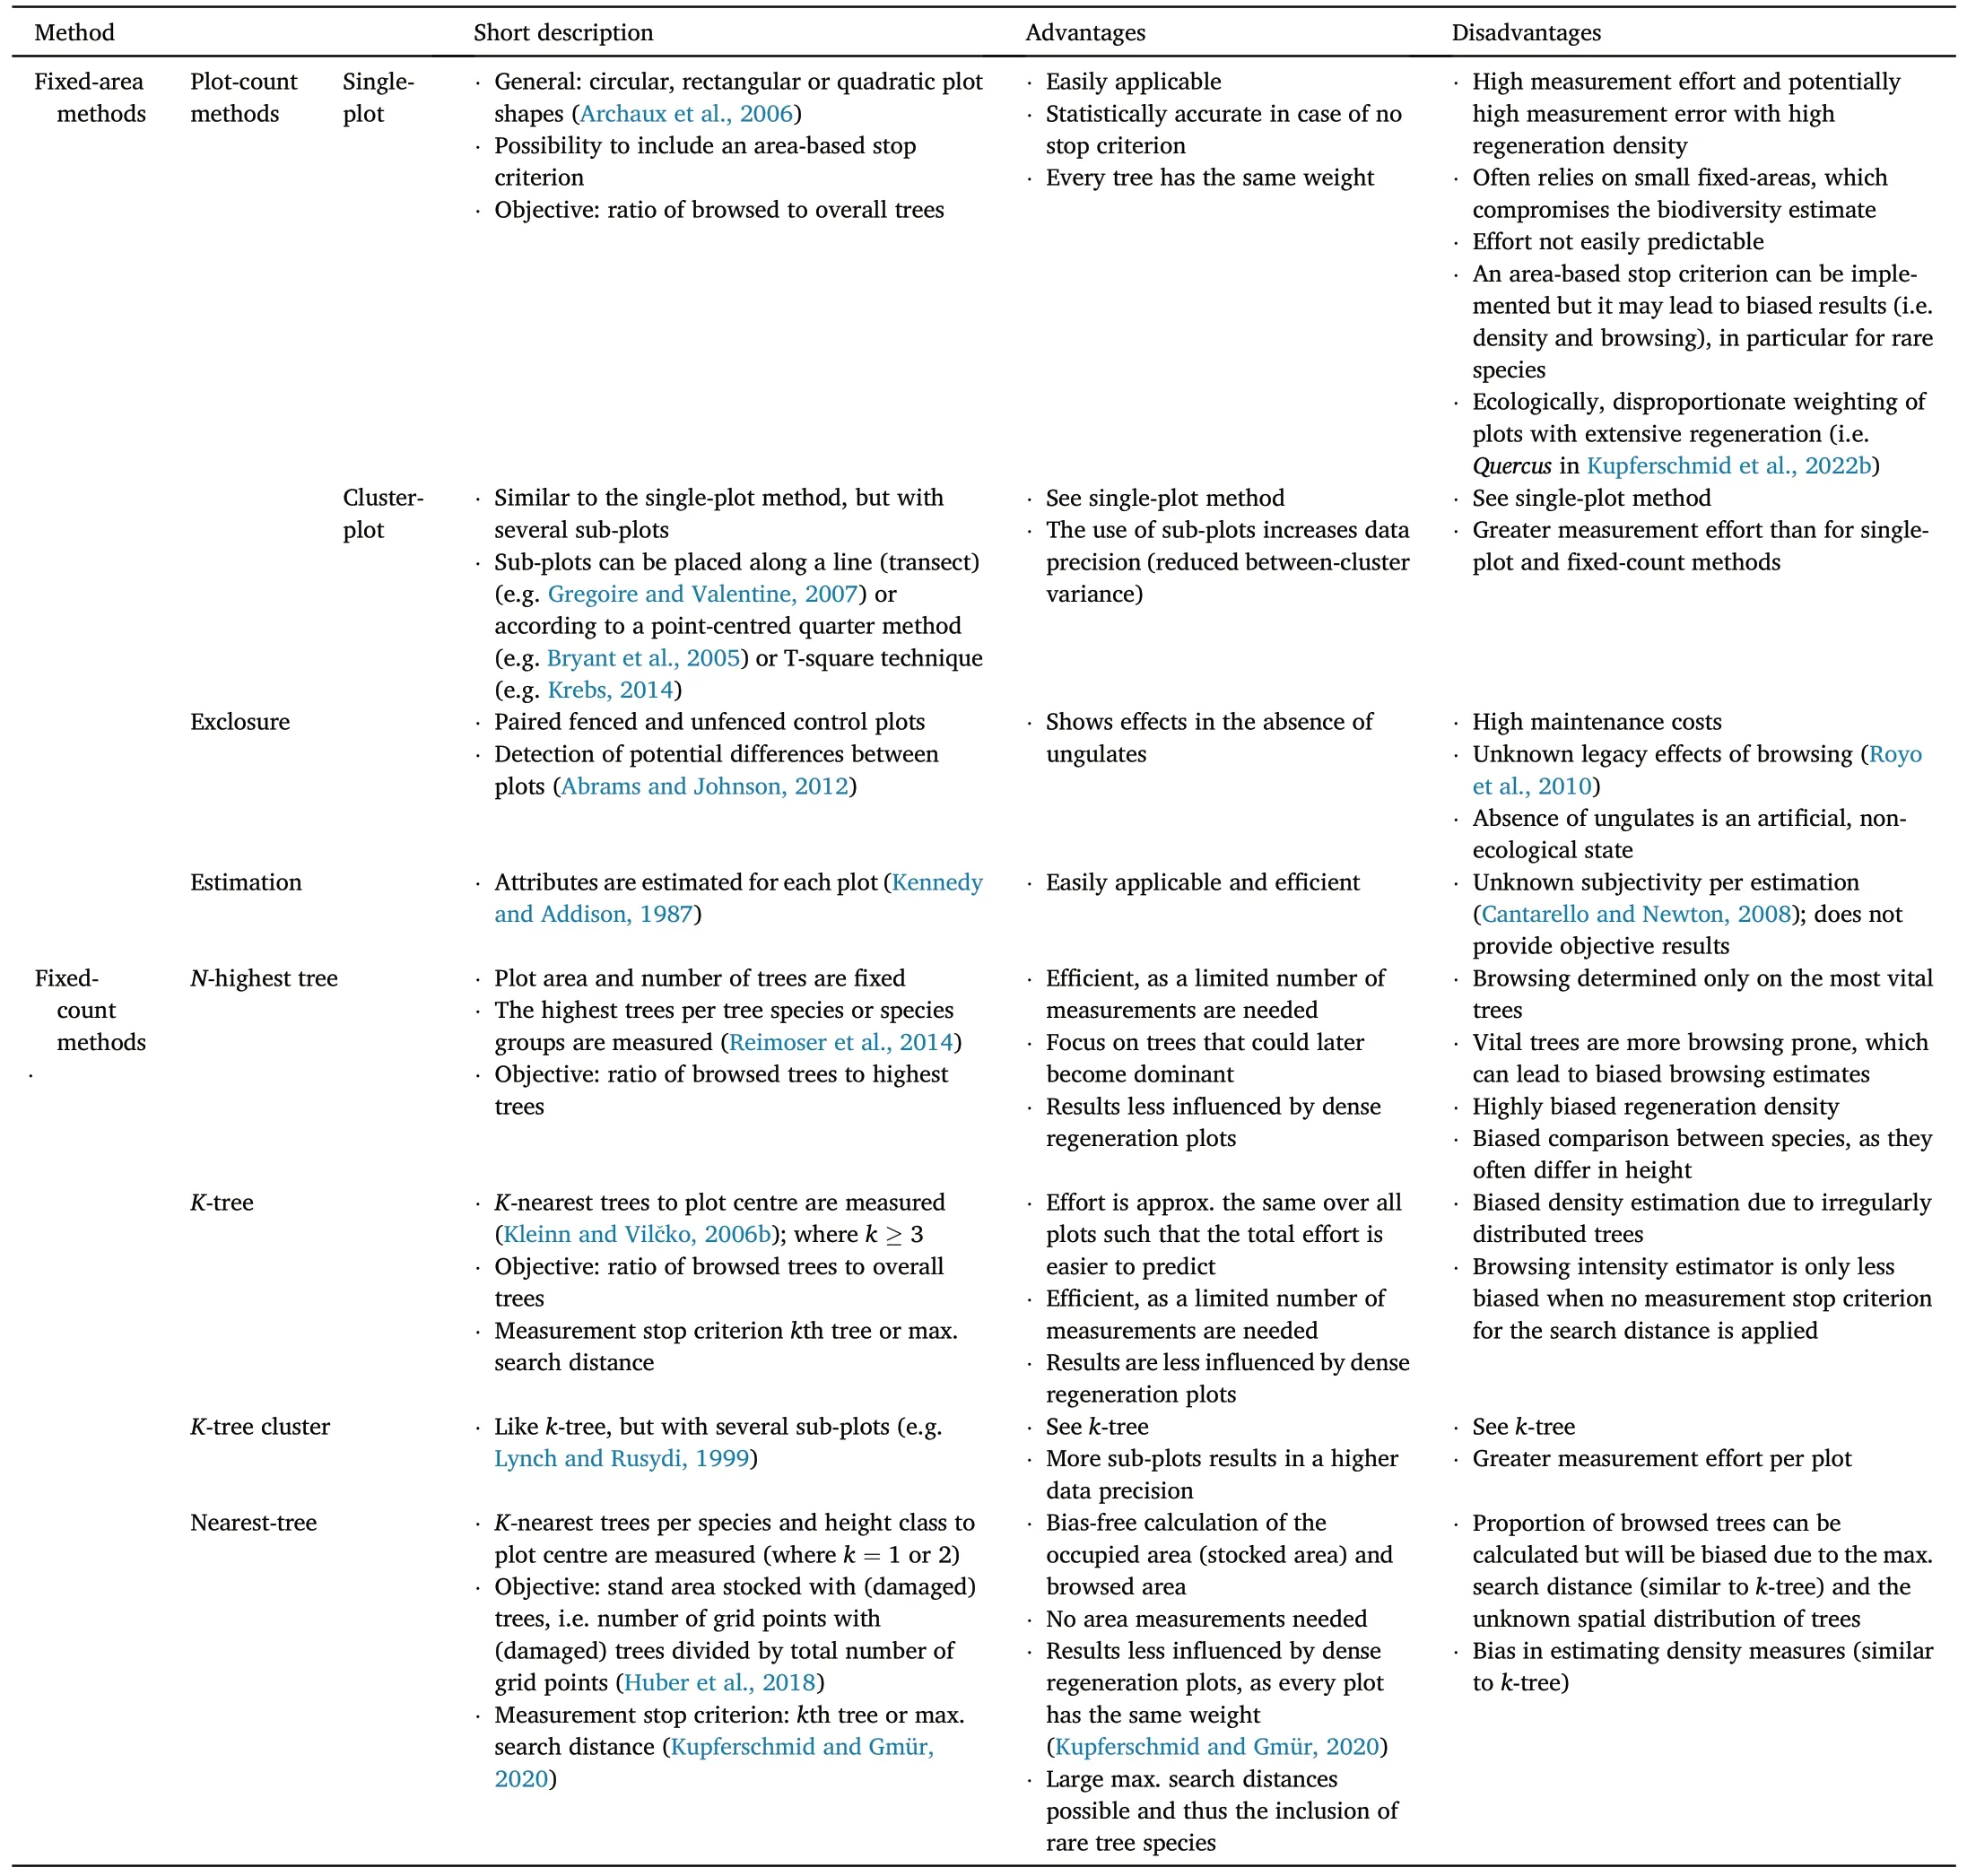
Table 1Overview of the methods used to assess browsing impact and their advantages/disadvantages.
3.1.2.Fixed-count method
In fixed-count, or distance-based, sampling methods, the distances between trees and a given point are measured.These methods can be divided into: i) k-tree, ii) k-tree cluster and iii) nearest-tree methods.In the k-tree method,a predefined number of trees irrespective of species(k,where k ≥3, but typically up to 20) needs to be measured, with the distance of the kth tree to the central plot point defining the plot size(Kleinn and Vilˇcko, 2006a).The k-tree cluster method uses the k-tree approach within a cluster plot design, i.e.a group of sub-plots.For practical reasons,a maximum search distance is defined until the kth tree is searched.The nearest-tree method is based on sampling the tree nearest to the plot centre and is thus a special form of the k-tree method with k <3.Compared with the k-tree method, the emphasis of the nearest-tree method is on the spatial distribution of the trees (Huber et al.,2018).While in the k-tree method the proportion of browsed trees to overall trees is calculated,in the nearest-tree method the proportion of the stocked area with browsed trees is calculated (Scott, 1998; Huber et al., 2018).Two variations of the nearest-tree method are currently applied as well: i) k-nearest tree measurements independent of tree species(i.e.per height class in the Swiss national inventory;Keller,2011)and ii)k-nearest trees per tree species and per height class(Kupferschmid and Gmür, 2020; Angst and Kupferschmid, 2023).The latter method is preferred because information on all tree species locally present are collected and thus various sites can be compared.Consequently, within this study,only the k-nearest tree method measured per tree species and tree height class is further considered (referred to in Table 1 as the‘nearest-tree method’).
In fixed-count methods, due to the definition of a maximum search distance and the constant workload per species, the measuring effort is generally lower than for fixed-area methods within regions with a relatively low number of tree species(Huber et al.,2018).For managers,the generally reduced working time simplifies both planning and the cost calculation of a browsing inventory (Kleinn and Vilˇcko, 2006a).In addition,fixed-count methods offer the advantage of covering larger plot areas and the inclusion of additional plots, thereby increasing the likelihood of including rare tree species (Bryant et al., 2005; Kramer and Akça, 2008; Ramezani et al., 2016).For fixed-area methods, this would be very labour-intensive such that very small fixed plots are often defined,as demonstrated in larger inventories over wildlife sectors(e.g.0.9 m,Düggelin et al.,2020;or 2 m,Kupferschmid and Gmür,2020).
3.1.3.N-highest tree method
In the N-highest tree method, the tallest trees per species or species groups are measured within a predefined plot (Reimoser et al., 2014;Rawinski,2018).Because both the plot area and the number of trees are fixed this method is placed between the fixed-area and fixed-count methods(Table 1).
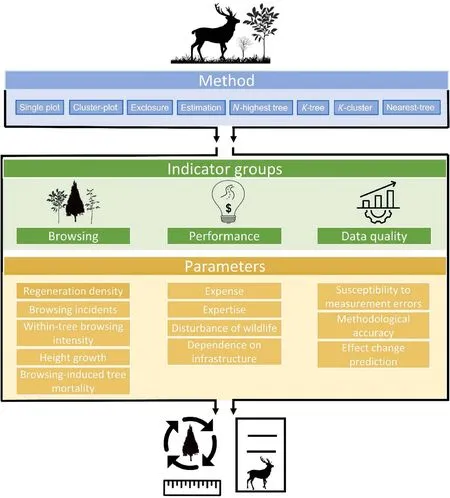
Fig.1.Overview of the current methods and indicators applied to measure the ungulate browsing impact.Parameters are assigned to three indicator groups:browsing indicators, performance indicators and data quality indicators.To serve as a monitoring tool for adaptive ungulate management, browsing inventories should be conducted regularly.
3.2.Indicator selection
In the second literature research,three types of indicator groups were considered important in the evaluation of browsing-impact monitoring methods:i)browsing indicators,ii)performance indicators and iii)data quality indicators (Fig.1).For browsing indicators, compositional and functional parameters were included as suggested by Noss (1990).Compositional parameters, such as regeneration density and stocked area, provide information on the spatial arrangement and condition of the tree regeneration, while functional parameters, which describe processes and severity, include browsing incidents, within-tree browsing intensity,height growth and browsing-induced tree mortality.Both types need to be included, because the application of only composition or functional parameters will not allow the detection of a browsing effect or may result in inadequate detection(Kupferschmid et al., 2022a).
Additional parameters evaluating the performance of browsingimpact monitoring methods were added to the matrix, namely expense,expertise,disturbance of wildlife and infrastructure dependence.Because different methods differing in their plot designs will differ in their statistical features,possible constraints were considered in the evaluation of the quality of the output data.Consequently, the following parameters,described as data quality indicators,were included in method evaluation:susceptibility to measurement errors,methodological accuracy and effect change prediction.
3.3.Grading of the selected indicators
To allow the selected parameters for each indicator group to be used as comparison criteria in a method-indicator matrix and thus to identify the most appropriate browsing-impact monitoring method, each of the above-mentioned parameters was graded according to its practicality,efficiency and objectivity.In this section,the categorisation and grading of each parameter are separately discussed for each of the three indicator groups.
3.3.1.Browsing indicators
3.3.1.1.Regeneration density.In studies on forest ecosystems, regeneration density is broadly desired information.Indeed,for some authors,the absolute tree density is a prerequisite for the determination of the extent of browsing incidents (Reimoser et al., 1999).For others, information about the stocked area per tree species is sufficient to evaluate the fulfilment of stocking goals (Stein, 1992; Huber et al., 2018).In the maintenance of biodiversity, it is more important to determine the presence/absence of rare species or neophytes in large plots rather than to accurately calculate the density in very small plots (as rare species or neophytes will mostly be absent).For a statistically accurate determination of tree density,either all trees on a plot or,to reduce the effort,a subset of randomly selected trees on a plot can be counted (Mandallaz,2006).With the random selection of trees,each subset should be representative of the entire area,such that selection should not be determined based on spatial location or qualitative tree characteristics such as tree height (Table 2).Methods with k-trees independent of tree species generally lead to higher biases in the density approximation per species than is the case with the nearest-tree method,as rare species may not be within the k-trees or may be randomly over-represented in the k-trees due to a clustered distribution.Categorisation and method grading differentiate among the steps used in density vs.stocked area calculations(Table 2).
3.3.1.2.Browsing incidents and within-tree browsing intensity.Measuring the number or proportion of browsing incidents is an integral step in regeneration monitoring.Attention needs to be paid to the form of the browsed shoots, as it suggests the animal responsible for browsing.For example, a smooth cut surface indicates browsing by hares, whereascervids tear off branches,resulting in frayed edges (i.e.Tremblay et al.,2007;Vowles et al.,2016).Incorrect identification of ungulate browsing(i.e.by inclusion of hare browsing or snow damage) can lead to an overestimation of browsing and thus to erroneous conclusions in ungulate management.In addition,understanding long-term ungulate effects on vegetation requires an examination of not only the frequency of browsing but also the strength of browsing of the leading shoot, also referred to as within-tree browsing intensity (Reimoser et al., 2014;Endress et al., 2016; Kupferschmid, 2018).This is crucial, as several studies have shown that ungulates can alter tree height growth responses,with the impact ranging from minimal to a complete suppression of growth (Côté et al., 2004) depending on the amount of tissue removed(Kupferschmid et al., 2015).Within-tree browsing intensity can be characterised,for example,according to whether browsing includes only the terminal buds,large part of the annual terminal shoot or even older terminal shoots(Kupferschmid et al.,2022a).Other possibilities include determinations of leader and lateral shoot browsing (e.g.Kuijper et al.,2013; van Beeck Calkoen et al., 2021).All of the methods described herein can be applied to evaluate browsing incidents and within-tree browsing intensity but they involve different levels of measurement effort that are determined by the number of trees to be measured(Table 2).

Table 2Grading and categorisation of browsing indicator parameters for each browsingimpact monitoring method.
3.3.1.3.Height growth.To estimate the impact of ungulate browsing,it is important to know whether browsing causes a shift in the growth rate ranking between species(cf.Krueger et al.,2009).This can be evaluated by measuring the height growth,followed by comparisons of the results between browsed trees and neighbouring trees at both the species and the interspecies level (Kupferschmid and Gmür, 2020; Angst and Kupferschmid,2023),which may reveal ungulate influence on tree growth in relation to the site conditions(Kupferschmid,2018).Additionally,based on the height growth per year of trees on a given site and the maximum height of the terminal shoot reachable by ungulates,the period that a tree is vulnerable to browsing can be estimated (e.g.time to reach 1.5 m height; Eiberle and Nigg, 1987; Reimoser et al., 1999).Height growth can theoretically be evaluated with all of the methods discussed herein,which, as already noted, will involve different levels of measurement effort (Table 2).To obtain information on different tree species and different height classes, more trees will have to be measured with the k-tree method than with the nearest-tree.However, as both methods require less measuring effort than other methods,due to the predefined number of trees,they are weighted equally here.
3.3.1.4.Browsing-induced tree mortality.Browsing may not only impair tree growth, it may also inhibit vitality to the extent that the tree dies.However,because the mortality of a tree seedling may have many other causes, involving biotic and abiotic factors,browsing-induced tree mortality should be verifiable.To detect browsing-induced mortality, individual mapping or the marking of selected trees and repeated assessment are crucial(Nomiya et al., 2003).An alternative is to exclude ungulates by fencing and evaluate the differences between the fended and unfenced control plots (Nopp-Mayr et al., 2023).In Table 2, the different browsing-impact monitoring methods are graded according to the measurement effort required for the individual mapping of selected trees.
3.3.2.Performance indicators
3.3.2.1.Expense.The successful implementation of a method depends on efficient work and sufficient financial resources.For long-term monitoring methods, securing finances can be problematic (Legg and Nagy, 2006).However, while expenses should not be reduced to the extent that achieving the desired results is no longer feasible(Mandallaz,2006),the costs of implementing a method for the desired time should be optimized.Within the grading of performance indicators, mainly material costs were considered, given that personnel costs are difficult to derive because they strongly vary depending on the level of experience and on administrative factors (i.e.contract structure), and the topography and accessibility of the monitoring site considerably influence the effort involved.Assuming that time-consuming methods induce higher personnel costs,estimations of material costs and the time spent on plots were considered in grade assignment(Table 3).
3.3.2.2.Expertise.The expertise needed to apply a method reflects the user-friendliness of that method.Ideally, a method should be easy to understand and implement, but not at the expense of the desired accuracy.Conversely, an overly complex method will discourage managers from its implementation and may incur higher costs (such as if experts are needed) and erroneous data recordings (Andreasen et al., 2001).Thus, for the parameter ‘expertise’, the grade reflects the knowledge needed to implement the method (Table 3).
3.3.2.3.Disturbance of wildlife.Browsing-impact monitoring may result in the disturbance of wildlife.The manifold effects of human activities on ungulates have been well characterised and include an increase in flight responses (Stankowich, 2008), shifts in day-activity patterns (Bonnot et al., 2020) and changes in habitat selection (Theuerkauf and Rouys,2008; Proffitt et al., 2009; Pelletier, 2014).Parameter categorisation in this study therefore differentiates between the time needed to conduct the measurements on each plot, depending on the plot design, and whether the method alters a natural, previously undisturbed site(Table 3).
3.3.2.4.Dependence on infrastructure.A method's dependence on infrastructure is a measure of the need for roads or tracks for its implementation.For example,if fences have to be constructed,then roads or in some alpine regions helicopters must be available to transport construction materials and workers, and to control or maintain the constructed structure (Reimoser et al., 2014).If construction or heavy equipment transport is not a prerequisite, the method's dependency on infrastructure is relatively small(Table 3).
3.3.3.Data quality indicators
3.3.3.1.Susceptibility to measurement errors.With an increasing number of measurements in the field, census exhaustion and thus an increased risk of measurement errors may occur, resulting in a higher overlooked rate, duplicative measurements (Avery and Burkhart, 2002; Archaux et al.,2006,2009)or the erroneous attribution of browsing to ungulates.In addition,the higher the number of measurements required,the greater the likelihood that more personnel will be needed.The differences in expertise can adversely affect the measurements and therefore the results(Archaux et al., 2006; Morrison, 2016).Consequently, susceptibility to measurement errors is categorised based on the measurement effort,i.e.the number of trees measured and the strength of the biases as a result of measurement errors(Table 4).
3.3.3.2.Methodological accuracy.The quality of the output data,i.e.the objectivity and intrinsic biases of data gathered in the field,is a reflection of the methodological accuracy.For example,if a method allows only for subjective data acquisition,neither the accuracy nor the estimation errorcan be calculated.In this case,later evaluations of the monitoring results or comparisons of the results over time cannot be regarded as robust.The extrapolation of values from completely sampled plots to a larger unit of area, e.g.a hectare, is easily possible when an area-based method has been used (see Table 1), due to easily calculable expansion factors(Kleinn and Vilˇcko, 2006b).However, if a stop criterion (e.g.measurements are stopped after n trees or only a fraction of the plot area is measured) is applied to reduce the effort and the measured part of the plot is not representative of the whole plot,an over-or underestimation may result(Reimoser et al.,2014;Rawinski,2018)(Table 4).The spatial arrangement of the trees is also important in avoiding systematic bias,inthe case of irregularly spaced trees(Kupferschmid and Gmür,2020).This holds true for methods based on fixed areas (in particular, with small plots) and especially for methods in which the density calculation is based on the distance to the plot centre of k tree.That is,if k+1 and not only k trees have been included,the distance to the plot centre may be the same,due to groups of regenerating trees,and the density will therefore be underestimated.Thus, for this parameter, categorisation reflects the possibility of intrinsic bias arising after field measurements(Table 4).
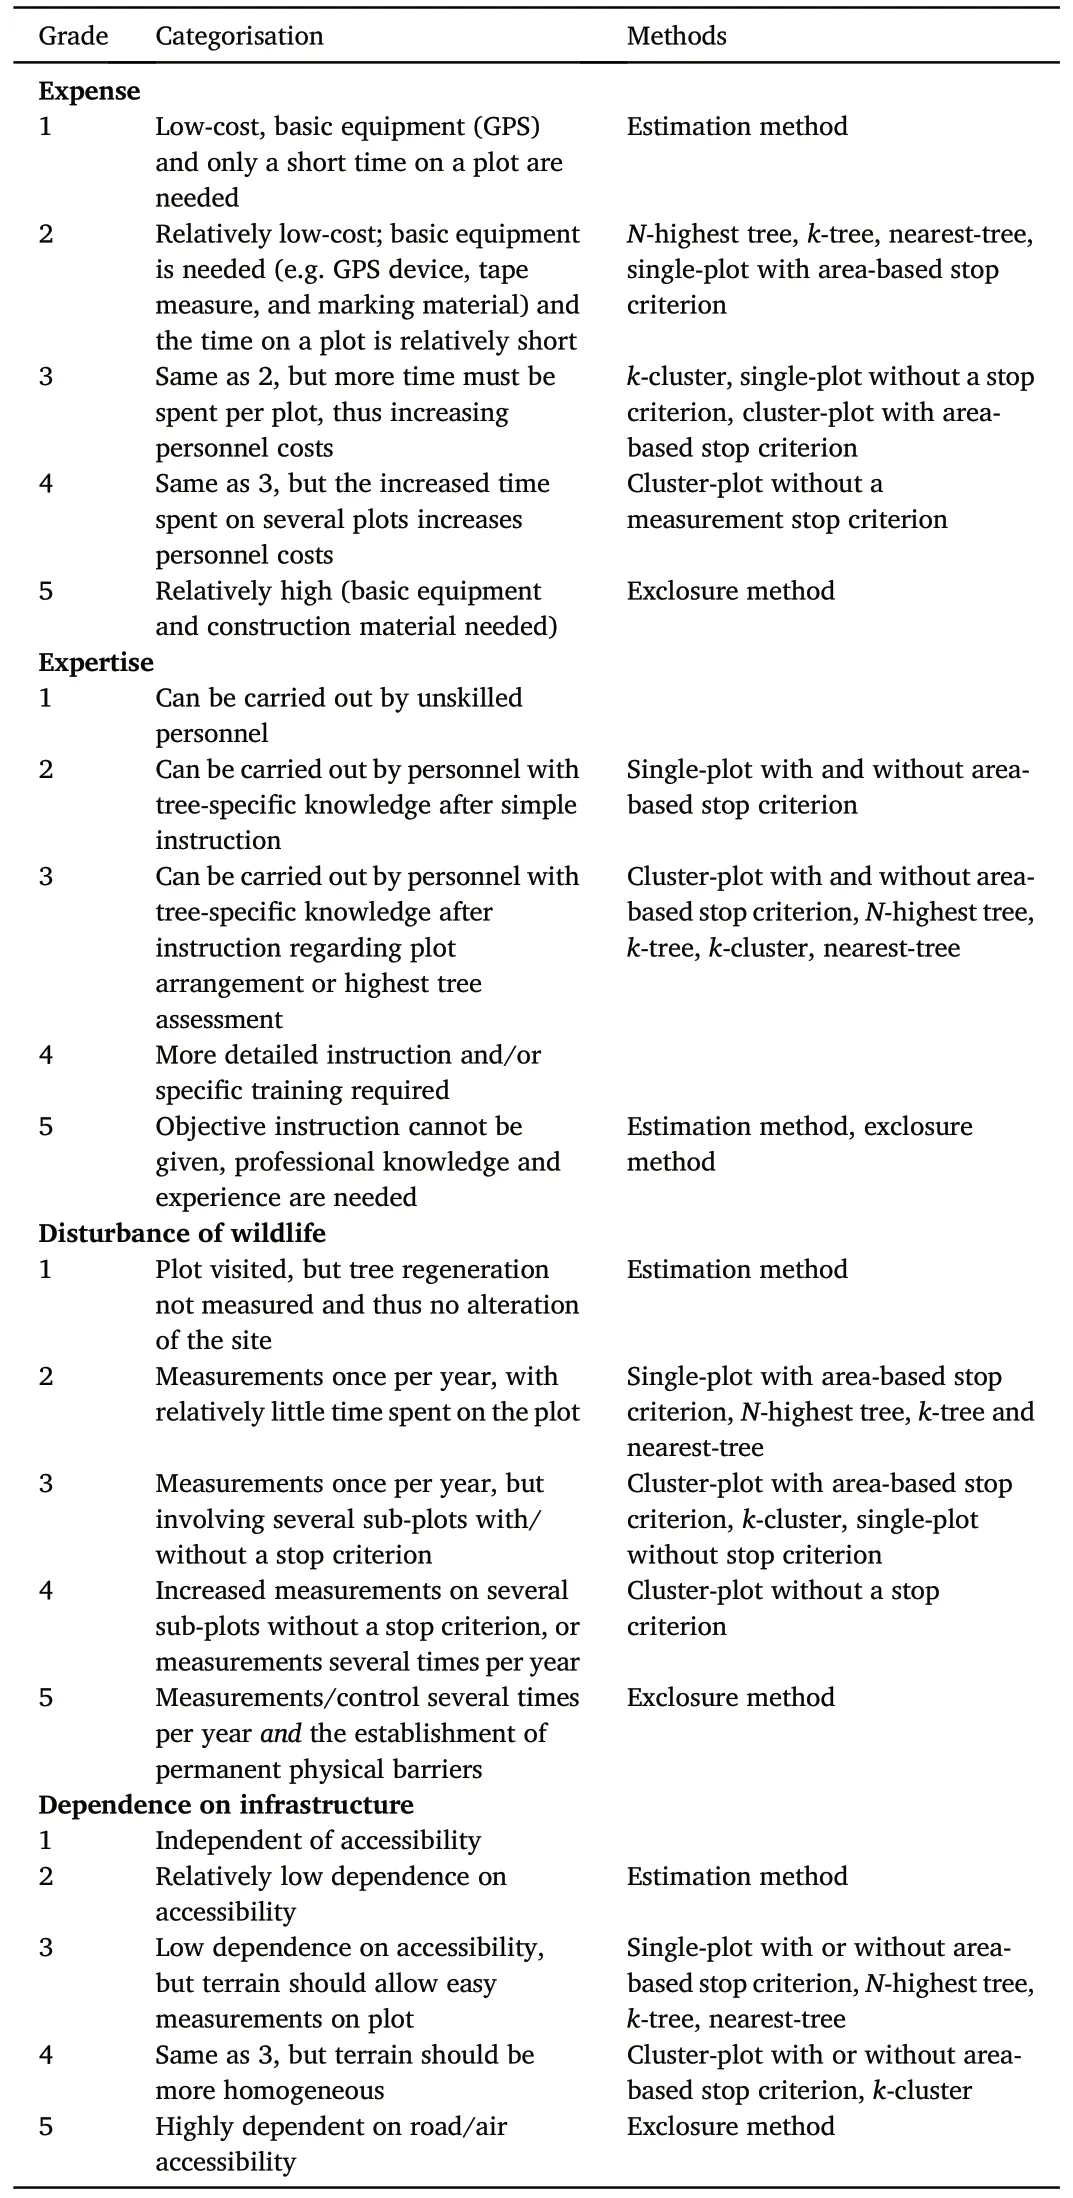
Table 3Grading and categorisation of performance indicator parameters for each browsing-impact monitoring method.

Table 4Grading and categorisation of data quality indicator parameters for each browsing-impact monitoring method.
3.3.3.3.Effect change prediction.For an optimal evaluation of monitoring results, the monitoring method should provide information not only on the current ungulate effect, but also on the change of the effect over time.For example,repeated measurements are crucial for detecting and evaluating the changes resulting from a browsing impact, e.g.in species composition.Therefore, the method should allow for repeated measurements of the same tree without influencing either its growth or other characteristics.The latter can also result from a monitoring method that indirectly affects plant growth, such as one that requires the placement of fences (Bergstr¨om and Edenius,2003;Table 4).
3.4.Final method-indicator matrix
The different monitoring methods and indicators were combined to form a matrix that allows evaluation of the various browsing-impact monitoring methods.Within the resulting method-indicator matrix(Table 5),each column represents a monitoring method identified in the literature search and each row reports the grade of the method for each of the above-described parameters for each indicator group.The parameters will differ in their relative importance depending on the management purpose.By altering the weighting of the different parameters,the matrix can be easily adjusted as needed.The following section provides an example of the derivation of the weights and the application of the method-indicator matrix.
3.5.Example:selection of a monitoring method for German national parks
The method-indicator matrix was used to select the most suitable monitoring method for large-scale browsing monitoring in terrestrial German national parks.During a workshop held in 2019, the national park's wildlife management authorities identified the objectives of wildlife management and their requirements for a browsing-impact monitoring method.Discussions during the workshop were fundamental to the derivation of weights(1-4)for each of the indicators in the matrix,with higher weights reflecting a greater importance as identified by the wildlife management authorities.
Generally, the need for an effective browsing-impact monitoring system was highlighted by all of Germany's national parks.Within the workshop,the advantages and disadvantages of the indicators,available resources as well as priorities were discussed.After all browsing indicators were presented,the national park representatives agreed that all indicator parameters were highly important and should be included in monitoring (weighting = 4).Specifically, among the performance indicators, disturbance of wildlife and dependence on infrastructure were identified as least important (weighting = 1), followed by expertise(weighting=2),while expense was identified as important(weighting=3), resulting in an average weighting of 1.8 for all performance indicators.Among the data quality indicators,the ability to detect changes in browsing over time was identified as the most important(weighting=4), the possibility of intrinsic bias after field collection as relatively important(weighting=3)and the susceptibility to measurement errors in the field as less important (weighting = 2), resulting in an overall weight of 3.Based on the weights added to the method-indicator matrix,the nearest-tree method scored highest, with a grade of 1.9, closely followed by the single plot with an area-based stop criterion,with a grade of 2.0,and the k-tree method,with a grade of 2.1(Table 6).
An important advantage of the nearest-tree method is its relatively simple and bias-free estimation of the browsing indicators.Although the inclusion of height growth measurements was graded equally in the ktree and nearest-tree methods,as in both the measuring effort is less than in other methods,the nearest-tree method reduces structural bias caused by differences in regeneration density and tree diversity.This can be explained by the differences in the measured trees:while the nearest-tree method measures k-trees per tree species and per height class,the k-tree method measures the nearest x number of trees within a maximum search distance irrespective of tree height and species.Consequently,within the k-tree method there will be a high bias for rare species,depending on whether they are included or excluded by chance.To minimise this bias, more trees have to be measured in order to obtain information on different tree species and different height classes than in the nearest-tree method, increasing effort and personnel costs.In addition, compared to the nearest-tree method, the effort to measure the above-mentioned browsing indicator parameters on single plots is extremely high.In case of an area-stop criterion, the area size and therefore the effort are reduced but at the potential risk of a high over-or underestimation of browsing and of biases for rare species.However,the main disadvantage of the nearest-tree method according to most wildlife monitoring representatives is that exact browsing intensity cannot becalculated:instead,the proportion of the stocked area with browsed trees can be calculated,which is also important for silvicultural decisions.All wildlife monitoring representatives of the German terrestrial national parks agreed that information on rare species was more important for national parks than calculating browsing intensity and therefore chose the nearest-tree method for the implementation of browsing-impact monitoring in German terrestrial national parks.
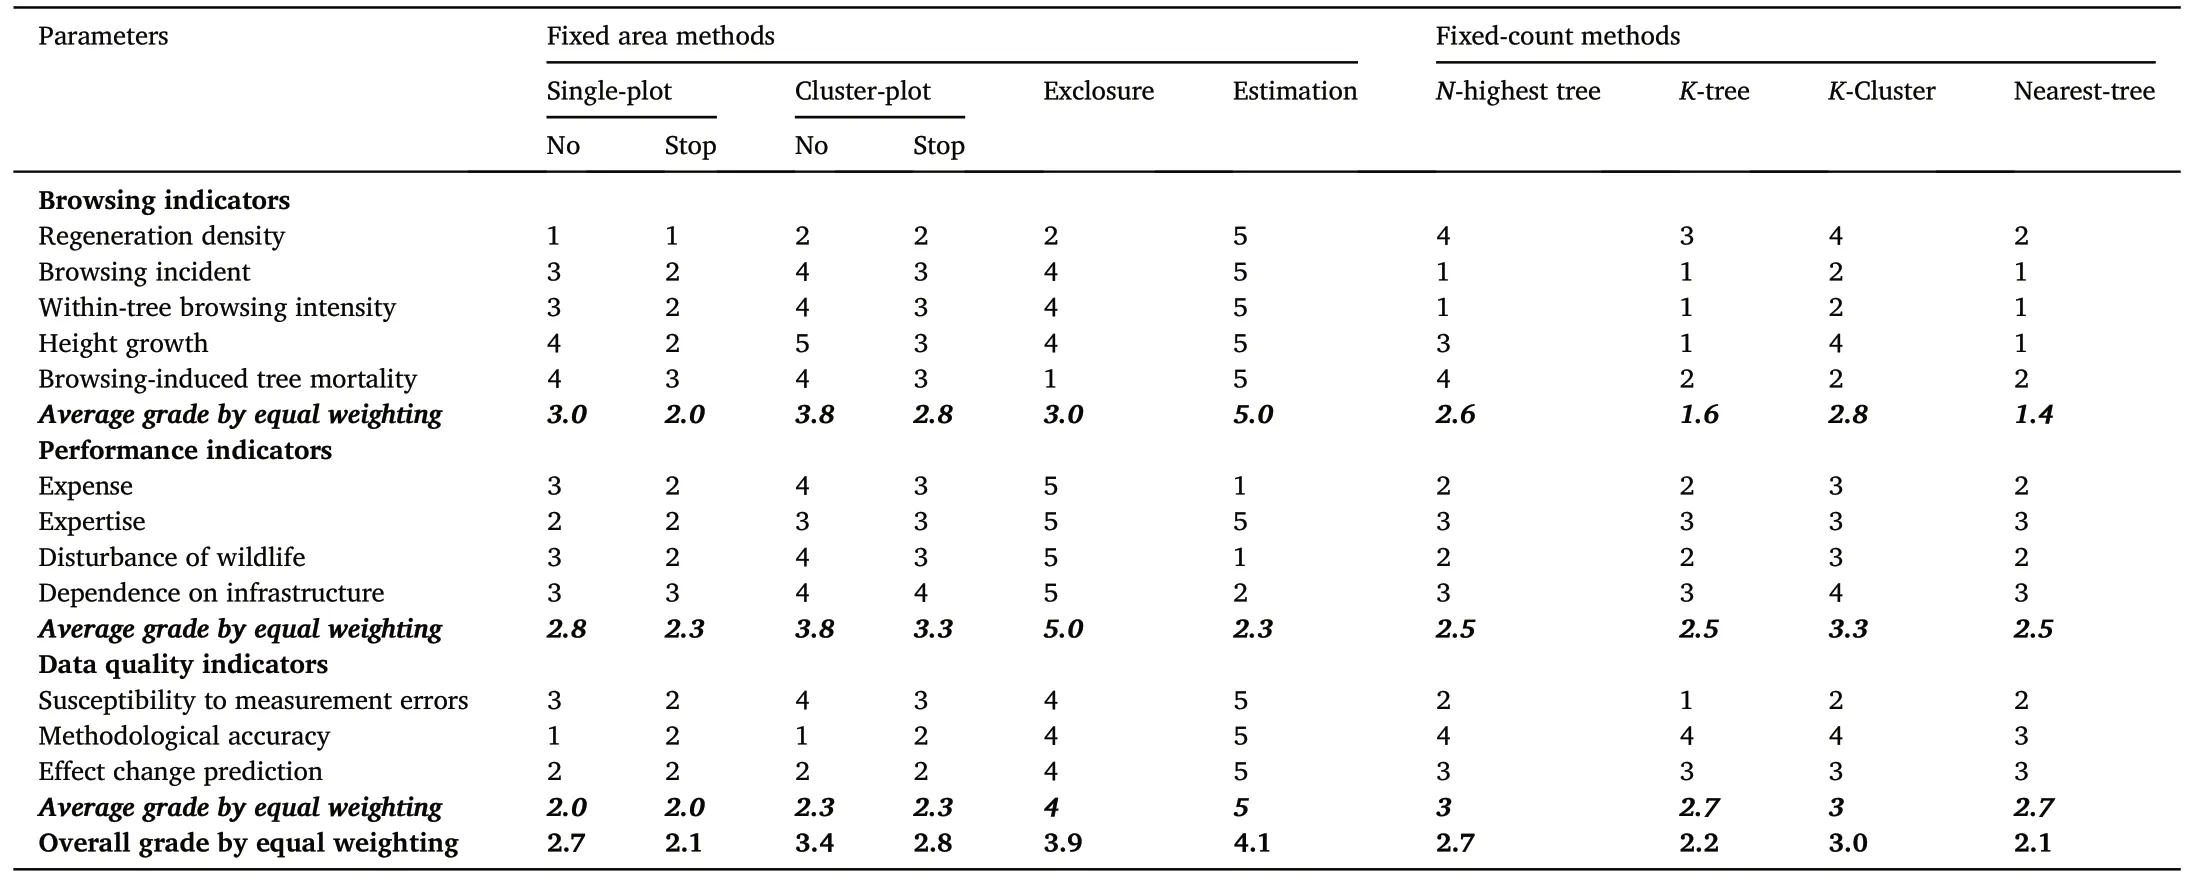
Table 5Final method-indicator matrix.Each column represents one of the browsing-impact monitoring methods identified in the literature review and each row reports the respective grade for each of the parameters identified.For each of the indicator groups (browsing indicators, performance indicators and data quality indicators), an overall grade was calculated assuming equal weighting.
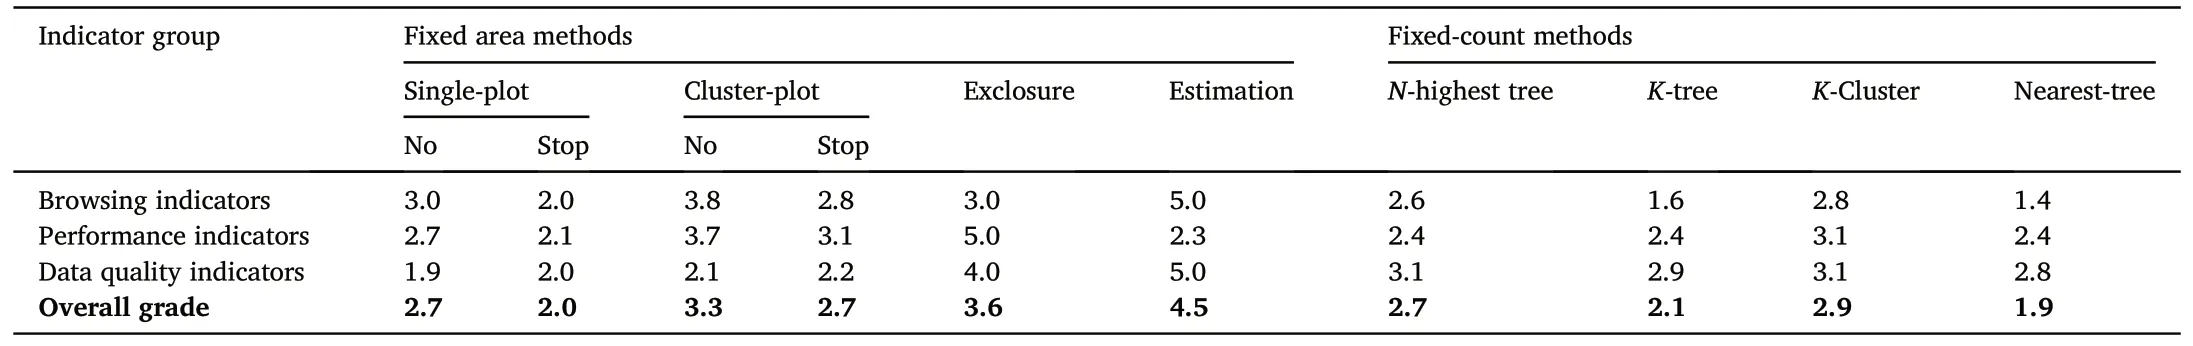
Table 6Overview of the average grades for each browsing-impact monitoring method calculated for each of the indicator groups based on the individual weights assigned to each parameter.Grades were calculated as follows: Sum (grade parameter ×weighting factor for each parameter)/Sum (weighting factors for all parameters).
4.Discussion
Ungulate browsing often affects tree regeneration and thus prevents the achievement of economic or conservation goals.An assessment of the impact of browsing must have a sound scientific basis.However, while the importance of the indicators cited in this study is well-recognised,they have yet to be considered when planning a browsing-impact monitoring, either because managers are not aware of the respective parameters or because a lack of resources hinders their assessment.This study is the first to summarise current browsing-impact monitoring methods and associated indicators, including the advantages and disadvantages of those methods.The information was used to develop an evaluation matrix that facilitates the selection by forest managers of a scientifically appropriate method to measure ungulate browsing impact based on site-specific requirements and other constraints.
Several different approaches to continuous browsing-impact monitoring have been applied, with monitoring methods strongly differing within and between countries.For example, in Germany, the methods differ between German federal states, with little consensus regarding their use (Wotschikowsky, 2010).In the United Kingdom, browsing is monitored depending on the forest ownership structure,with no formal monitoring in privately owned forests (Reimoser and Putman, 2011).However, the diversity of monitoring methods prevents direct comparisons between areas (e.g.Reimoser et al., 2014), although the data are essential to an open and informed public debate about ungulate management and the associated trade-offs.The method-indicator matrix presented herein enables data comparability between monitoring methods, by allowing managers to easily identify methodological differences.As such, application of the method-indicator matrix supports the harmonization of browsing-impact monitoring across multiple areas.
For wildlife and forest managers, the choice of monitoring method must take into account local conditions and resources.While the decision-making benefits conferred by using the method-indicator matrix and thus allows a harmonization in the decision process, there is no universally appropriate method.In addition,single indicator parameters may be so important that their inclusion is an obvious choice.For example, in our case study of Germany's national parks, given the importance of height growth measurements and information on rare species, the nearest-tree method was selected, in which the nearest two trees per tree species and height class are measured.Furthermore,although most studies on the impact of ungulates on forest regeneration focus on browsing impact, bark-stripping and fraying can strongly influence the broader forest ecosystem as well.Bark-stripping strongly differs between tree species and forest stands but generally enables fungal infections,leading to growth reductions(Gill,1992;Cukor et al.,2019), while fraying promotes tree mortality (Motta, 2003).Consequently,any assessment of the overall impact of ungulates on forest ecosystems must include bark-stripping and fraying measurements.As fraying often affects trees within browsing range(Gill,1992),its impact can be easily assessed during a browsing-impact assessment by using the k-tree or nearest tree method.
As stated by Dale and Beyeler(2001),a key challenge of monitoring programs is to find a mix of measures which give interpretable signals,can be used to track the ecological condition as at reasonable cost and cover the spectrum of ecological variation.Ideally,ecological indicators need to capture ecosystem complexity, are sufficiently sensitive to provide an early warning for change and should be easy and cost-effective to measure that allows them to be measured repeatedly (Noss, 1990; Dale and Beyeler, 2001).We believe we included a complete range of functional, structural and compositional indicators, identified through our literature review, necessary to assess ungulate browsing that form the basis for adaptive ungulate management.Even though the indicators included within this study are relatively easily measured and are sensitive to stresses on the system (Dale and Beyeler, 2001), they will not provide an explanation of the differences in ungulate browsing found over time or between different areas.Ungulate browsing is a multifactorial complex phenomenon where ungulate density estimates,ungulate community structure, vegetation cover, forest composition and light availability affect the incidence of browsing (Bergqvist et al., 2014;Churski et al.,2017;Kupferschmid et al.,2020).As the risk of browsing is related to both forest structure and ungulate community, forestry and wildlife management are intertwined.Consequently, browsing-impact monitoring is highly important to understand forest dynamics and to reduce browsing impacts.
In conclusion,in this study a scientific tool was created to aid in the selection of the most appropriate method of browsing-impact monitoring.The resulting method-indicator matrix, in which the advantages and disadvantages of each method are highlighted,can guide managers in their selection of the most appropriate method to measure the impact of ungulate browsing.Moreover, both weighting and grading can be adapted to local conditions as needed,to ensure the selection of the best browsing-impact monitoring method.Thus, our study enables a more scientifically based objectification of the methods used to assess the frequency of ungulate browsing, which has important management and conservation implications.Nonetheless, a truly objective assessment of the ungulate browsing impact on forest regeneration can only be obtained by including all of the browsing indicators considered in this study(e.g.Kupferschmid et al., 2022a).In addition, to serve as a monitoring tool for adaptive ungulate management,browsing inventories should be conducted regularly,and management targets should be clearly defined to allow comparison between different regions over time.
CRediT authorship contribution statement
Suzanne T.S.van Beeck Calkoen:Methodology,Validation,Writing- original draft.J′er^ome Milch:Conceptualization, Methodology,Writing - original draft.Andrea D.Kupferschmid:Conceptualization,Methodology, Writing - review & editing.Christian Fiderer:Conceptualization, Funding acquisition, Methodology, Project administration,Writing-review&editing.Marco Heurich:Conceptualization,Funding acquisition,Methodology,Supervision,Writing-review&editing.
Declaration of competing interest
The authors declare that they have no known competing financial interests or personal relationships that could have appeared to influence the work reported in this paper.
Acknowledgements
The present publication is a partial result of the R&D project ‘Ungulate monitoring in German national parks’(FKZ:3518 83 0200),which is supported by the Federal Agency for Nature Conservation (BfN).
Appendix A.Supplementary data
Supplementary data to this article can be found online at https://doi.i.org/10.1016/j.fecs.2023.100147.
杂志排行

Forest Ecosystems的其它文章
- Divergent responses of Picea crassifolia Kom.in different forest patches to climate change in the northeastern Tibetan Plateau
- Tree-based ecosystem services supply and multifunctionality of church forests and their agricultural matrix near Lake Tana, Ethiopia
- Influence of climate fluctuations on Pinus palustris growth and drought resilience
- Nutrient retranslocation strategies associated with dieback of Pinus species in a semiarid sandy region of Northeast China
- Book review “Continuous Cover Forestry - Theories, Concepts, and Implementation” by Arne Pommerening
- Impact of black cherry on pedunculate oak vitality in mixed forests:Balancing benefits and concerns