DRC-Net Method for Two-dimensional Spectral Classification
2024-01-16MingRuZhangJunPingGaoBoQiuYuanPuXiaoMinWangRongLiandYaWenFan
Ming-Ru Zhang, Jun-Ping Gao, Bo Qiu, Yuan Pu, Xiao-Min Wang, Rong Li, and Ya-Wen Fan
1 Hebei University of Technology, Tianjin 300400, China; gaopingcn@126.com, qiubo@hebut.edu.cn
2 Guangdong Baiyun University, Guangzhou 510450, China; puyuan@baiyunu.edu.cn Received 2023 May 29; revised 2023 June 10; accepted 2023 June 24; published 2023 October 25
Abstract Spectral classification plays a crucial role in the analysis of astronomical data.Currently, stellar spectral classification primarily relies on one-dimensional (1D) spectra and necessitates a sufficient signal-to-noise ratio(S/N).However,in cases where the S/N is low,obtaining valuable information becomes impractical.In this paper,we propose a novel model called DRC-Net (Double-branch celestial spectral classification network based on residual mechanisms)for stellar classification,which operates solely on two-dimensional(2D)spectra.The model consists of two branches that use 1D convolutions to reduce the dimensionality of the 2D spectral composed of both blue and red arms.In the following,the features extracted from both branches are fused,and the fused result undergoes further feature extraction before being fed into the classifier for final output generation.The data set is from the Large Sky Area Multi-Object Fiber Spectroscopic Telescope, comprising 15,680 spectra of F, G, and K types.The preprocessing process includes normalization and the early stopping mechanism.The experimental results demonstrate that the proposed DRC-Net achieved remarkable classification precision of 93.0%,83.5%,and 86.9% for F, G, and K types, respectively, surpassing the performance of 1D spectral classification methods.Furthermore, different S/N intervals are tested to judge the classification ability of DRC-Net.The results reveal that DRC-Net, as a 2D spectral classification model, can deliver superior classification outcomes for the spectra with low S/Ns.These experimental findings not only validate the efficiency of DRC-Net but also confirm the enhanced noise resistance ability exhibited by 2D spectra.
Key words: instrumentation: spectrographs – methods: statistical – techniques: image processing
1.Introduction
In recent years, there has been an exponential growth in astronomical data due to the advancements in large-scale sky surveys such as the Sloan Digital Sky Survey(Lyke et al.2020),the Large Sky Area Multi-Object Fiber Spectroscopic Telescope(LAMOST) (Lu et al.2021), the Five-hundred-meter Aperture Spherical radio Telescope (Ching et al.2022), and the Dark Energy Survey (Lahav et al.2020).Among the fundamental tasks in astronomical data analysis, stellar spectral classification is always an important task.The Morgan–Keenan system(Morgan & Keenan 1973), based on template matching, is the most widely used classification system.It categorizes stars into seven classes (O, B, A, F, G, K, M) according to their temperatures,with each class further divided into ten subclasses ranging from 0 to 9.
With the continuous development of machine learning theories, researchers have introduced machine learning into astronomical research and proposed various spectral classification algorithms (Schmidhuber 2015; Müller 2016; Hon et al.2017; Fabbro et al.2018).However, machine learning algorithms are often limited by their feature extraction and generalization capabilities, leading to suboptimal performance.Deep learning algorithms, as a branch of machine learning known for their powerful feature extraction capabilities, have also achieved excellent results in the field of astronomy.
Sharma et al.(2020) were the pioneers in applying Convolutional Neural Networks(CNNs)to spectral classification tasks and comparing them with the Random Forest algorithm.Their findings demonstrated that CNNs achieved higher classification accuracy than the Random Forest algorithm.Building on this work,Liu et al.(2019)introduced a supervised algorithm for stellar spectra classification based on stellar spectra convolutional neural network (SSCNN), an automatic celestial spectral classification algorithm based on one-dimensional (1D)CNNs.Experimental results showcased the superior performance of SSCNN over classical machine learning algorithms like Random Forest (Breiman 2001), Artificial Neural Network(Zupan 1994),K-Nearest Neighbor(Abeywickrama et al.2016),and Support Vector Machines (Huang et al.2018) in terms of classification accuracy.Similarly,Zheng et al.(2020)proposed a semi-supervised model composed of Semi-Supervised Learning with Generative Adversarial Networks (SGAN) and CNN to achieve the classification of O-type stars.
While 1D spectral-based classification algorithms have shown good results, and astronomers continue to conduct research based on 1D spectra, there remain challenges in the field of astronomy that cannot be fully addressed by 1D spectra alone.In the latest release of the LAMOST DR8 data set,approximately 20%of the spectral data had to be discarded due to low signal-to-noise ratio(S/N),owing to them being unable to generate valuable 1D spectra.Furthermore,two-dimensional(2D) spectra, as the raw data of target objects, inherently possess more features compared to their 1D counterparts.
Therefore, this study proposes the DRC-Net model, which directly leverages 2D spectra for stellar subclass classification.We compare its performance with that of 1D and 2D spectral classification algorithms.Additionally,we investigate low-S/N spectral data and analyze such spectra in the 2D domain,aiming to study the noise resistance ability of 2D spectra.
2.Data Processing
2D spectra data set used in this paper is from LAMOST.The telescope consists of 16 spectroscopes and 32 CCD cameras.Each camera has 250 optical fibers and simultaneously images the blue and red arms of the fibers to obtain the raw 2D spectra,as shown in Figure 1.
Each of the original 2D spectral images, both from the blue and red arms,contains 250 individual spectral stripes.The data used in the experiment are the stripes obtained by segmenting the original images.Due to the extreme imbalance in aspect ratio,only a portion of a stripe is shown in Figure 2,with a size of 15×150.The horizontal and vertical directions correspond to the wavelength and spatial directions of a 2D spectrum,respectively.
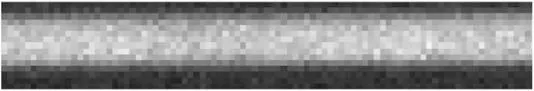
Figure 2.Example plot of a single 2D spectrum.
The data preprocessing stage in the early phase of the experiment involves two main steps: slicing and normalization.In the original images, the 2D spectra are densely packed, which can lead to potential contamination between adjacent spectra.Furthermore, as depicted in Figure 2, pixels closer to the center of the 2D spectral image exhibit higher brightness and contain more valuable information.Therefore,in the spatial direction, only 11 pixels expanding outward from the center pixel are selected for this experiment.In the wavelength direction, 3000 pixels ranging from 500 to 3500 are chosen as input data,as this range is known to sufficiently capture the characteristics of most stars.To include all pixels as input would bring more noise rather than additional features.
Normalization of 2D spectra is done to facilitate model convergence.In this study,the widely used Z-score method in machine learning is employed for data normalization.This method transforms the data set into one having a mean of 0 and a standard deviation of 1, for ensuring proper contrast between different 2D stripes.Equation (1) presents the formula for the Z-score method,where mean and std represent the mean and standard deviation of the batch of data(11 × 3000 spectral data), respectively.x denotes the value of a specific sample in the data, and z represents the normalized result of the sample
2.1.Data Set
The main focus of this experiment is the star classification of F,G,and K types,as well as the examination of the anti-noise performance of 2D spectra.The complete data set consists of 4500, 6500, and 4680 2D spectra for the three types,respectively.During the data set construction process, the data are categorized into four intervals based on the S/N of r-band (S/N_R): S/N_R > 30, 20 < S/N_R < 30, 10 30 contains the biggest number of spectra, and the subset with the submaximal number falls into the S/N_R<10 interval.Hence, in this experiment, the high-S/N data is utilized for training, and the low-S/N spectra are used for testing.The specific process of constructing the experimental data set is depicted in Figure 4, which illustrates the steps.

Figure 3.Data distribution according to S/N_R.
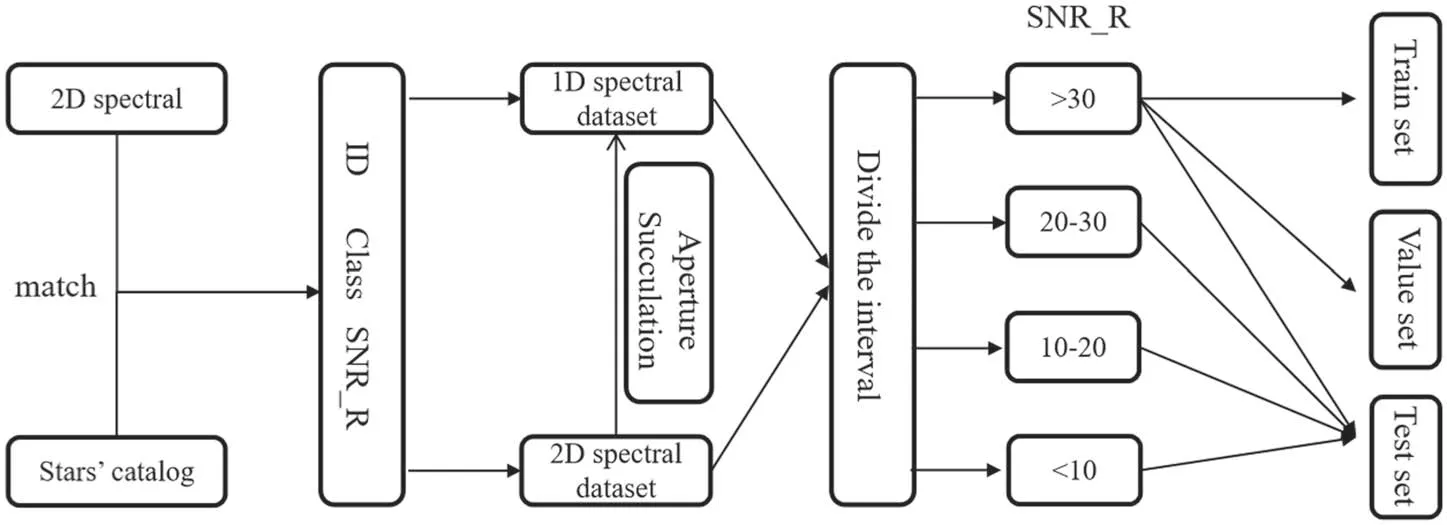
Figure 4.Data set construction flowchart.
1.A comparison is conducted between the local 2D spectra and the stellar catalog to obtain information such as the ID, class, and S/N of the 2D spectra.
2.The data is categorized and saved as a 2D spectral data set.
3.Employing the aperture extraction method (Ritter et al.2014),the corresponding 1D spectral data set is generated based on the 2D spectral data set.
4.Based on the acquired S/N information, the data with S/N_R>30 is divided into training,validation,and testing sets in an 8:1:1 ratio.In addition,in order to ensure fairness,the training set, validation set, and test set used in all experiments are the same.Then the data from other S/N ranges are uniformly added into the testing set to evaluate the model’s robustness.The specific division details of the experimental data set are presented in Table 1.
3.Network Structure
This chapter introduces the 1D method(RC-Net)and the 2D method (DRC-Net), and analyzes their network structures in detail based on the structure diagrams.
3.1.RC-Net
RC-Net (Zou et al.2020) is a highly effective 1D spectral classification model in galaxy, quasar, and stellar classification.The model architecture is depicted in Figure 5.It consists of eight identical convolutional modules,each comprising a max pooling layer and a residual module.The key aspect of the residual module is the inclusion of skip connections between consecutive convolutional layers, which facilitates feature reuse and effectively addresses the issue of vanishing gradients in deep networks.In Figure 5, each residual connection comprises a 1 × 1 convolutional layer and three 1 × 3 convolutional layers.The three 1×3 convolutional layers focus on feature extraction,while the 1 × 1 convolutional layer, referred to as the skip connection layer, performs dimension transformation.The dimensions of input and output are aligned to ensure that they can be fused.Following each residual module, a max pooling layer is employed to compress the feature dimensions, reducing computational complexity and ensuring faster training speed.
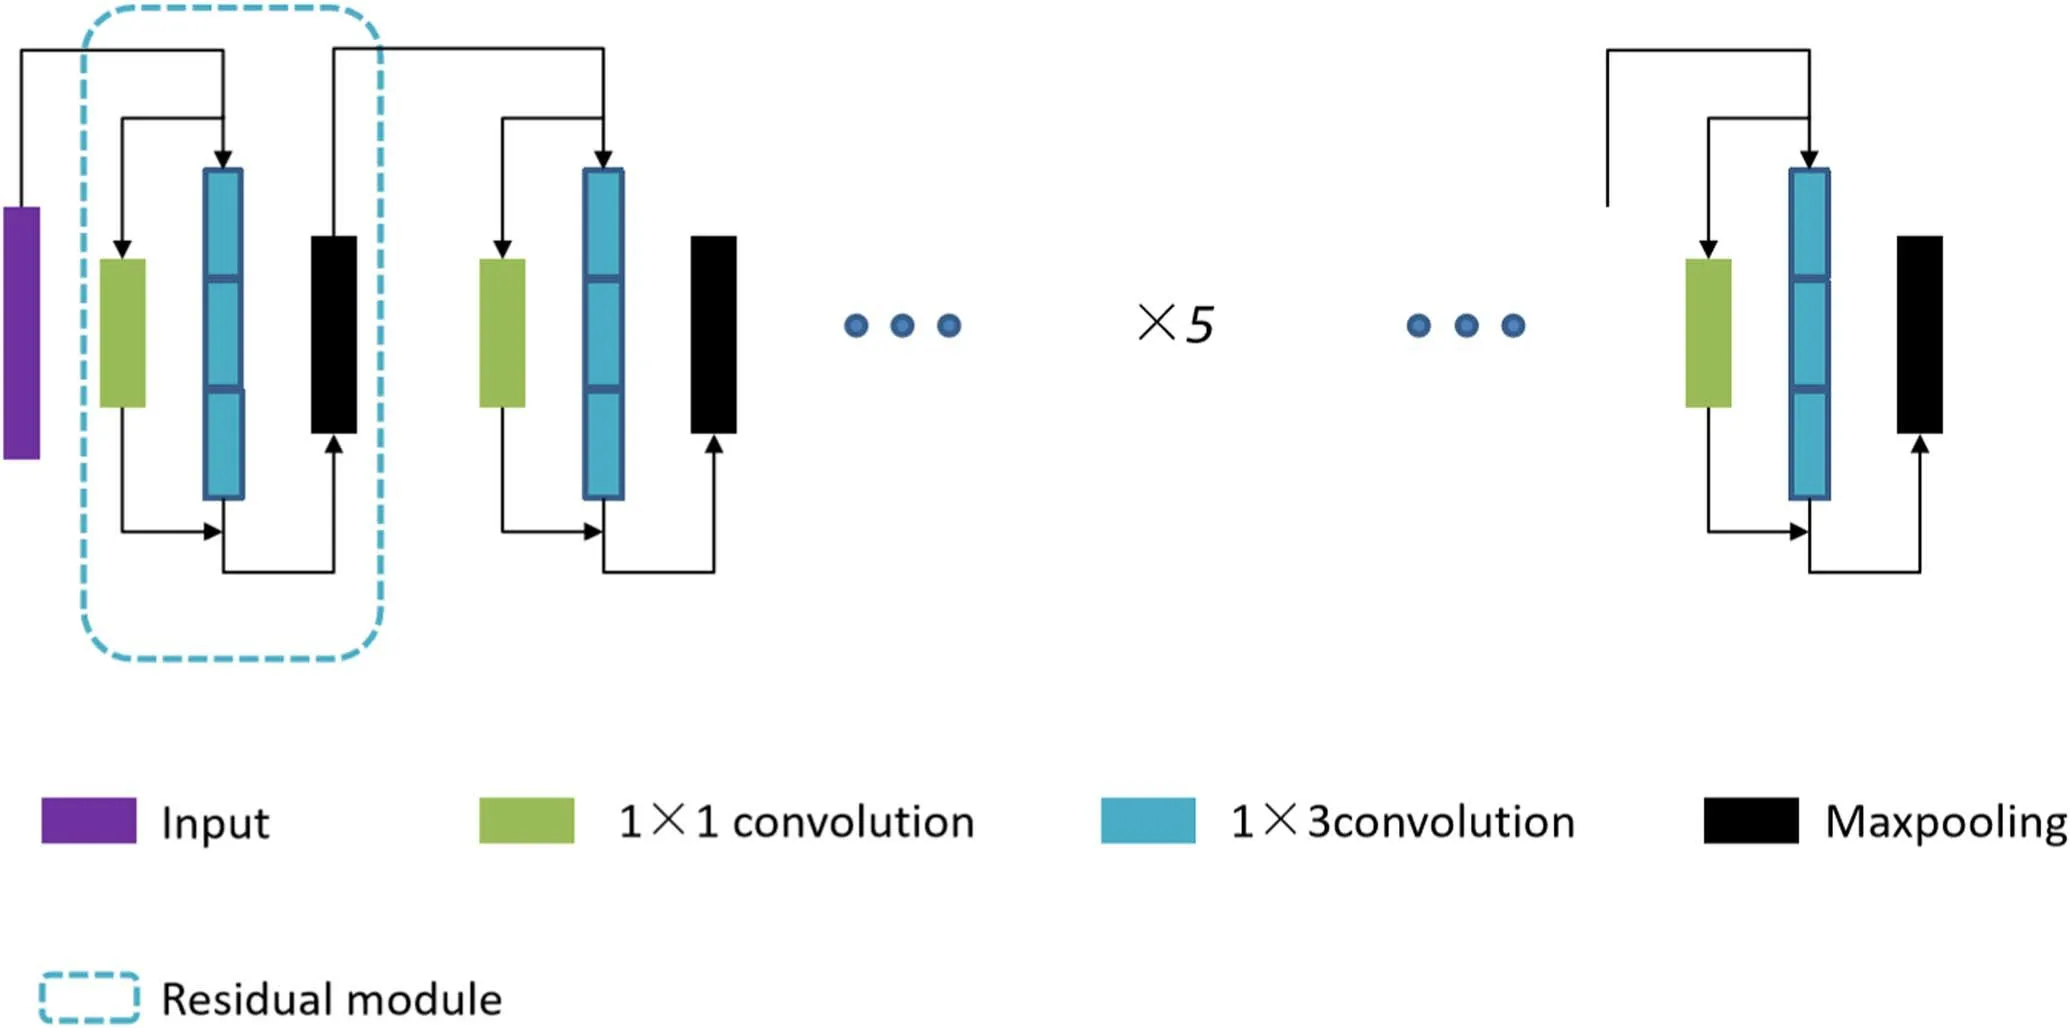
Figure 5.RC-Net (Zou et al.2020) backbone structure diagram.
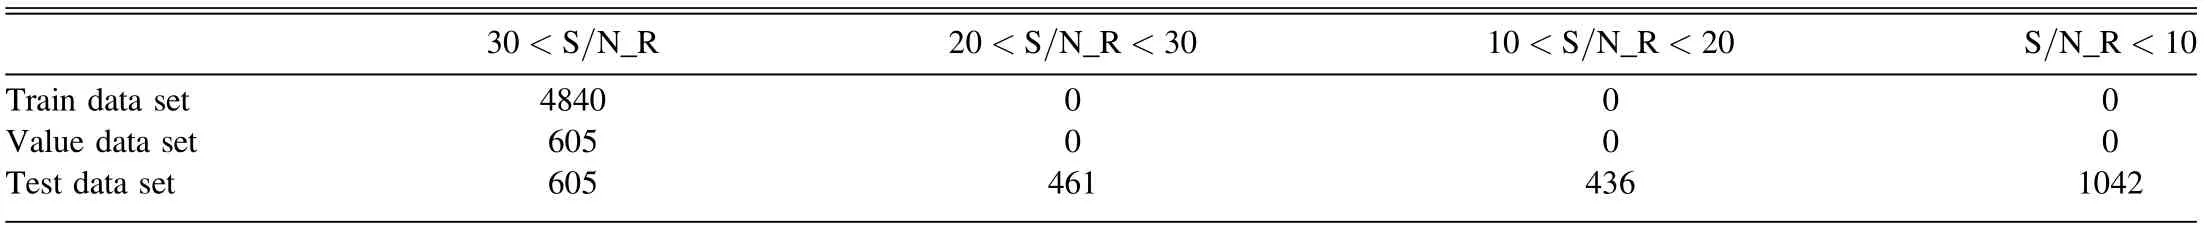
Table 1Division of the Data Set
3.2.DRC-Net
DRC-Net is proposed based on the backbone of RC-Net,and its network structure is shown in Figure 6.Since the 2D spectral data consists of images from the blue and red arms,using only one part of the image would result in information loss.Therefore, DRC-Net is designed as a dual-branch model.It consists of two identical feature extraction units that process the blue-and red-arm images of the 2D spectrum,respectively.The extracted features from both branches are then mapped into a high-dimensional space for feature fusion.In Figure 6,DRCNet is divided into four components: the data dimension reduction module, the feature extraction module, the feature fusion module, and the classifier.
The data dimension reduction module aims to decrease the dimensionality of the input 2D spectral data, reducing computational complexity and enhancing efficiency.The feature extraction module employs identical feature extraction units to extract representative features from the blue-arm and red-arm images independently.The feature fusion module combines these extracted features in a high-dimensional space and further extracts features to capture complementary information.Finally, the classifier utilizes the fused features as input to perform the classification task.
Overall, DRC-Net capitalizes on the strengths of the RCNet’s backbone network while incorporating a dual-branch architecture to effectively handle the information contained in the blue- and red-arm images of 2D spectra.This approach enables more comprehensive and accurate feature extraction,leading to improved classification performance.
The data dimension reduction module plays a crucial role in reducing the dimensionality of the 2D spectral image data to a 1D sequence that can be effectively processed by subsequent modules.This module is composed of three sequential 1D convolutional layers with kernel sizes of 5 × 1, 5 × 1, and 3 × 1.By passing the 11 × 3000 input 2D spectral image through these convolutional layers, the module transforms it into a 1D sequence output with a size of 1 × 3000.
The feature extraction module is responsible for extracting meaningful features from the input data.In the experimental setup, this module serves as the backbone network of RC-Net to ensure fair comparison with other models.The output from the data dimension reduction module is fed into the feature extraction module, which produces a 1D vector output with a size of 1 × 128.This vector represents the extracted features that capture important characteristics of the input data.
The feature fusion module is designed to integrate the features obtained from the preliminary feature extraction of the blue-arm and red- arm spectra and further extract informative features.The 2D vectors, representing the features from the blue-arm and red-arm, are concatenated together.This concatenated vector is then processed through two 1 × 3 convolutional layers, which perform additional feature extraction operations.The output of this module is the final feature representation that incorporates complementary information from both arms of the 2D spectra.
The classifier module consists of three fully connected layers followed by a softmax activation function layer.The feature representation output from the feature fusion module is first transformed by the fully connected layers to a size of 1 × 3,enabling the model to learn discriminative representations.
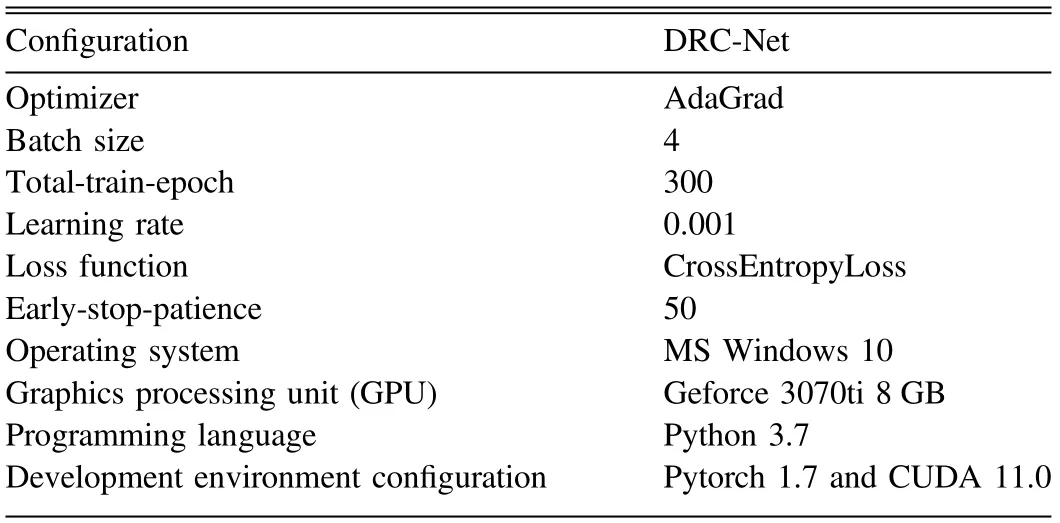
Table 2Hyperparameter Settings
Then, the softmax activation function is applied to obtain the final class outputs of the model, representing the predicted probabilities for the F, G, and K types of stars.By combining the functionalities of the data dimension reduction module,feature extraction module,feature fusion module,and classifier module, the DRC-Net model can effectively process 2D spectral data, extract informative features, and make accurate predictions for stellar classification.
4.Experiments and Analyses
Before training a neural network model,it is necessary to set hyperparameters,such as batch size,learning rate,and number of epochs.Table 2 presents the hyperparameter settings for DRC-Net and the hardware environment used in thisexperiment.To ensure a fair comparison, the same hyperparameter settings were applied to all experiments.In the experiment, an early stopping mechanism is introduced,which automatically stops the training process if the validation loss does not decrease for 50 consecutive epochs, to prevent overfitting.
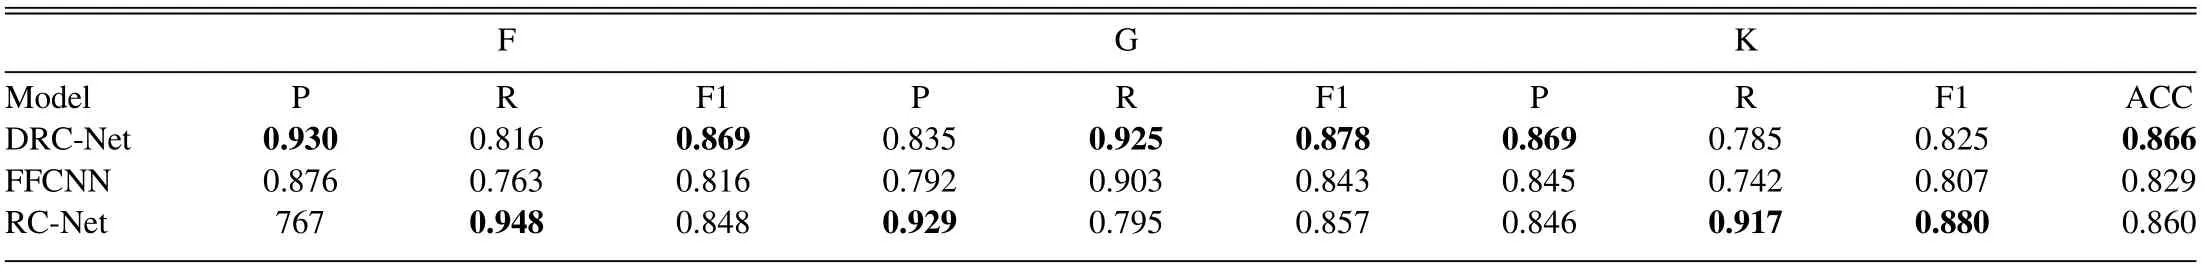
Table 3Comparison of Classification Results of Three Models
In order to evaluate the performance of the proposed model,precision, recall, F1-score, and accuracy are introduced as evaluation metrics.In the experiment,the model is first trained using high-S/N data,and then predictions are made on the data sets with four different S/N ranges.Table 3 presents the classification performance of all the models in the S/N_R>30 range.P, R, F1, and ACC represent the precision, recall, F1-score, and overall accuracy of the test set, respectively.
The comparison with FFCNN (Ya-kun et al.2022) highlights the advantage of DRC-Net’s data dimension reduction module.By reducing the dimensionality of the 2D spectra and obtaining 1D sequence data, DRC-Net allows for more effective feature extraction.On the other hand,FFCNN directly extracts features from the images using fixed-size convolutional kernels (3 × 20), which limits the network’s depth and may result in insufficient feature extraction and lower classification performance.The difference in network architectures between DRC-Net and RC-Net, specifically the input data, also contributes to the improved performance of DRC-Net.By using 1D sequence data obtained through dimensionality reduction from 2D spectra, DRC-Net captures more spatial information compared to RC-Net, which takes 1D spectra as input.This suggests that the simulated “spectral extraction”process with 1D convolution in DRC-Net provides valuable spatial information for classification.
The performance of both DRC-Net and RC-Net in different S/N ranges is illustrated in Figure 7.When S/N is greater than 30, the classification accuracy of the DRC-Net model exceeds the RC-Net model by 0.6%.As the S/N decreases,in the range of 20–30,RC-Net achieves a higher classification accuracy and surpasses DRC-Net by 6.6%.When the S/N further decreases to the range of 10–20, the classification accuracy of both models becomes comparable again, with the DRC-Net model leading by 0.4%.However,as the S/N continues to decrease to values below 10, a significant difference in classification accuracy between the two models emerges, with the DRC-Net model leading RC-Net by 6.5%.In summary, the DRC-Net achieves competitive results at lower S/N values and even better results at lower S/N levels.
When the S/N is sufficiently high, the DRC-Net model demonstrates higher classification accuracy.Comparing the differences between the DRC-Net and RC-Net, it can be concluded that the 1D sequence obtained by convolution of 2D spectra contains more spatial directional information than the 1D spectra obtained directly through aperture spectra.Additionally, when the S/N is not significantly low (20–30), 2D spectra do not outperform 1D spectra, indicating that 2D spectra do not exhibit superiority within this S/N range.Finally,when the S/N drops below 10,the performance of 2D spectra becomes noticeably better.It can be inferred that strong noise easily interferes with the waveform characteristics of 1D spectra, while the image features of 2D spectra exhibit better noise resistance.Therefore,the 2D spectral classification model demonstrates better robustness against noise.
To present the experimental results more accurately, the classification accuracy of the test set and the precision of each stellar for DRC-Net and RC-Net at different S/N values are separately presented in Tables 4 and 5.
The specific experimental results for the two sets of experiments are shown in Tables 4 and 5.The data in columns F,G,and K represent the precision of different stellar at various S/N values.The best results are highlighted in bold in the tables.Particularly at S/N levels below 10, the highest precision is achieved for the K-type stars, and this holds true for both 1D spectra and 2D spectra.This suggests that the features of K-type stars are more robust against noise interference and degradation, making them easier to classify accurately even under challenging conditions.
Overall, the analysis of the experimental results highlights the trade-off between the two models at different S/N levels.DRC-Net performs better at higher S/N values(S/N_R>30),while RC-Net excels in lower S/N ranges (20–30).The advantages of DRC-Net, such as better noise resistance and more spatial directional information, become more apparent as the S/N decreases.These findings provide valuable insights into the performance and robustness of the models under different S/N conditions and can help guide the selection of the appropriate model based on the specific requirements and S/N levels in practical applications.
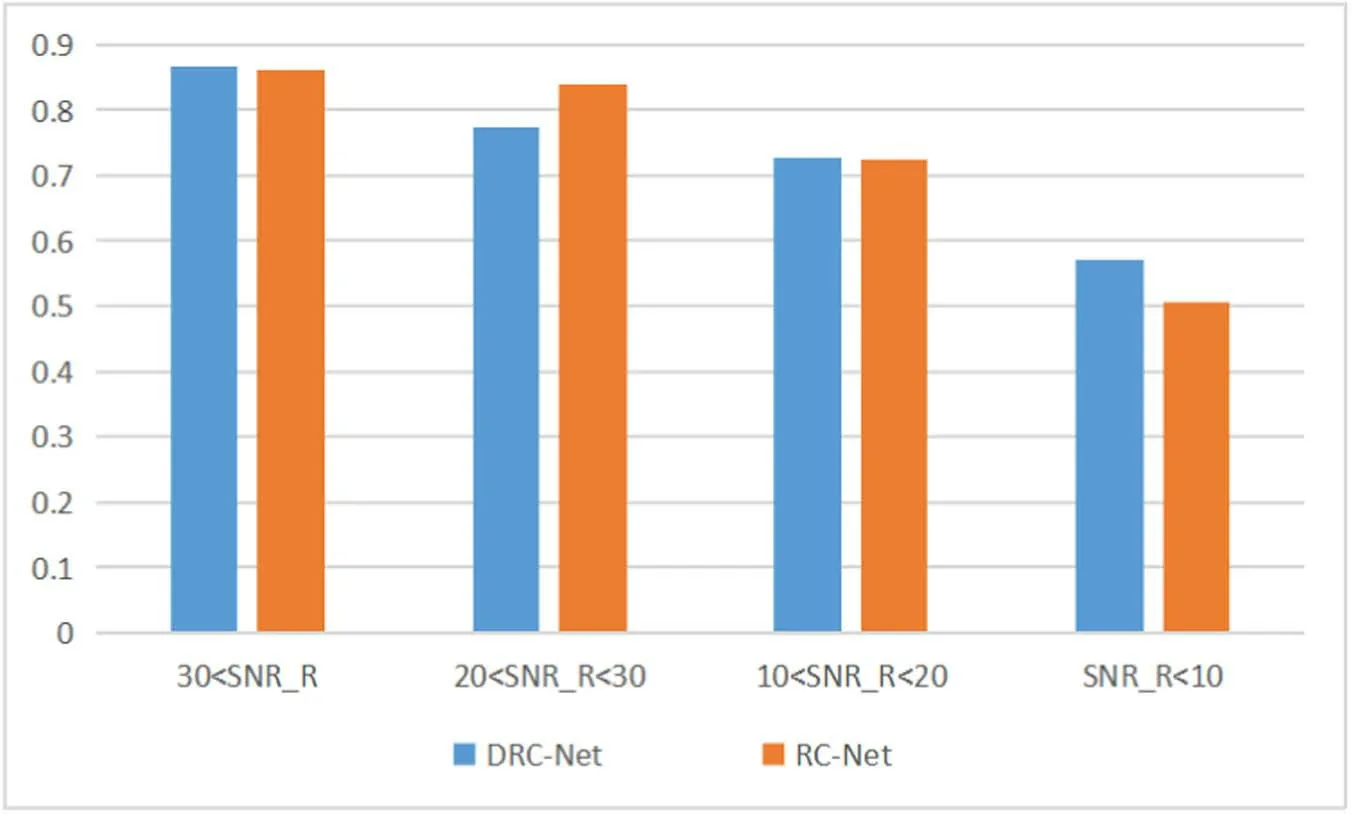
Figure 7.Comparison of classification accuracy of models with different S/N.
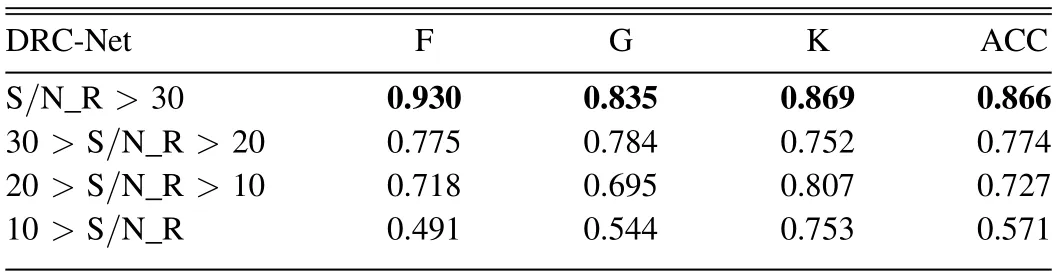
Table 4Table of DRC-Net Model Classification Results
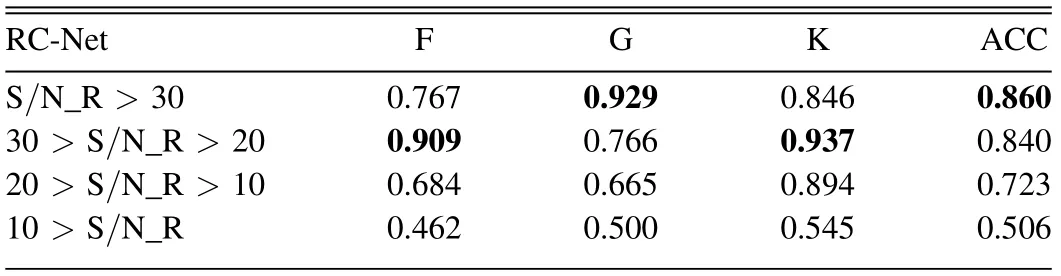
Table 5Table of RC-Net Model Classification Results
5.Conclusion
In this paper,a novel deep learning model named DRC-Net is designed for classifying stars of F,G,and K types,which is based on 2D spectral images.DRC-Net uses a dual-branch architecture that incorporates both the red-arm and blue-arm of the 2D spectra.By applying 1D convolution, the model simulates the“spectral extraction” process and reduces the dimension of a 2D spectrum into a 1D sequence for further analysis.
Experimental results demonstrate that DRC-Net outperforms RC-Net,the 1D spectral classification network.Compared to RCNet,the precisions of F-type and K-type are improved by 16.3%and 2.3%, respectively.Moreover, the overall classification accuracy of the test data set increases by 0.6%.Additionally,DRC-Net exhibits a significant performance over FFCNN,another 2D spectral classification network (Ya-kun et al.2022).
These results highlight the benefits of the sequential data derived from dimensionality reduction of 2D spectra.The 1D sequence captures more spatial directional features compared to the 1D spectra obtained through aperture extraction and suggests that the 2D spectra data provide richer spatial information,explaining the good performance of DRC-Net.The study also investigates the robustness of the model facing noises.When S/N is relatively low (20–30), DRC-Net achieves competitive results despite the lower data quality.Furthermore,when S/N is very low(S/N_R<20),the 2D spectra methods outperform 1D spectra methods, indicating the superior ability for noise resilience.This finding supports the feasibility of utilizing 2D spectra methods for processing low-S/N spectra.
Overall, this study introduces DRC-Net as an effective model for classifying stars using 2D spectra.The performance of the model surpasses that of 1D networks and demonstrates the advantages of leveraging spatial information in spectral data.Additionally,the robustness of the 2D methods further enhances its applicability in scenarios with complex data conditions.
Acknowledgments
This work was supported by the Natural Science Foundation of Tianjin Municipality (22JCYBJC00410), the National Natural Science Foundation of China-Chinese Academy of Sciences Joint Fund for Astronomy (U1931134).
杂志排行

Research in Astronomy and Astrophysics的其它文章
- Large-scale Dynamics of Line-driven Winds with the Re-radiation Effect
- A Study of Elemental Abundance Pattern of the r-II Star HD 222925
- Preliminary Study of Photometric Redshifts Based on the Wide Field Survey Telescope
- Solar Observation with the Fourier Transform Spectrometer.II.Preliminary Results of Solar Spectrum near the CO 4.66μm and MgI 12.32μm
- Density Functional Theory Calculations on the Interstellar Formation of Biomolecules
- Detection Capability Evaluation of Lunar Mineralogical Spectrometer:Results from Ground Experimental Data