Preliminary Study of Photometric Redshifts Based on the Wide Field Survey Telescope
2024-01-16YuLiuXiaoZhiLinYongQuanXueandHuynhAnhLe
Yu Liu, Xiao-Zhi Lin, Yong-Quan Xue, and Huynh Anh N.Le
1 CAS Key Laboratory for Research in Galaxies and Cosmology, Department of Astronomy, University of Science and Technology of China, Hefei 230026,China xzlin@ustc.edu.cn, xuey@ustc.edu.cn 2 School of Astronomy and Space Sciences, University of Science and Technology of China, Hefei 230026, China Received 2023 August 3; accepted 2023 August 24; published 2023 October 31
Abstract The Wide Field Survey Telescope (WFST) is a dedicated time-domain multi-band (u, g, r, i, and z) photometric survey facility under construction.In this paper, we present a preliminary study that assesses the quality of photometric redshifts based on WFST by utilizing mock observations derived with the galaxy catalog in the COSMOS/UltraVISTA field.We apply the template fitting technique to estimate photometric redshifts by using the ZEBRA photometric-redshift code and adopting a modified set of adaptive templates.We evaluate the bias(median relative offset between the output photometric redshifts and input redshifts),normalized median absolute deviation(σNMAD)and outlier fraction(foutlier)of photometric redshifts in two typical WFST observational cases,the single 30 s exposure observations (hereafter shallow mode) and co-added 50 minutes exposure observations(hereafter deep mode).We find bias ≾0.006, σNMAD ≾0.03, and foutlier ≾5% in the shallow mode and bias≈0.005, σNMAD ≈0.06, and foutlier ≈17%–27% in the deep mode, respectively, under various lunar phases.Combining the WFST mock observational data with that from the upcoming CSST and Euclid surveys, we demonstrate that the zphot results can be significantly improved, with foutlier ≈1% and σNMAD ≈0.02.
Key words: galaxies: distances and redshifts – galaxies: high-redshift – galaxies: photometry
1.Introduction
The development of modern astronomy has given rise to an increasing demand for powerful multi-band photometric sky surveys.Such surveys, e.g., the Sloan Digital Sky Survey(SDSS; e.g., Brescia et al.2014; Albareti et al.2017; Zhao et al.2021), Dark Energy Survey(DES;e.g.,Drinkwater et al.2010; DES-Collaboration et al.2016; Ivezić et al.2019), and Hyper Suprime-Cam Subaru Strategic Program Survey (HSCSSP; e.g., Aihara et al.2018; Hikage et al.2019), with welldesigned equipments, reasonable observational strategies, and fruitful scientific results in stellar physics, galaxy physics, and cosmology,have demonstrated their strong impacts on modern astronomy.
The Wide Field Survey Telescope (WFST) is a dedicated time-domain multi-band (u, g, r, i, and z) photometric survey facility under construction jointly by University of Science and Technology of China and Purple Mountain Observatory,which is expected to start commissioning observations around 2023 August.WFST has a 2.5 m primary mirror, an active optical system,and a 0.73 Gigapixel mosaic CCD camera on the main focus plane;moreover,WFST is located near the summit of the Saishiteng Mountain in the Lenghu area that is a world-class observational site (Deng et al.2021), thereby achieving highquality imaging over a field of view of 6.5 deg2.The main science goals of WFST surveys are time-domain sciences including supernovae, tidal disruption events, multi-messenger events, and active galactic nuclei (AGNs), asteroids and the solar system, the Milky Way and its satellite dwarf galaxies,and galaxy formation and cosmology (Wang et al.2023).
Robust determination of cosmological redshifts is one of the most crucial factors in fulfilling the above WFST science goals.However, high-precision galaxy redshift measurements require spectroscopic observations for each source (i.e., obtaining spectroscopic redshifts, zspec).This task is not only expensive but also time consuming.Alternatively,there is another way to measure redshifts using photometric surveys (i.e., obtaining photometric redshifts,zphot),which is much more efficient than spectroscopic observations.This method, although not as precise as the zspecmeasurement, has demonstrated its extensive use in the zphotdetermination of an overall huge amount of survey targets at one time (e.g., Benjamin et al.2010; Brescia et al.2014; Cavuoti et al.2017; Sánchez &Bernstein 2019).The application of zphothas enabled a wide range of exciting extragalactic sciences as mentioned above.
To date,a series of methods have been developed to estimate zphot.In general, they can be divided into two main categories.One is based on template fitting that works as follows: the observed photometry is compared to a given set of pre-assumed galaxy templates to determine the best-fit redshift corresponding to the maximum likelihood (e.g., Benítez 2000;Feldmann et al.2006; Brammer et al.2008; Luo et al.2010;Rafferty et al.2011; Yang et al.2014; Cao et al.2018).The other is the so-called training-set method, which constructs a neural network (e.g., Collister & Lahav 2004; Blake et al.2007; Sánchez et al.2014; Pasquet et al.2019) and performs machine learning to obtain zphot, focusing on finding empirical relations between the redshift and galaxy properties (e.g.,magnitudes and colors).This method is usually based on a large sample of secure zspec, which are mostly available in the lower-redshift universe.However,since the magnitude limits of all WFST bands are deeper than most of the current zspecsurveys, it is difficult to find a sample of well-measured zspecthat can be representative of the full survey sample.Therefore,in this paper, we choose to measure zphotof mock WFST observations based on the former technique, i.e., template fitting.
The main goal of this paper is to assess zphotquality of the WFST photometry system preliminarily.We utilize the COSMOS/UltraVISTA multiwavelength galaxy photometry catalog(Muzzin et al.2013)to produce mock WFST data.This survey has deeper magnitude limits than WFST observations,so it is suitable to select a subsample of galaxies from this survey, the magnitudes of which meet the WFST detection limits.Utilizing this subsample, we generate the mock flux of each WFST filter passband based on WFST instrumental parameters with good data quality, and then estimate the corresponding observational error.We choose to use the ZEBRA code (Feldmann et al.2006) for zphotestimation.The main advantage of this code is that it can generate a new set of templates adaptive to the observations to minimize the mismatch between observed spectral energy distributions(SEDs)and the galaxy templates that are either from theoretical synthesis models or observed certain types of galaxy SEDs in the local universe, thereby improving zphotquality.
This paper is organized as follows.In Section 2, we introduce the WFST photometry system, COSMOS/Ultra-VISTA galaxy catalog,and generation of mock WFST data;in Section 3, we introduce the process of zphotcomputation; in Section 4, we show zphotresults and make comparisons with other works; and in Section 5, we summarize our results.All the magnitudes quoted are AB magnitudes.
2.Data
2.1.Overview of the WFST Photometry System
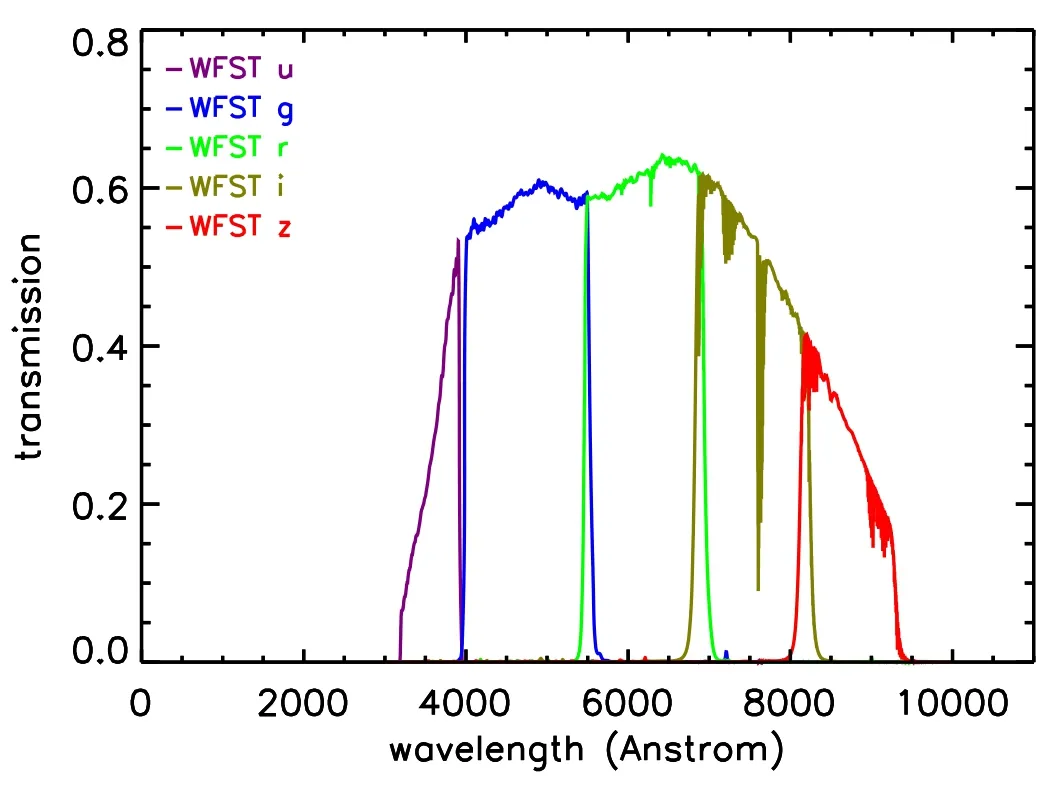
Figure 1.Total transmission curves of the WFST ugriz filters (indicated by different colors), with the instrument response and atmosphere absorption and scattering taken into account.
WFST has six filters, i.e., u, g, r, i, z (see Figure 1) and w,with the white-light w band specifically designed for detecting asteroids in the solar system and thus being excluded from zphotcomputation in this paper.There are two planned key programs of the 6 yr WFST survey:the wide-field survey(WFS)program and the deep high-cadence u-band survey(DHS)program.The WFS program aims to survey a total of ≈8000 deg2sky area in the u, g, r, and i bands in the northern hemisphere, with about 90 visits in each band over 6 yr given a single exposure of 30 s for each visit; while the DHS program plans to routinely monitor a total of ≈720 deg2sky area in the highly sensitive u band surrounding the equator every year, with a much higher observing cadence(down to hours)and being supplemented by a multi-band ancillary survey.The z-band imaging is excluded in the WFS program due to its relatively low efficiency and limited contribution to time-domain sciences; moreover, highquality z-band imaging data will be achieved by other northernhemisphere surveys such as Wide Imaging with Subaru HSC of the Euclid Sky(WISHES).However,WFST will allocate some additional observational time (about 1300 hr over 6 yr) for specific purposes or particular interests, e.g., capturing timecritical targets and mapping the Galactic plane, which require intensive scanning of certain sky areas using the z-band imaging.
In this paper, we compute zphotin two typical WFST observational cases, i.e., the single 30 s exposure observations(hereafter shallow mode) and co-added 50 minutes exposure observations (hereafter deep mode).The deep mode can be realized by integrating all the observational time in each band mainly with the WFS program,thus achieving deeper detection limits than any existing single-telescope surveys with comparable survey areas in the northern hemisphere (Lei et al.2023;Wang et al.2023).
The average night sky background brightness at the WFST site (i.e., the Saishiteng Mountain, Lenghu Town, Qinghai Province) is approximatelyV=22.0 mag arcsec-2when the moon is below the horizon; under new moon conditions, the best sky level can reach22.3 mag arcsec-2, which is measured in the extreme case when the bright part of the Galactic Disk isfar away from the local zenith(Deng et al.2021).In this paper,we set the sky background to a fixed value ofV22.3 mag.Under this circumstance and with no moon, the 5σ limiting magnitudes can reach depths of ugriz=[22.31, 23.42, 22.95, 22.43, 21.50] in the shallow mode and ugriz=[24.86, 25.95, 25.48, 24.96, 24.03] in the deep mode, respectively (Wang et al.2023).The modeling results of the 5σ limiting magnitudes and sky backgrounds in different lunar phases are listed in Table 1 (Lei et al.2023).

Table 15σ Limiting Magnitudes and Sky Backgrounds of WFST Observations (from Lei et al.2023)
2.2.The COSMOS/UltraVISTA Galaxy Catalog
In this paper, we adopt the multiwavelength galaxy photometry catalog in the COSMOS/UltraVISTA field(Muzzin et al.2013) to produce mock WFST data, given that it has deep optical coverage, broadband photometry, and high-quality zphotand corresponding best-fit galaxy SEDs.
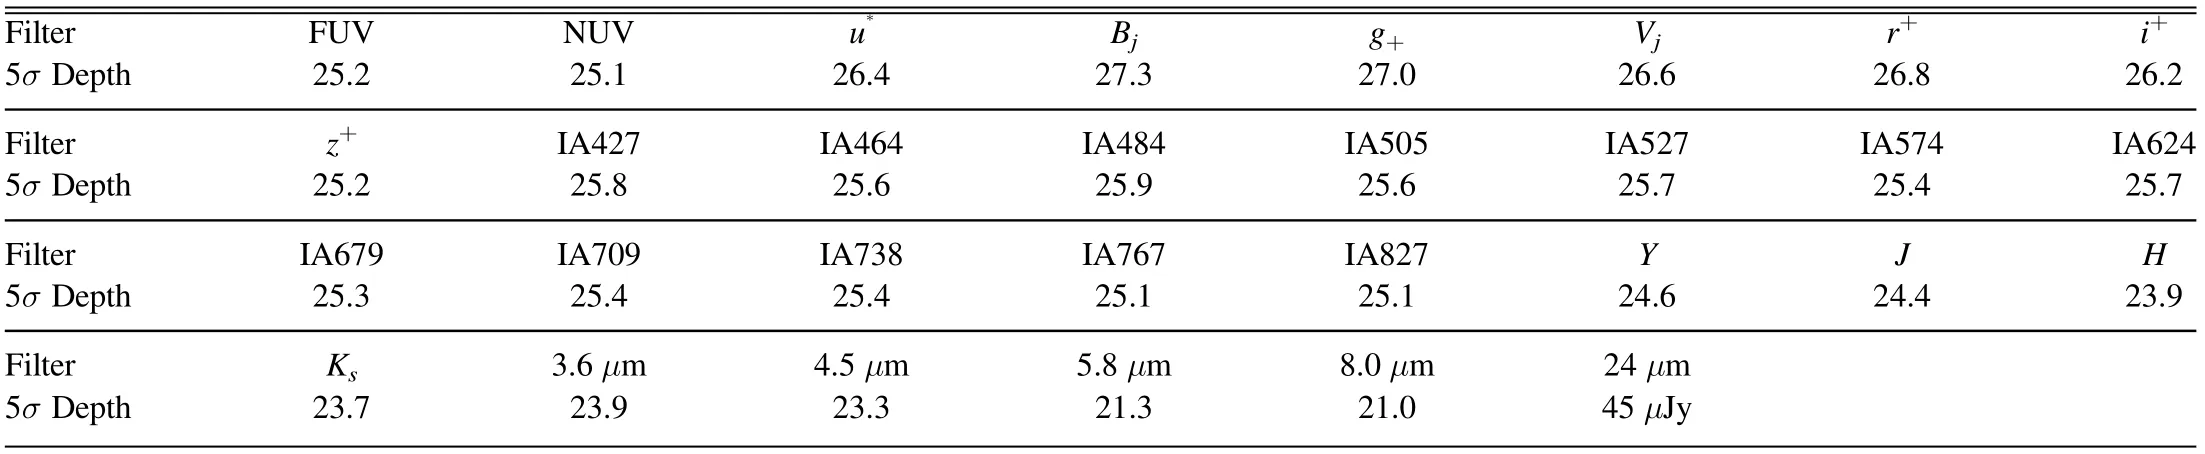
This catalog covers a sky area of 1.62 deg2with point-spread function (PSF) matched photometry in 30 bands, with the wavelength range extending from 0.15 to 24 μm,including two ultraviolet bands (FUV and NUV) from the GALEX satellite(Martin et al.2005),seven broadband(u*,g+,r+,i+,z+,Bj,Vj)and 12 medium-band (IA427–IA827) optical data from the Subaru and Canada–France–Hawaii Telescope (Capak et al.2007;Taniguchi et al.2007),four near-infrared imaging bands(Y, J, H, Ks) from the UltraVISTA survey (McCracken et al.2012), and the 3.6, 4.5, 5.8, 8.0, and 24 μm channels from Spitzerʼs IRAC and MIPS cameras (Sanders et al.2007).The 5σ depths of the COSMOS/UltraVISTA survey in all bands are tabulated in Table 2, with typical depths in optical bands being deeper than those of WFST (see Table 1).
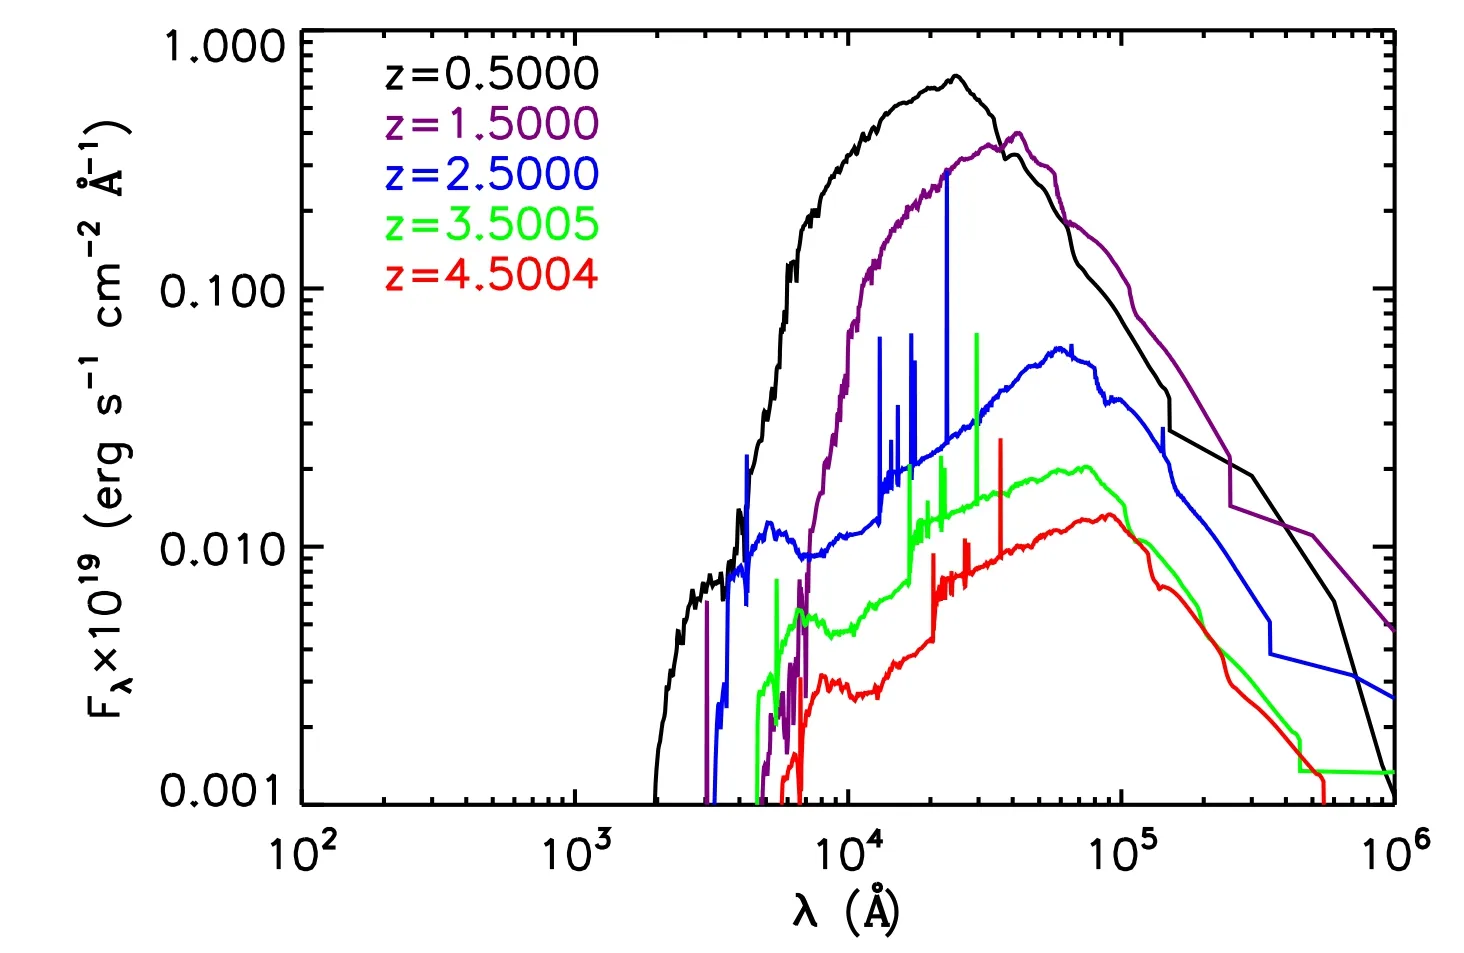
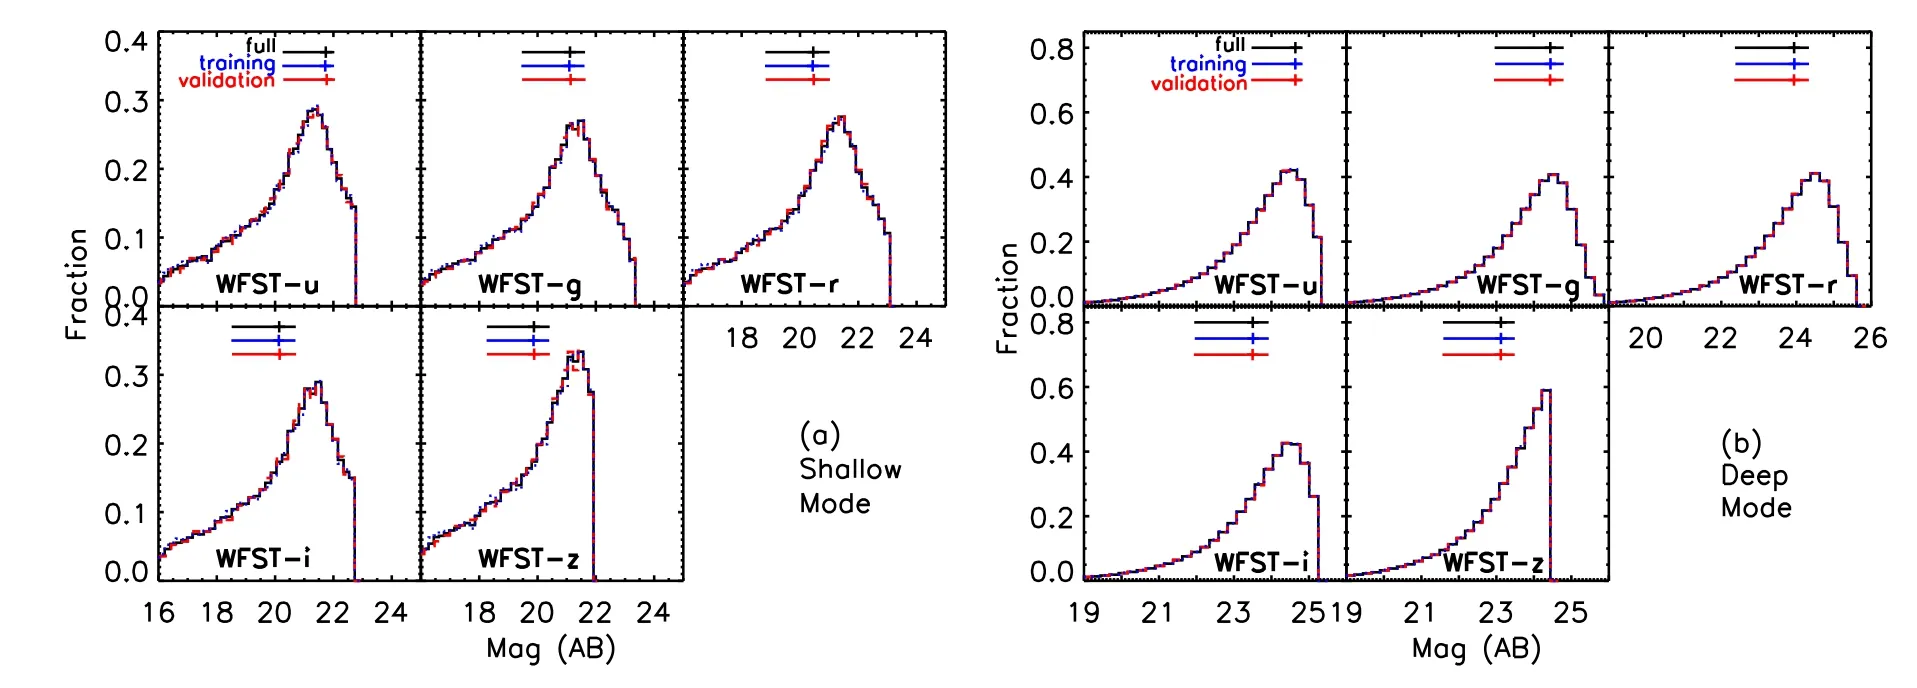
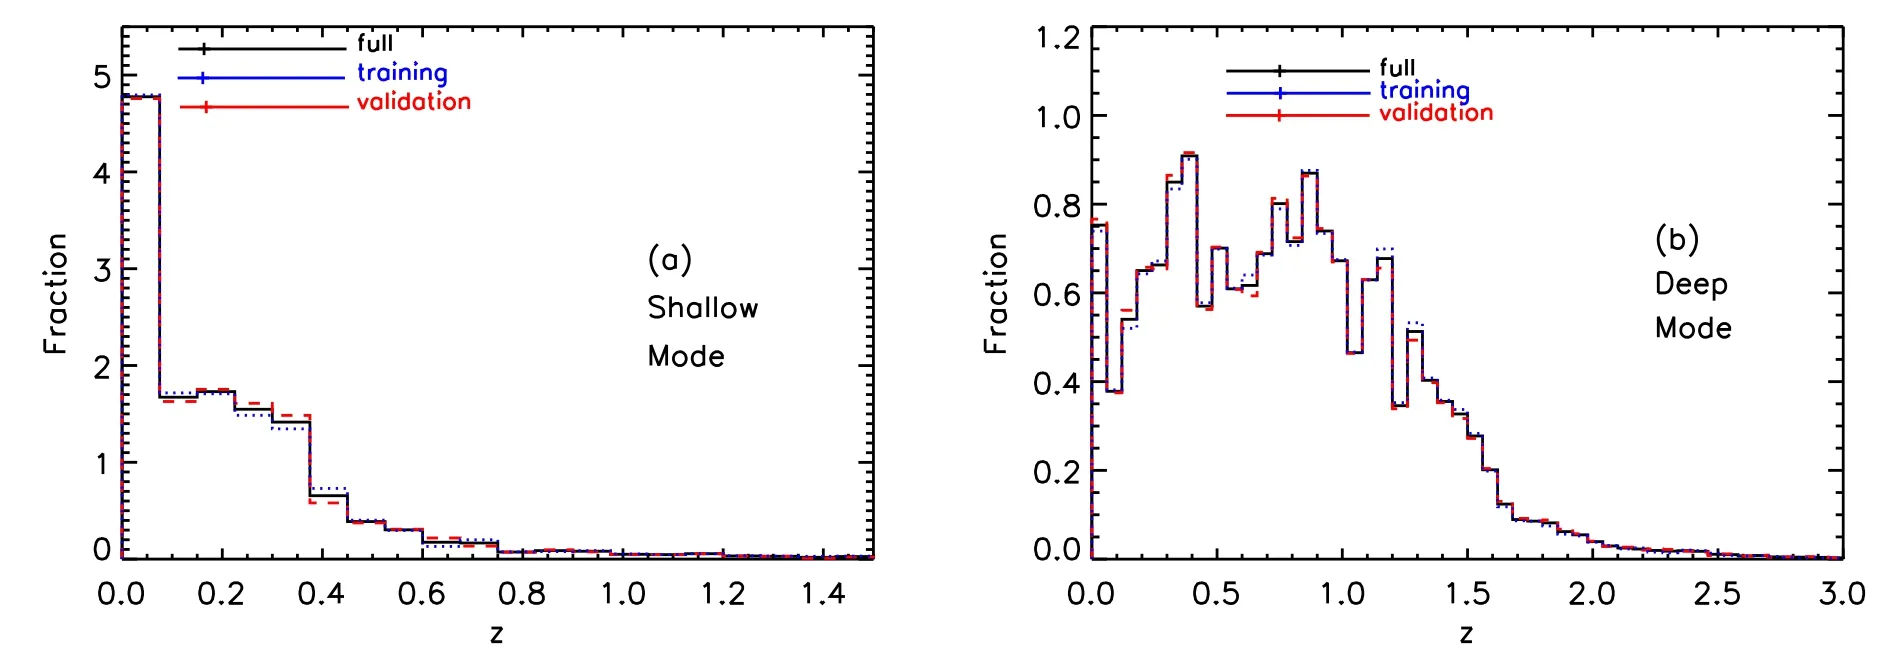
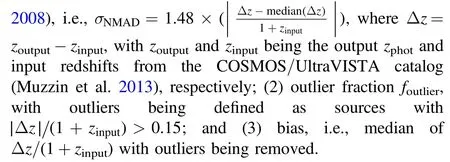
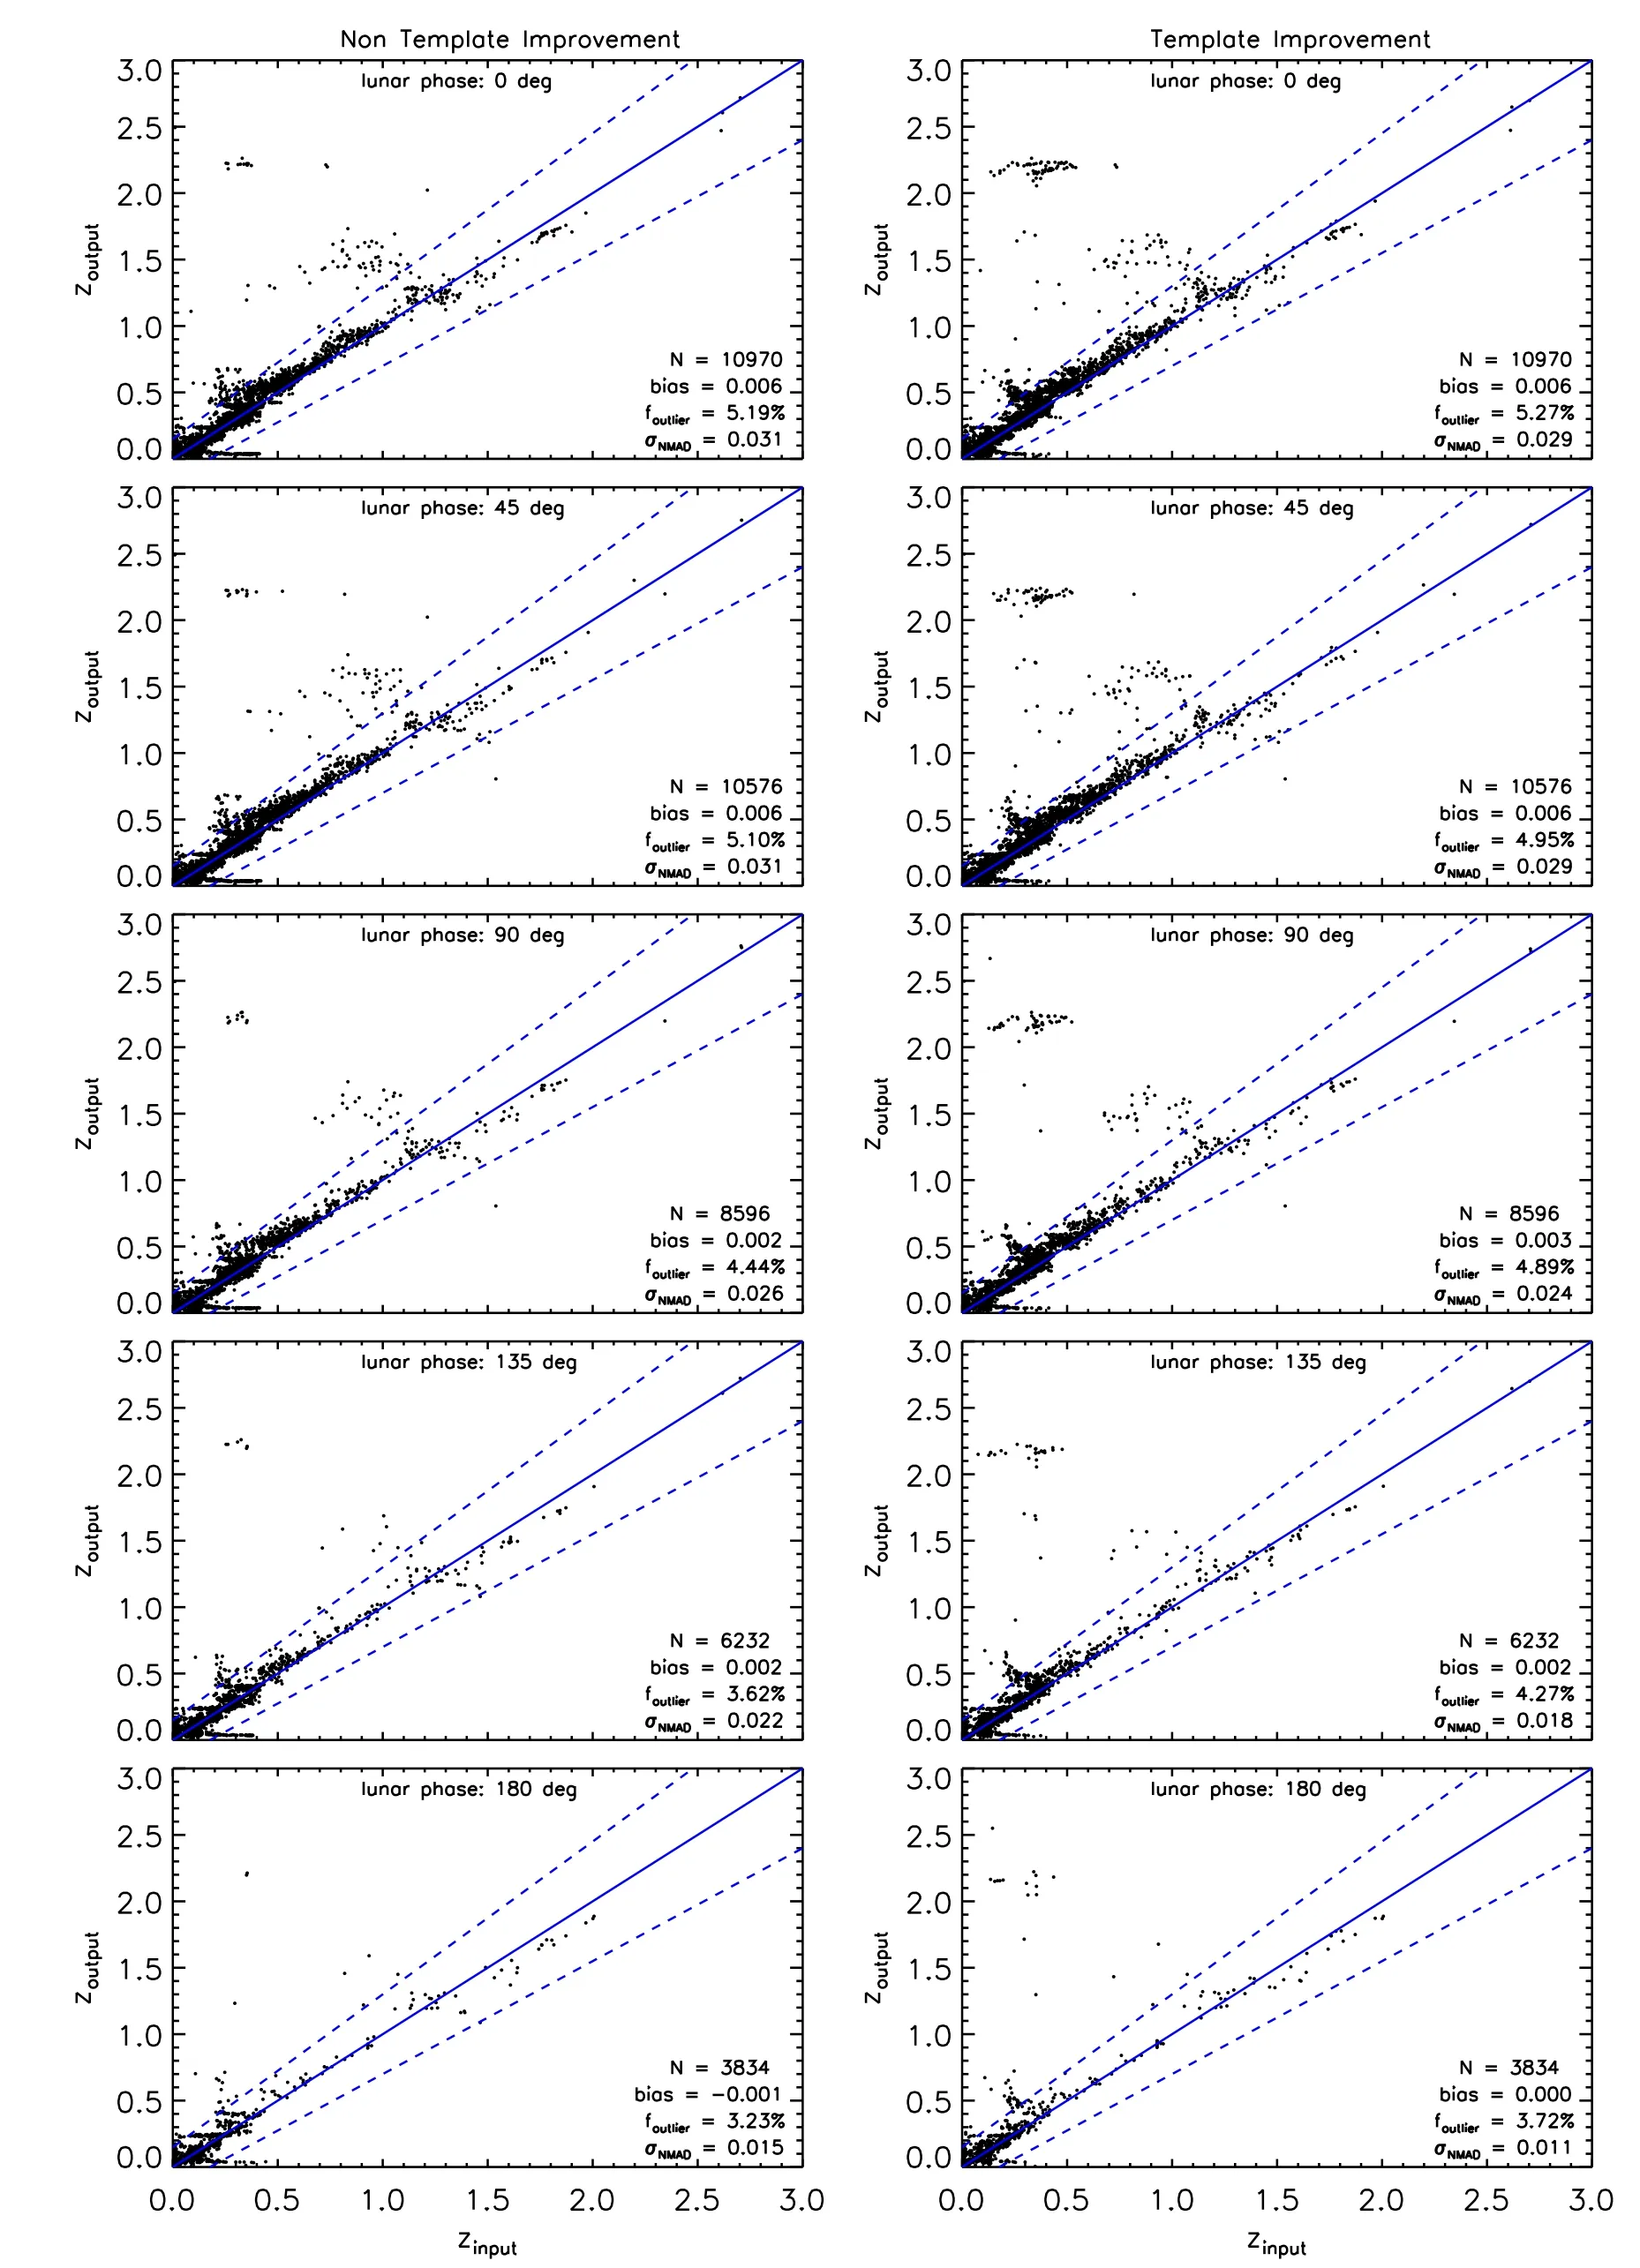
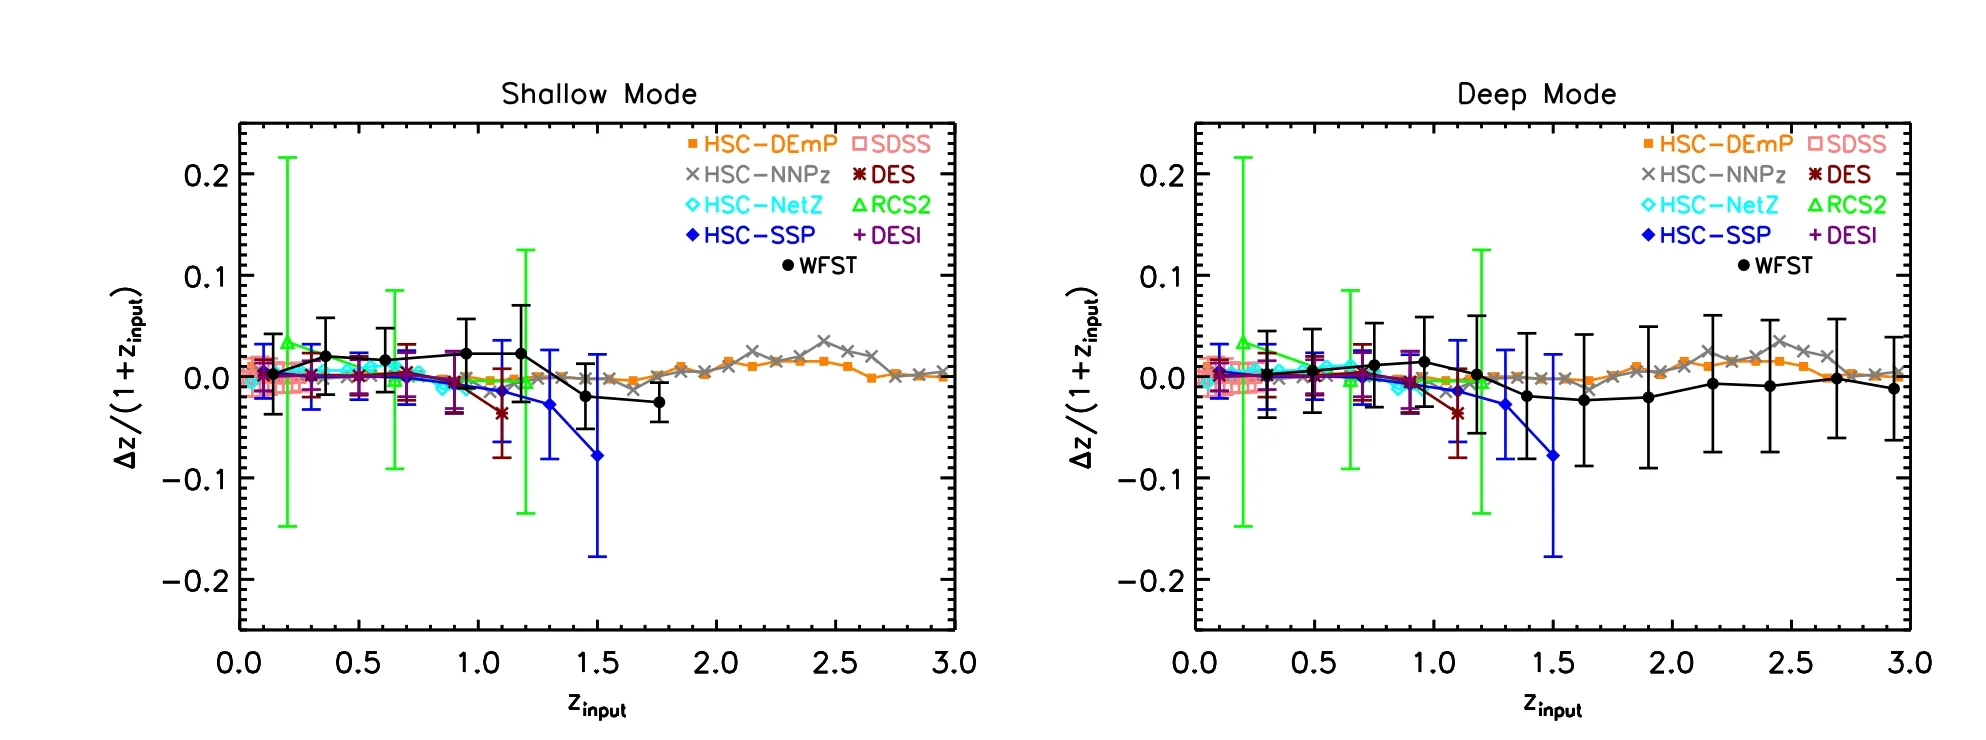
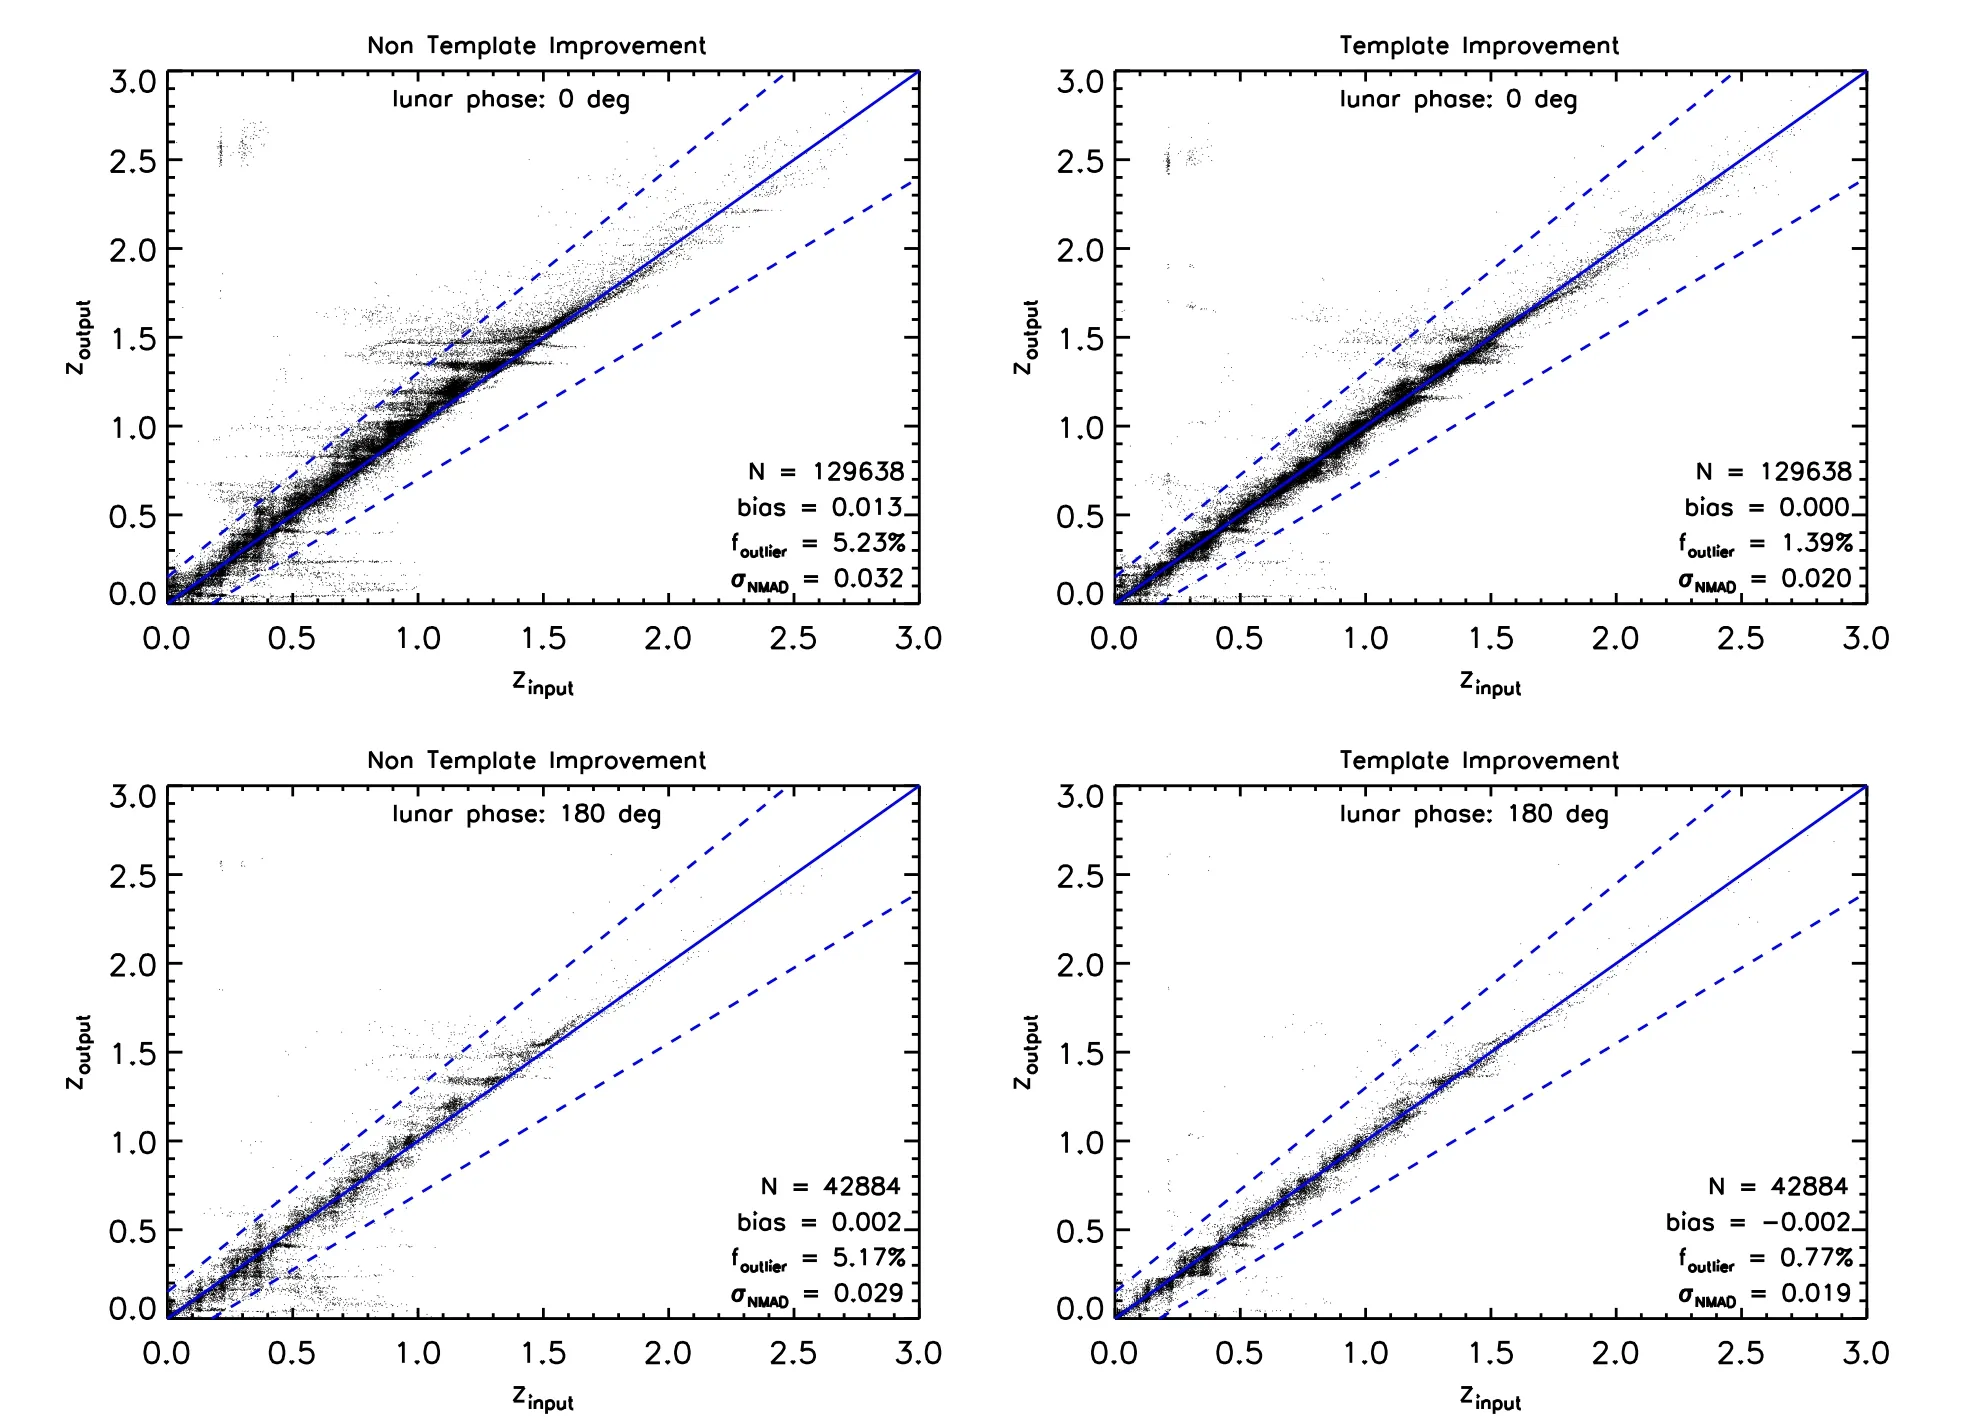
Photometric redshifts of galaxies in the COSMOS/Ultra-VISTA catalog are computed based on the template-fitting technique with the EAZY photometric-redshift code(Brammer et al.2008).The default seven EAZY templates are comprised of six templates derived from the PEGASE models (Fioc &Rocca-Volmerange 1999) and a red galaxy template from the models of Maraston (2005).To improve the quality of the fitting, Muzzin et al.(2013) added two additional galaxy templates: one is a one-gigayear-old single-burst galaxy template generated from the Bruzual & Charlot (2003) model to improve the template fitting for galaxies at z>1 with post starburst-like features;and the other is a slightly dust-reddened young galaxy template to improve the fitting of UV bright Lyman break galaxies (LBGs) with heavy dust extinction at 1.5 First,the mock flux in each band for each galaxy in the given catalog can be calculated by convolving the galaxy redshifted Figure 2.The set of nine initial galaxy templates adopted by both Muzzin et al.(2013) and this work for zphot derivation (the templates have been normalized appropriately for displaying purpose; see main texts for details). Table 2Depths of the 30 Bands in the COSMOS/UltraVISTA Photometry Catalog SED with the filter transmission curve, using Dust extinction is taken into account when generating mock flux data.The SED flux density after dust reddening from interstellar medium(Calzetti et al.1994;Galametz et al.2017)can be expressed as where E(B −V)=AV/RVis the color excess and k(λ) is the dust extinction curve.We adopt the Calzetti et al.(2000)extinction curve, with RVfor this attenuation law set as 4.05.For each galaxy, the value of attenuation AVis given by the COSMOS/UltraVISTA catalog, which is derived through the SED fitting technique.We directly use it to generate the mock extinction-corrected fluxes. We also consider intergalactic medium(IGM)absorption for high-redshift galaxies.At wavelengths shorter than the Lyα line, the emission can be absorbed by neutral hydrogen clouds in the IGM along our line of sight to the high-redshift galaxy.We account for this extinction by making use of the Madau(1995)IGM attenuation law.This is carried out by applying the average flux decrement 〈DA〉 between Lyα and Lyβ, and 〈DB〉between Lyβ and the Lyman limit, such that the IGM absorption corrected flux can be written as Figure 3.Some best-fit galaxy SED examples in the observed frame in the COSMOS/UltraVISTA field (Muzzin et al.2013). where Sinitialis the initial flux density in the rest frame,adopted as the interstellar dust extinction-corrected galaxy flux Sextinct(λrest)obtained from Equation(2).After these correction procedures, the galaxy SED flux density Sabsorption, with dust extinction and IGM absorption corrected, is substituted into Equation (1) to generate mock flux data for all five WFST bands. Next, we estimate flux errors with respect to mock WFST fluxes.For a ground-based telescope, the signal to noise ratio(S/N) can be evaluated via the following equation (Lei et al.2023), where S is the source signal with a constant spectral flux, τ is the exposure time,A is the effective area of the WFST primary mirror (∼4.12×104cm2),αpix= 0.111 arcsec2is the area of one pixel, D is the dark current of the CCD(D=0.005 e−pixel−1s−1,at −100°C),R2is the readout noise of the CCD(R=8 e−rms),and npixis the total pixel number in the PSF region.The factor of 2 applied here is because we assume that the calculation is performed on sky subtracted images.We adopt an optimal PSF aperture of 1.18 times the full width at half maximum for a non-adaptive optics case according to the Integration Time Calculator of Gemini.Sky in Equation(4)is the sky background signal that actually lands on the detector in units of e−s−1pixel−1, which is given by where fλis the surface brightness of the sky background,Toptis the throughput of the optics (including the primary mirror,analog to digital converters and the five corrector lenses), and QECCDis the quantum efficiency of the CCD. The photometric error can be evaluated through the magnitude error given by the approximate relationσph⋍2.5 log (1 + 1 S N)(Pozzetti et al.1998; Bolzonella et al.2000).We also add a systematic error σsys=0.02 mag(Cao et al.2018),and the total magnitude error is then given byσm=Thus we can obtain the flux error σFof each band from σmvia error propagation.Finally, a random error drawn from the Gaussian probability distribution function(with σ=σF) is added to the mock flux in each band as the final mock photometry. After computing and correcting for these mock fluxes, the mock observational targets obtained in the WFST shallow mode and deep mode are generated.In this paper,we adopt 3σ detections to include sources into various samples as in Muzzin et al.(2013), i.e., galaxies with fluxes that meet the 3σ depth thresholds of the five WFST bands(see Table 1)are selected as the mock observational samples for subsequent zphotcalculation(see Section 4). Figure 4.Magnitude distributions of the full,training,and validation mock galaxy samples(indicated by different colors)in the(a)shallow mode and(b)deep mode,respectively, with the lunar phase being fixed to 90° (i.e., half moon).The color plus symbols show the medians of the distributions and the horizontal error bars indicate the 1σ ranges. In this paper, we compute zphotof galaxies using the mock WFST data and the ZEBRA photometric-redshift code(Feldmann et al.2006) with default parameters unless stated otherwise.The main advantage of ZEBRA is that it can generate a new set of templates adaptive to observed galaxy SEDs to minimize the mismatch between observed SEDs and available templates.This is performed by creating a training set of galaxies to optimize the shape of spectral templates that can better match predicted galaxy colors with observed ones.We adopt the same set of nine initial galaxy templates (see Figure 2) as in Muzzin et al.(2013) for zphotcalculation using ZEBRA.Since we have removed all the point sources that are likely bright stars or AGNs in the COSMOS/UltraVISTA catalog, we do not include any AGN templates during our template fitting. First, we run ZEBRA in the photometry-check mode to identify and correct systematic errors in the photometry based on the maximum-likelihood algorithm.ZEBRA derives a simple photometric offset in each band that minimizes the residuals between the mock observed fluxes and that of the best-fit templates, with the redshifts set as the input ones (i.e.,zspecor high-quality zphot,if zspecare not available,from Muzzin et al.2013).These corrections are then applied to the mock WFST photometry data,and ZEBRA iterates this procedure for 5 times to ensure that the median offset in each band converges. Second, we run ZEBRA in the non-template-improvement mode based on this photometric systematic offset-corrected mock catalog, using the nine initial galaxy templates shown in Figure 2.ZEBRA iteratively performs five logarithmic interpolations in the magnitude space between any adjacent pair of the nine templates, to generate 5×8=40 templates added to the nine initial templates, resulting in a total of 49 templates. Third, we run ZEBRA in the template-improvement mode,where ZEBRA transforms the discrete template space into a linearly continuous space, using a Karhunen–Loéve expansion to iteratively correct the eigenbases of a lower dimensional subspace through a χ2minimization scheme.As a result,adaptive spectral templates are generated to better match the galaxy SEDs of the training set than the set of 49 templates. For each galaxy sample considered, we randomly divide all its galaxies into two equal halves: one half serves as the training set to generate a new set of adaptive templates, and zphotcomputation is performed on the other half as the validation set based on these new adaptive templates plus the above 49 templates as a blind test of zphotquality.We compare multiwavelength photometry and input redshifts of both the training and validation sets in Figures 4 and 5,respectively.We find that they have almost identical photometric and redshift properties, such that the templates generated based on the randomly selected training set of galaxies can be adaptive to the full galaxy sample,and that zphotcomputation on the validation set as a blind test can be representative of the result for the full sample. In the template-improvement mode, ZEBRA iterates twice,i.e., over the redshift of 0–3 as one single bin and in smaller redshift bins of 0.5,to train the 49 templates based on a chosen training set.Narrowing down the redshift bin (e.g., to△z=0.2)only increases the total number of adaptive templates generated, but has little effect on the final zphotresults.Therefore, we use a total of 49×6+49=343 final templates and run ZEBRA to compute zphotfor each selected galaxy sample. Figure 5.Distributions of input redshifts from Muzzin et al.(2013)of the full,training,and validation mock galaxy samples(indicated by different colors)in the(a)shallow mode and(b)deep mode,respectively,with the lunar phase being fixed to 90°(i.e.,half moon).The color plus symbols show the medians of the distributions and the horizontal error bars indicate the 1σ ranges. In this section, we show zphotresults with mock WFST data in the shallow and deep modes given various lunar phases(see Sections 4.1 and 4.2, respectively), compare our WFST zphotresults with that from some recent works(see Section 4.3),and assess the improvement of zphotquality with the addition of other data (see Section 4.4). The zphotresults with mock WFST data in the shallow mode are shown in Figure 6, whose left and right panels are for the non-template-improvement and template-improvement modes under various lunar phases, respectively.To evaluate zphotquality, we adopt some commonly used quantities: (1)normalized median absolute deviation (e.g., Brammer et al. According to Figure 6, under various lunar phases, we have bias=−0.001–0.006, σNMAD=0.015–0.031, and foutlier=3.23%–5.19% in the non-template-improvement mode, and have bias = 0.000–0.006, σNMAD=0.011–0.029, and foutlier=3.72%–5.27% in the template-improvement mode,respectively.The template-improvement mode delivers smaller biases and σNMADthan the non-template-improvement mode,which is expected; however, the former mode provides comparable or even slightly larger foutlierthan the latter mode,due to misidentification of Lyman break as Balmer break or vice versa that is caused by the relatively limited photometry(i.e., only ugriz bands) although the significantly enlarged template set can cover the full parameter space of the observed galaxy SEDs. As shown in Figure 7, zphotquality shows some variation with lunar phases: zphotquality improves as the lunar phase increases, with the best zphotresult achieved under the lunar phase of 180 deg (full moon).Two factors can influence zphotquality of the selected sample under different lunar phases.One is the lunar phase itself: under brighter lunar phases, the sky light background contributed by the moon becomes larger,resulting in larger uncertainties on photometry and eventually worse zphotquality.The other is the sample selection effect:under brighter lunar phases, only brighter sources can be well observed, which usually have higher-S/N photometry that leads to higher-quality zphot. To make a more sensible evaluation of the lunar phase influence and consider the above two factors separately, we restrict the sample observable under full moon and measure zphotunder different lunar phases,with the results shown as the red dashed lines in Figure 7.It is clear that the lunar phase has a very limited influence on zphotresults of a fixed sample.Therefore, the variation in zphotquality under different lunar phases in the shallow mode is primarily driven by the sampleselection effect. The zphotresults with mock WFST data in the deep mode under various lunar phases, with ZEBRA run in the templateimprovement mode, are shown in Figure 8.Apparently, the inclusion of large amounts of faint galaxies significantly reduces zphotquality: σNMADgrows from 0.041 to 0.064 with the dimming of lunar phases; foutlierincreases to 26.6% when there is no moon; bias ∼0.005, being almost constant and comparable to the situations of faint lunar phases in the shallow mode. Figure 6.zphot results in the shallow mode with ZEBRA run in the non-template-improvement mode (left panels) and template-improvement mode (right panels)under various lunar phases (0 deg: no moon; 45 deg: 1/4 moon; 90 deg: half moon; 135 deg: 3/4 moon; and 180 deg: full moon), respectively.In each panel, blue dashed lines depict the boundary of zphot outliers, and the number of sources considered, bias, foutlier, and σNMAD are annotated. Figure 7.Dependences of σNMAD,foutlier,and bias on lunar phases as well as distribution of △z/(1+zinput)in the shallow mode,with the full mock sample and the specific sample of galaxies observable under full moon indicated by the black and red dashed lines and histogram, respectively.In the bottom-right panel, the lunar phase is fixed to 90 deg;the plus sign and its horizontal error bar show the median and 1σ range of △z/(1+zinput). In the deep mode, zphotquality shows a stronger variation with lunar phases than in the shallow mode, as shown in Figure 9.However, this does not mean that dimming of moonlight will cause zphotquality to decrease for a fixed galaxy sample.When we consider the fixed sample of galaxies observable under full moon,we find that dimming of sky background caused by moonlight slightly reduces photometric uncertainties and thus improves zphotquality,e.g., foutlierdecreasing from 17.1% (full moon) to ≤14% (no moon) (see the red dashed lines in Figure 9).Thus, the downgrade of zphotquality under fainter lunar phases in the deep mode is a direct result of the sample-selection effect,same as in the shallow mode.The dimmer moonlight in the deep mode enables the detection of fainter populations of galaxies, which often exhibit poorer photometry qualities;consequently, this leads to a continuous decrease in the accuracy and reliability of zphotestimation.Therefore, we conclude that lunar phase only has negligible or very slight effects on zphotquality for a given sample of galaxies;however, it can have a strong influence on sample selection,resulting in “apparent” variation of zphotquality across different samples. We compare our WFST zphotresults with some relevant works;for simplicity,we fix the lunar phase in the WFST mock data to 90 deg (half moon) here.Figure 10 shows△z/(1+zinput) as a function of r-band magnitude in the shallow mode and deep mode (see the black contours),respectively.Overall, the bright sources in the shallow mode have much better zphotthan the faint sources in the deep mode,with the scatter of △z/(1+zinput) of the latter being ∼2–3 times larger than that of the former.The red curves in Figure 10 show the average cumulative rms deviation between zphotand zspecas a function of r-band magnitude in the SDSS survey early data release (using the ugriz-band photometry; Csabai et al.2003), where zphotwere derived with a hybrid technique(empirical and template fitting methods) to calibrate galaxy SED templates to improve zphotquality, utilizing a training set of galaxies with secure zspec.We find that, at mr<22, our△z/(1+zinput) scatter is generally comparable to or smaller than that of Csabai et al.(2003).This is partly because their training set of galaxies are restricted to the bright population,which makes it difficult to constrain zphotscatter toward the faint end.Recently, Yang & Shen (2023) estimated zphotof galaxies and quasars in the Southern Hemisphere DES wide survey based on a Bayesian analysis algorithm in the multicolor space, using the grizY-band photometry.We show the standard deviation of △z/(1+zinput) of their galaxies in the blue bars in Figure 10,which is comparable to our result in the shallow mode. Figure 8.Similar to Figure 6, but for zphot results in the deep mode with ZEBRA run in the template-improvement mode under various lunar phases. Figure 9.Same as Figure 7, but for dependences of σNMAD, foutlier, and bias on lunar phases as well as distribution of △z/(1+zinput) in the deep mode. Figure 11 shows △z/(1+zinput)as a function of zinputin the shallow mode and deep mode,respectively,in comparison with several other works.In general, our △z/(1+zinput) shows a smooth distribution in each smaller redshift bin;the biases and scatters of our zphotare smaller than many quoted results from other works up to z ∼3.This may be because the training sets we use to improve the galaxy SED templates are randomly selected, thereby having good coverage of various galaxy properties and being representative of the full galaxy sample(see Figures 4 and 5).However, in real observations, zspecof the training sets would be mostly limited to bright sources and low redshifts,being difficult to well cover the full properties of the selected galaxy sample; in addition, the observed galaxy SEDs can be very different from the galaxy templates adopted here; therefore, a nonnegligible effect on actual biases and scatters of our zphotin real observations would be expected. Figure 12 shows σNMADand foutlieras a function of zinputin the shallow mode and deep mode, respectively, in comparison with the aforementioned works.Again, our zphotresults are overall in line with those in the literature.At z<1.5, our zphotquality is comparable to those of most other works, but not better than those works based on machine deep learning, e.g.,using random forest algorithms or convolutional neural networks.At z ≥1.5, both our zphotresults and the quoted results deteriorate; our foutlieris larger than the results based on the 5-band HSC photometry that includes the near-infrared Y band conducive to zphotimprovement at high redshifts.In contrast, our σNMADremains largely constant and acceptably small both in the shallow mode and deep mode,and within the full redshift range of 0–3 explored here. It is clear that at low redshifts (z<1.5), to a certain degree,the machine deep learning procedures can effectively further improve zphotresults compared to the traditional templatefitting techniques, which is usually done by applying a large training sample with secure zspecand high-quality observed SEDs.At higher redshifts (z ≥1.5), however, such a training sample would become very incomplete, which makes it difficult to cover the full parameter space of all observed sources; thus, it is still unlikely to precisely constrain uncertainties of zphotmeasurement at high redshifts simply based on machine learning.At z ≥1.5,the traditional templatefitting technique still shows advantages in some respects, e.g.,as shown in Figure 12,our σNMADoutperform that of machinelearning results, because ZEBRA can extend the known templates in the multi-parameter space and improve the fitting result by creating new templates and optimizing their shapes to be adaptive to galaxy multiwavelength photometry.However,the ZEBRA template-improvement procedure does not seem to effectively reduce foutlierat z ≥1.5, mainly due to misidentification of spectral breaks or other spectral features in galaxy SEDs thanks to the limited ugriz-band photometry.In contrast,the most recent machine learning methods based on the Direct Empirical Photometric (DEmP) or Nearest Neighbor (NNPz)method seem to have the potential to reduce foutlierto a large extent.Therefore, in the future, we can combine the machine learning methods with adaptive template fitting procedures to further improve WFST zphotquality. Figure 10.△z/(1+zinput)as a function of r-band magnitude in the shallow mode(left)and deep mode(right),respectively.The black envelopes show the 2σ and 3σ contours surrounding the peak distributions.For comparison,the red curves show the derived average cumulative rms deviation of SDSS galaxies based on ugriz-band photometry as a function of r-band magnitude (Csabai et al.2003); the blue horizontal bars indicate the single-value (i.e., derived with the entire sample) standard deviation of DES galaxies based on grizY-band photometry (Yang & Shen 2023). Figure 11.△z/(1+zinput)as a function of zinput in the shallow mode(left)and deep mode(right),respectively.Also shown for comparison are those from the HSC survey (using convolutional neural network for zphot computation, NetZ; cyan; Schuldt et al.2021), second Red-Sequence Cluster Survey (using Direct Empirical Photometric method,DEmP;green;Hsieh&Yee 2014),HSC-SSP survey(using K Nearest Neighbor,KNN;blue;Zou et al.2022),DES survey(using KNN;brown;Zou et al.2022), DESI survey (using KNN; purple; Zou et al.2022), HSC survey (using DEmP; orange; Tanaka et al.2018; no error bars provided), HSC survey(using Nearest Neighbor, NNPz; gray; Tanaka et al.2018; no error bars provided), and SDSS survey (using random forest regression; pink; Carliles et al.2010). We further investigate the improvement of WFST zphotquality by including mock data from the China Space Station Telescope (CSST, to be launched around 2024; Zhan 2011)and Euclid space telescope (launched in 2023 July; Laureijs et al.2012), both of which can provide additional high-quality ultraviolet and/or near-infrared data in large sky areas that are critically supplementary to WFST data. We consider the CSST NUV-and y-band mock data,whose photometric errors are measured via S/N (Ubeda 2011): where t is the exposure time and Npixis the number of detector pixels covered by a source.Npixis 16 by default,corresponding to the case of a point source in the image;changing Npixvalue does not significantly alter the final result.Nreadis the number of detector readouts,Bdetis the detector dark current,and Rnis the read noise.Default parameter settings of t=300 s,Nread=2,Bdet= 0.02 e-s-1pixel-1, and Rn=5 e−pixel−1are adopted.Csis the count rate from the source in units of e−s−1.Bskyin Equation (6) is the sky background in e−s−1pixel−1.For more details about the CSST mock flux and error estimation, we refer readers to Section 2.3 in Cao et al.(2018). Figure 12.σNMAD and foutlier as a function of zinput in the shallow mode(left) and deep mode(right),respectively.The comparison surveys are the same as those in Figure 11. We consider the Euclid YE-, JE- and HE-band mock data.Since we do not have specific details of Euclid(such as those of CSST shown in Equation(6)),we adopt photometric errors in the similar Y, J, and H bands of the VISTA survey for approximation, i.e., photometric errors of mock Euclid data are directly taken from the Muzzin et al.(2013) catalog,which are scaled proportionally to mock YE-,JE-and HE-band fluxes.Given that there is a slight bias between the groundbased VISTA telescope and Euclid, we apply a constant conversion factor to convert the VISTA errors to the Euclid mock errors, which is defined as the ratio of flux error between the CSST y band and VISTA Y band for each source at the given magnitude.We then compute mock fluxes and flux errors in the CSST NUV, y and Euclid YE, JEand HEbands, which are subsequently combined with WFST mock data for zphotimprovement. Figure 13 shows the zphotresults in the deep mode with the addition of 5-band mock data from CSST and Euclid.It is clear that the zphotquality is significantly improved (see Figure 8),because the 10-band mock photometry that well covers the wavelength from ultraviolet to near infrared is vital for both ZEBRA photometry-check mode and template-improvement mode.In the non-template-improvement mode, foutlierand σNMADare effectively reduced to ∼5% and ∼0.03, respectively; the lunar phase has little influence on zphotresults,mainly due to the fact that mock CSST and Euclid data are almost unaffected by the lunar phase.In the templateimprovement mode, foutlierand σNMADare further reduced to∼1% and ∼0.02, respectively; meanwhile, the bias is also better calibrated, being ∼0.0. Figure 13.Similar to Figure 6,but for zphot results in the deep mode with the addition of mock data from the CSST-NUV,CSST-y,Euclid-YE,Euclid-JE,and Euclid-HE bands. Fulfillment of many scientific goals is heavily dependent on zphotaccuracy, e.g., zphotfor future photometric weak lensing surveys need to at least achieve σNMAD<0.05, with many relevant studies setting σNMAD⋍0.02 as a goal (e.g.,Zhan 2006; LSST-Collaboration et al.2009), which is crucial to depict the redshift dependent growth of dark matter fluctuations, analyze weak lensing cosmic shears, and investigate the redshift dependent weak lensing signal behind clusters of galaxies under the constraints of the framework of the dark energy state equation (Brimioulle et al.2008).As shown above, such requirements on zphotaccuracy can be met when the mock WFST, CSST and Euclid are combined. In this paper, we conduct a preliminary study that assesses zphotquality based on the mock WFST ugriz-band photometry in the shallow mode and deep mode.We adopt the multiwavelength photometric catalog in the COSMOS/UltraVISTA field to generate mock WFST data, as it has deeper limiting magnitudes than WFST observations; during this process,mock fluxes are computed through the convolution of galaxy SEDs with the five WFST filter transmission curves, with interstellar dust extinction and IGM absorption taken into account, and mock flux errors are evaluated through the consideration of instrumental parameters,sky background,and systematic errors. We calculate zphotusing the ZEBRA code, which can generate new adaptive templates that better describe observed galaxy SEDs.We find bias ≾0.006, σNMAD≾0.03, and foutlier≾5% in the shallow mode and bias ≈0.005,σNMAD≈0.06, and foutlier≈17%–27% in the deep mode,respectively, under various lunar phases; a lunar phase has limited influence on zphotresults, and the decrease of zphotquality with dimming of the lunar phase is primarily caused by sample-selection effect, i.e., the involvement of increasingly more fainter sources that have larger photometric uncertainties. We compare our WFST zphotresults with that of some relevant works, finding general agreement between various results.Given that the adaptive template fitting and machine learning methods have their respective merits, it would be sensible to use all these methods jointly to further improve WFST zphotquality in the future. Finally, we compute zphotby combining the mock WFST data with ultraviolet and near-infrared data from CSST and Euclid.As expected, we find significant improvements in zphotquality with foutlier≈1% and σNMAD≈0.02, thanks to the full wavelength coverage from ultraviolet to near-infrared.Such high-quality zphotcan help fulfill many scientific goals that highly rely on zphotaccuracy. Acknowledgments We thank the referee for a constructive report.We thank Wen-Tao Luo, Lu-Lu Fan, and Ning Jiang for valuable discussions and comments.This work is supported by the National Key R&D Program of China(2022YFF0503401),the National Natural Science Foundation of China (12203047,12025303, 11890693, and 12003031), the science research grants from the China Manned Space Project with NO.CMSCSST-2021-A06, the Fundamental Research Funds for the Central Universities (WK3440000006 and WK2030000057),the K.C.Wong Education Foundation, and the Cyrus Chun Ying Tang Foundations. ORCID iDs2.3.Generation of Mock WFST Data


3.Computation of Photometric Redshifts
4.Results and Discussion
4.1.zphot Results in the Shallow Mode
4.2.zphot Results in the Deep Mode

4.3.Comparison with Other zphot Results


4.4.Improvement of zphot Quality with the Addition of Other Data

5.Summary
杂志排行

Research in Astronomy and Astrophysics的其它文章
- Large-scale Dynamics of Line-driven Winds with the Re-radiation Effect
- A Study of Elemental Abundance Pattern of the r-II Star HD 222925
- Solar Observation with the Fourier Transform Spectrometer.II.Preliminary Results of Solar Spectrum near the CO 4.66μm and MgI 12.32μm
- Density Functional Theory Calculations on the Interstellar Formation of Biomolecules
- Detection Capability Evaluation of Lunar Mineralogical Spectrometer:Results from Ground Experimental Data
- A Comparison of Co-temporal Vector Magnetograms Obtained with HMI/SDO and SP/Hinode