Impact of random and scattered coincidences from outside of field of view on positron emission tomography/computed tomography imaging with different reconstruction protocols
2024-01-10MahakOsouliAlamdariPardisGhafarianArmanRahmimMehrdadBakhshayeshKaramMohammadRezaAy
Mahak Osouli Alamdari · Pardis Ghafarian · Arman Rahmim · Mehrdad Bakhshayesh-Karam ·Mohammad Reza Ay
Abstract Image quality in positron emission tomography (PET) is affected by random and scattered coincidences and reconstruction protocols.In this study, we investigated the effects of scattered and random coincidences from outside the field of view(FOV) on PET image quality for different reconstruction protocols.Imaging was performed on the Discovery 690 PET/CT scanner, using experimental configurations including the NEMA phantom (a body phantom, with six spheres of different sizes) with a signal background ratio of 4:1.The NEMA phantom (phantom I) was scanned separately in a one-bed position.To simulate the effect of random and scatter coincidences from outside the FOV, six cylindrical phantoms with various diameters were added to the NEMA phantom (phantom II).The 18 emission datasets with mean intervals of 15 min were acquired (3 min/scan).The emission data were reconstructed using different techniques.The image quality parameters were evaluated by both phantoms.Variations in the signal-to-noise ratio (SNR) in a 28-mm (10-mm) sphere of phantom II were 37.9% (86.5%) for ordered-subset expectation maximization (OSEM-only), 36.8% (81.5%) for point spread function(PSF), 32.7% (80.7%) for time of flight (TOF), and 31.5% (77.8%) for OSEM + PSF + TOF, respectively, indicating that OSEM + PSF + TOF reconstruction had the lowest noise levels and lowest coefficient of variation (COV) values.Random and scatter coincidences from outside the FOV induced lower SNR, lower contrast, and higher COV values, indicating image deterioration and significantly impacting smaller sphere sizes.Amongst reconstruction protocols, OSEM + PSF + TOF and OSEM + PSF showed higher contrast values for sphere sizes of 22, 28, and 37 mm and higher contrast recovery coefficient values for smaller sphere sizes of 10 and 13 mm.
Keywords Positron emission tomography/computed tomography (PET/CT) · Random coincidences · Scatter coincidences ·Time of flight (TOF) · Point spread function (PSF) · Field of view (FOV) · Noise equivalent count rate (NECR) · Signal-to-Noise ratio (SNR)
1 Introduction
18F-fluoro-2-deoxyglucose (FDG) positron emission tomography (PET) is the cornerstone of oncological imaging.FDG PET image quality can depict a wide range of count rates and signal-to-noise ratios (SNRs) [1].Appropriate image qualities for low-contrast detectability in PET imaging are satisfied by a combination of factors related to the sensitivity of PET/CT scanners, injected activity, time per bed position,uptake time, and patient size, combined with specific reconstruction protocols [2–9].Similar to scanner sensitivity, time of flight (TOF) accuracy is important to enhance image quality.TOF capabilities contribute to an improved performance in detecting focal hot lesions in noisy backgrounds [10, 11].The degrading factors in PET include random coincidences that can negatively affect image quality.Currently, reliable systematic corrections for random coincidences are routinely performed using relatively straightforward methods [12–15];however, SNRs are affected by random coincidences.
Variations in PET image quality are also associated with reconstruction algorithms.Reconstruction algorithms have the potential to increase image accuracy by correctly modeling the statistics of the collection of photon coincidences, more precise correction of physical effects (scatter and randoms), and the recent possibility of integrating TOF information and point spread function (PSF) modeling in the reconstruction scheme [16].
The adverse effects of random and scatter coincidences can be partially offset by corrections when reconstructing the emission data [17].Noise-equivalent count rate (NECR)curves are often used in PET imaging to describe the count rate dependence of the SNR [18, 19].Results from past studies have shown that, in addition to measuring the count rate,NECR determines noise.Noise and NECR are two parameters that mirror the image quality [20, 21].In addition,Chang et al.[22] observed that, in certain cases, the image SNR cannot be predicted by NECR when using orderedsubset expectation maximization (3D-OSEM) reconstructions, particularly for clinical applications that require high activity concentrations.
In a study, researchers assessed the effect of outside FOV activity on image quality parameters [23].They demonstrated that the presence of activity outside the FOV matching the activity inside the FOV decreased the maximum NECR by 30%.The increase in the scatter fraction was marginal (1.2%).However, the contrast-to-noise ratios (CNRs)decreased substantially with increasing non-FOV activity within the range explored.
In another study, researchers evaluated the effects of activity from outside the FOV on imaging performance in a 1 mm3resolution clinical PET system.They concluded that this activity increased the dead time and resulted in increased random coincidence rates.In the presence of outside FOV activity, the 1.2 mm diameter rods were resolvable, the CNR degraded by approximately 4.37%, the system timing resolution degraded by approximately 9.7%, and the randoms fraction increased by 75% [24].
Berker et al.quantified the influence of random coincidences from outside the FOV on data acquisition in a singlebed position.In realistic simulations, random coincidences outside the FOV introduce a bias of approximately 15%.This study concluded that further investigation was required to confirm the validity of the bias correction [25].
The lesion detectability of PET has been considered in different reconstruction techniques and novel reconstruction protocols [26].In TOF-PET/computed tomography(CT) imaging, Bayesian penalized likelihood reconstruction algorithms increase the quantitation and detectability of sub-centimeter spheres as compared with OSEM-based reconstructions to detect an 8-mm size sphere [27].Image reconstruction methods have a major impact on volumetric PET parameter quantitation [27].The image quality and quantitative accuracy are highly influenced by the reconstruction parameters when TOF and PSF algorithms are applied [28].In a study by Hashimoto et al., a TOF model with 2 mm voxel reconstruction increased the detectability of sub-centimeter hot spheres using a clinical PET/CT scanner [28].The combination of PSF with OSEM and OSEM + TOF reconstruction algorithms enhanced the SNR, contrast, hot contrast recovery coefficient (CRC),and noise [29].In general, the use of PSF models and the TOF algorithm produced the highest CRC and CNR [30]and enhanced SNR and lesion contrast in clinical PET/CT images [31].
In the present study, we aimed to assess the effects of random and scatter coincidences from outside the FOV on PET image quality by measuring the SNR, noise, contrast,CRC, coefficient of variation (COV), and NECR in a NEMA phantom.TOF and non-TOF protocols were used to reconstruct the emission data.
2 Methods
2.1 Scanner
A Discovery 690 PET/CT scanner (GE Healthcare, WI,USA) with 24 rings of detectors and an axial FOV (AFOV)of 157 mm was employed.The evaluation of the scanner system performance was the subject of a detailed report [32,33].The system used a 425–650 keV energy window and a 4.9 ns coincidence time window.In this study, a single rate correction method was applied for random correction.
All PET data were acquired in list mode and reconstructed using four types of reconstruction algorithms:baseline OSEM only, OSEM + PSF, OSEM + TOF, and OSEM + TOF + PSF; two iterations (TOF protocols) and three iterations (non-TOF protocols) with 18 subsets were used.In these algorithms, the reconstruction parameters such as the reconstruction grid and data projection size were 256 × 256 and 192 × 192, respectively.
2.2 Phantom study
Two scans with various phantom configurations wereperformed in this study.An in-house NEMA image qulity phantom (Fig.1a) scanned separately (phantom I) irrespective of random invents outside the FOV, and then a collection of various phantom sizes (Fig.1b) was added (in front and back) to the NEMA IQ phantom (phantom II), as shown in Fig.2a and b, to model random coincidences originating from outside the FOV.All phantoms were made of polycarbonate as an in-house NEMA IQ phantom.
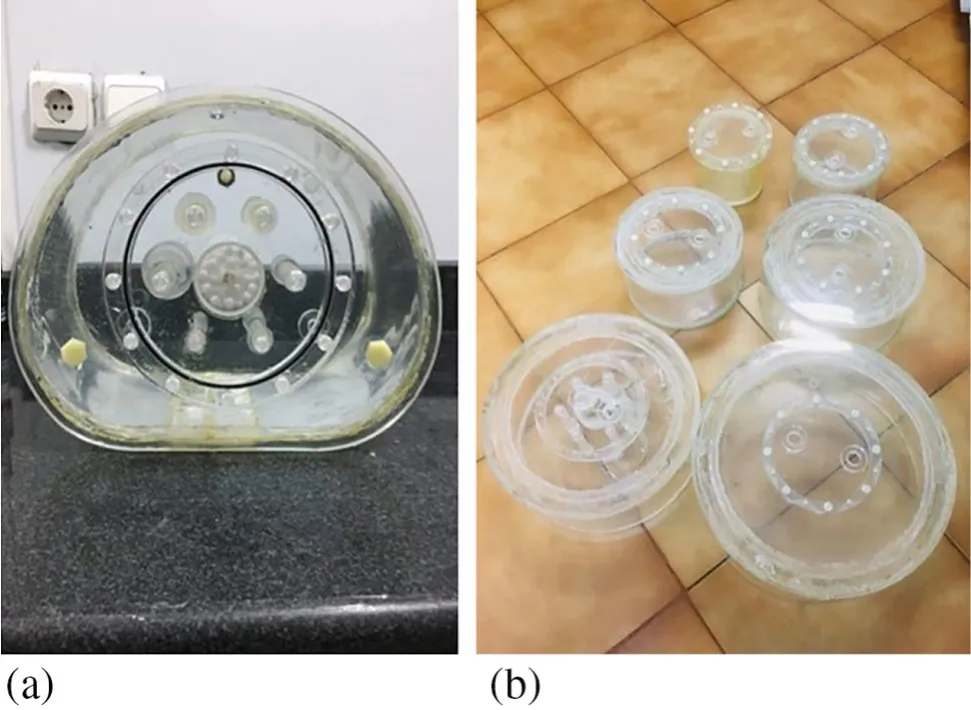
Fig.1 (Color online) a In-house NEMA IQ phantom (phantom I) and b in-house phantoms of various sizes
First, we studied a NEMA phantom with a volume of 9.04 L and six fillable cylindrical inserts with internal diameters of 10, 13, 17, 22, 28, and 37 mm.The NEMA IQ phantom was filled with a solution of18F-FDG with a sphere-to-background activity concentration ratio of 4:1.Then, to simulate the effects of random and scatter coincidences originating from outside the FOV, six cylindrical phantoms of various diameters were added to the NEMA IQ phantom setup (Fig.2).Each of the six cylindrical phantoms with diameters of 40, 35, 30, 25, 20, and 10 cm was filled with a uniform solution of18F-FDG with activity concentrations of 3.70, 3.89, 1.77, 2.37, 3.85, and 10.57 kBq/cc,respectively.A sphere-to-background activity concentration ratio of 4:1 was applied to the IQ phantom in this configuration (Fig.2a and b).
In designing the configuration, we simulated geometric similarities with the human body, as demonstrated in Fig.2.For instance, the phantom placed in the first bed position from the right should simulate the human brain and be smaller than the side phantom that simulates the human chest.The dimensions of the phantom were approximate owing to manufacturing restrictions.Based on the injected activity, the resulting radioactivity concentration was 57.68 kBq/cc.This radioactivity was injected into different phantoms to simulate the uptake in different organs, as much as possible.More activity was injected into the brain simulator phantom, which was in the first bed position from the right, than into the breast simulator phantom which was in the second bed position from the right.
In both phantom configurations, emission data were acquired for a single-bed 3-min scan of the NEMA phantom,followed by CT imaging at 120 kV and 80 mA with a 1 s rotation time.In phantom I, 18 emission datasets were acquired at mean scan intervals of 15 min, with single-bed 3-min scans of the NEMA phantom placed within the scanner.To acquire data with different random rates in phantom II, 15 emission datasets were acquired with mean scan intervals of 15 min, with single-bed 3-min scans of the NEMA phantom placed within the scanner and other phantoms placed outside the FOV.
2.3 Assessment strategy
For the quantitative evaluation of image quality in our two phantom study configurations and to consider the impact of random and scatter coincidences originating from outside the FOV, various quantitative parameters such as the SNR,contrast, CRC, COV, and NECR were calculated for different activity concentrations.Sixty regions of interest (ROI) were drawn on five central slices of the IQ phantom (12 ROIs on each slice).The SNR was evaluated for each sphere size using the following equation:

Fig.2 (Color online) Illustration of phantom II in a schematic design and b GE Discovery 690 scanner
whereC(BKG) andSD(BKG) represent the mean activity concentration and mean of theSDof 60 ROIs drawn in the IQ phantom, respectively, andC(Mean) represents the mean activity concentration at the ROIs covering the sphere volume in the images.In addition, we computed ΔSNRduring imaging as the phantom decayed.
Contrast was calculated using the following equation:
whereC(Max) and Mean(BKG) represent the maximum activity concentration in a sphere and average background activity concentration, respectively.
CRC was determined using the following equation:
whereC(HOT) denotes the maximum activity concentration in a sphere.A(HOT) andA(BKG) are sphere-to-background contrast ratios.
COV was evaluated according to the following equation:
NECR was evaluated according to the following equation:
whereT,S, andRdenote the true, scatter, and random coincidence rates, respectively.True: Nonrandom pairs of photons that are not scattered.Random: Pairs of either scattered or unscattered gamma photons originating from different annihilations.Scatter: Non-random pairs of photons in which at least one gamma photon is scattered.
The percentage relative difference in the quantitative parameters for different activity concentrations for various sphere sizes was calculated for different reconstruction protocols.Box-and-whisker plots were also depicted for various sphere sizes for different reconstruction protocols.
3 Results
Figure 3 presents a visual assessment of the NEMA phantom with two different designs from the first imaging at different time intervals based on different reconstruction protocols for phantom II.Although the injected activity in phantom I was lower than that in phantom II, the detectability further deteriorated in phantom II particularly in the 10-mm size sphere in all reconstruction methods, with more significant effects on the OSEM.At nearly matched activity concentrations between phantoms I and II (approximately 16–18 kBq/cc),phantom II exhibited a significantly poorer image quality.
The random coincidence, true coincidence, and NECR curves are plotted in Fig.4 for both phantom designs(SBR= 4:1).By decreasing the activity concentration, the random coincidence, true coincidence, and NECR decreased in phantoms I and II.The activity distributed outside the FOV was greater than that inside the FOV.As shown in Fig.4a, the random coincidence did not exceed the true coincidence for all background activity concentrations.However, the random coincidence rate was higher than the true coincidence rate in phantom II when the background activity concentration increased more than 25 kBq/cc (Fig.4b).In addition, the nonlinearity of the true coincidences were notable with increasing activity concentrations owing to dead-time effects.This was also apparent in the transition between phantom I and phantom II, where even at nearly matched (16–20 kBq/cc) activity concentrations, a significant decline was noted in trues counts owing to out-of-FOVinduced dead-time effects.
The variations in theSNRvalues in the two phantom studies for different sphere sizes are presented in Fig.5.The percentage of the relative difference in the SNR for a sphere size of 28 mm (10 mm) was 162.0% (150.3%) for phantom I,based on the OSEM + PSF protocol.In addition, the changes in the SNR for a sphere size of 28 mm (10 mm) in phantom II based on the OSEM, OSEM + PSF, OSEM + TOF, and OSEM + PSF + TOF protocols were 37.9% (86.4%), 36.7%(81.4%), 32.6% (80.6%), and 31.4% (77.8%), respectively.Notably, the variation in the SNR was more significant for smaller lesion sizes versus larger lesion sizes in phantom II, unlike in phantom I.Although thex-axis is a function ofR/T, our experiments for a given phantom involved a decaying phantom (as we moved from the right to the left); in this process, althoughR/Tdecreased as the phantom decayed, the absolute counts (T) also decreased, explaining the reason for the degradation of the SNR.The critical observation, in the context of Figs.3 and 4, was that in matched activity concentrations between the two phantoms, phantom II resulted in significantly degraded images owing to significant outof-FOV counts.
The contrast in different background activities when various sphere sizes were considered is illustrated by box-andwhisker plots (Fig.6).Clearly, the OSEM + PSF in phantom I, with a median of 4.2(1.6) and a mean of 4.2(2.0) for a 28-mm (10 mm) size sphere, demonstrated the highest contrast compared with phantom II for all sphere sizes.Furthermore, among the phantom II reconstruction protocols,the OSEM + PSF + TOF showed the highest contrast for all sphere sizes, except for the 10-mm size sphere.
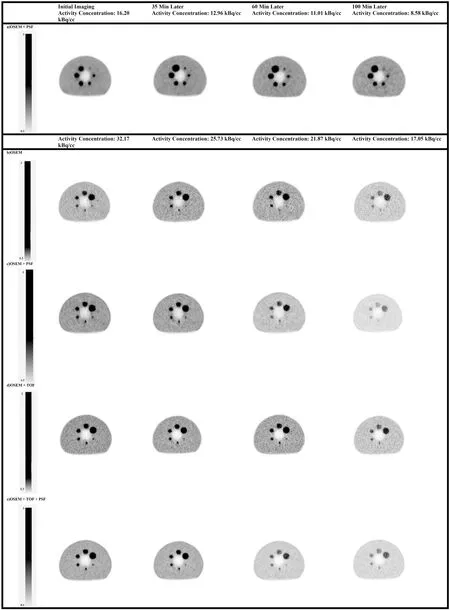
Fig.3 Transaxial slice through reconstructed NEMA phantom in both experimental designs with decreasing activity.a Phantom I (no out-of-FOV activity) and b–e Phantom II (with out-of-FOV activity) with different reconstruction protocols

Fig.4 Random coincidence, true coincidence, and noise-equivalent count rate (NECR) variations versus activity concentrations in a phantom I and b phantom II
In Fig.7, the variations in CRC are shown for different sphere sizes during various background activities.By increasing the sphere size in both phantoms, the CRC increased.Furthermore, the CRC was relatively higher in phantom I than in phantom II.From the perspective of OSM + PSF reconstruction and higher activity concentration, the CRC values for phantom I for lesions ranging from 10 to 37 mm were 35.9, 63.6, 92.2, 99.5, 113.5,and 110.3.In contrast, the CRC values for phantom II for lesions ranging from 10 to 37 mm were 25.6, 46.0, 64.5,84.9, 75.9, and 117.0.This indicated that adding coincidences outside the FOV negatively affected the CRC parameters.
The CRC values for phantom II with the highest concentration of activity and for the 37-mm lesion in the OSEM,OSEM + PSF, OSEM + TOF, and OSEM + TOF + PSF protocols were 111.5, 117.0, 107.4, and 119.4, respectively.For a larger sphere size (37 mm), the OSEM + PSF + TOF and OSEM + TOF protocols exhibited higher CRC values.The CRC values for phantom II with the highest concentration of activity and for the 10-mm lesion in the OSEM,OSEM + PSF, OSEM + TOF, and OSEM + TOF + PSF protocols were 28.0, 25.6, 31.0, and 30.0, respectively.For smaller sphere sizes (10 mm), the OSEM + PSF + TOF and OSEM + TOF protocols exhibited higher CRC values.
Figure 8 shows the COV in box-and-whisker plots versus the different background activities for phantoms I and II.Phantom I had a lower COV% than phantom II, with a median of 4.2 and a mean of 4.4, owing to an increase in the out-of-FOV random and scatter coincidence rates in phantom II.The OSEM + PSF + TOF protocol, with a median of 5.2 and a mean of 5.4 for COV, had the lowest noise of all phantom II reconstruction protocols.
4 Discussion
In this study, the effects of random and scatter coincidences from outside the FOV on the quality of PET images were assessed using two phantom configurations reconstructed using different reconstruction algorithms.In the first setup, the NEMA phantom scans were acquired separately in a one-bed position (phantom I).To simulate the effect of random and scatter coincidences that originated from outside the FOV, similar to that in real whole-body patient scans, six cylindrical phantoms with various diameters were added to the NEMA phantom (phantom II).In this study, the PET image quality for different reconstructions was assessed by considering high out-of-FOV activity.
The results obtained from analyzing the effects of the different reconstruction methods and their parameters were consistent with those by Matheud et al.[34] and Presotto et al.[26] using OSEM in iterative reconstruction with TOF and PSF and reported improved image quality and activity recovery in an FDG cardiac study.
Most modern PET/CT scanners have implemented reconstruction algorithms developed over the last few decades that apply TOF information and PSF modeling [10].The most commonly used CNR optimization algorithm is OSEM reconstruction [35].
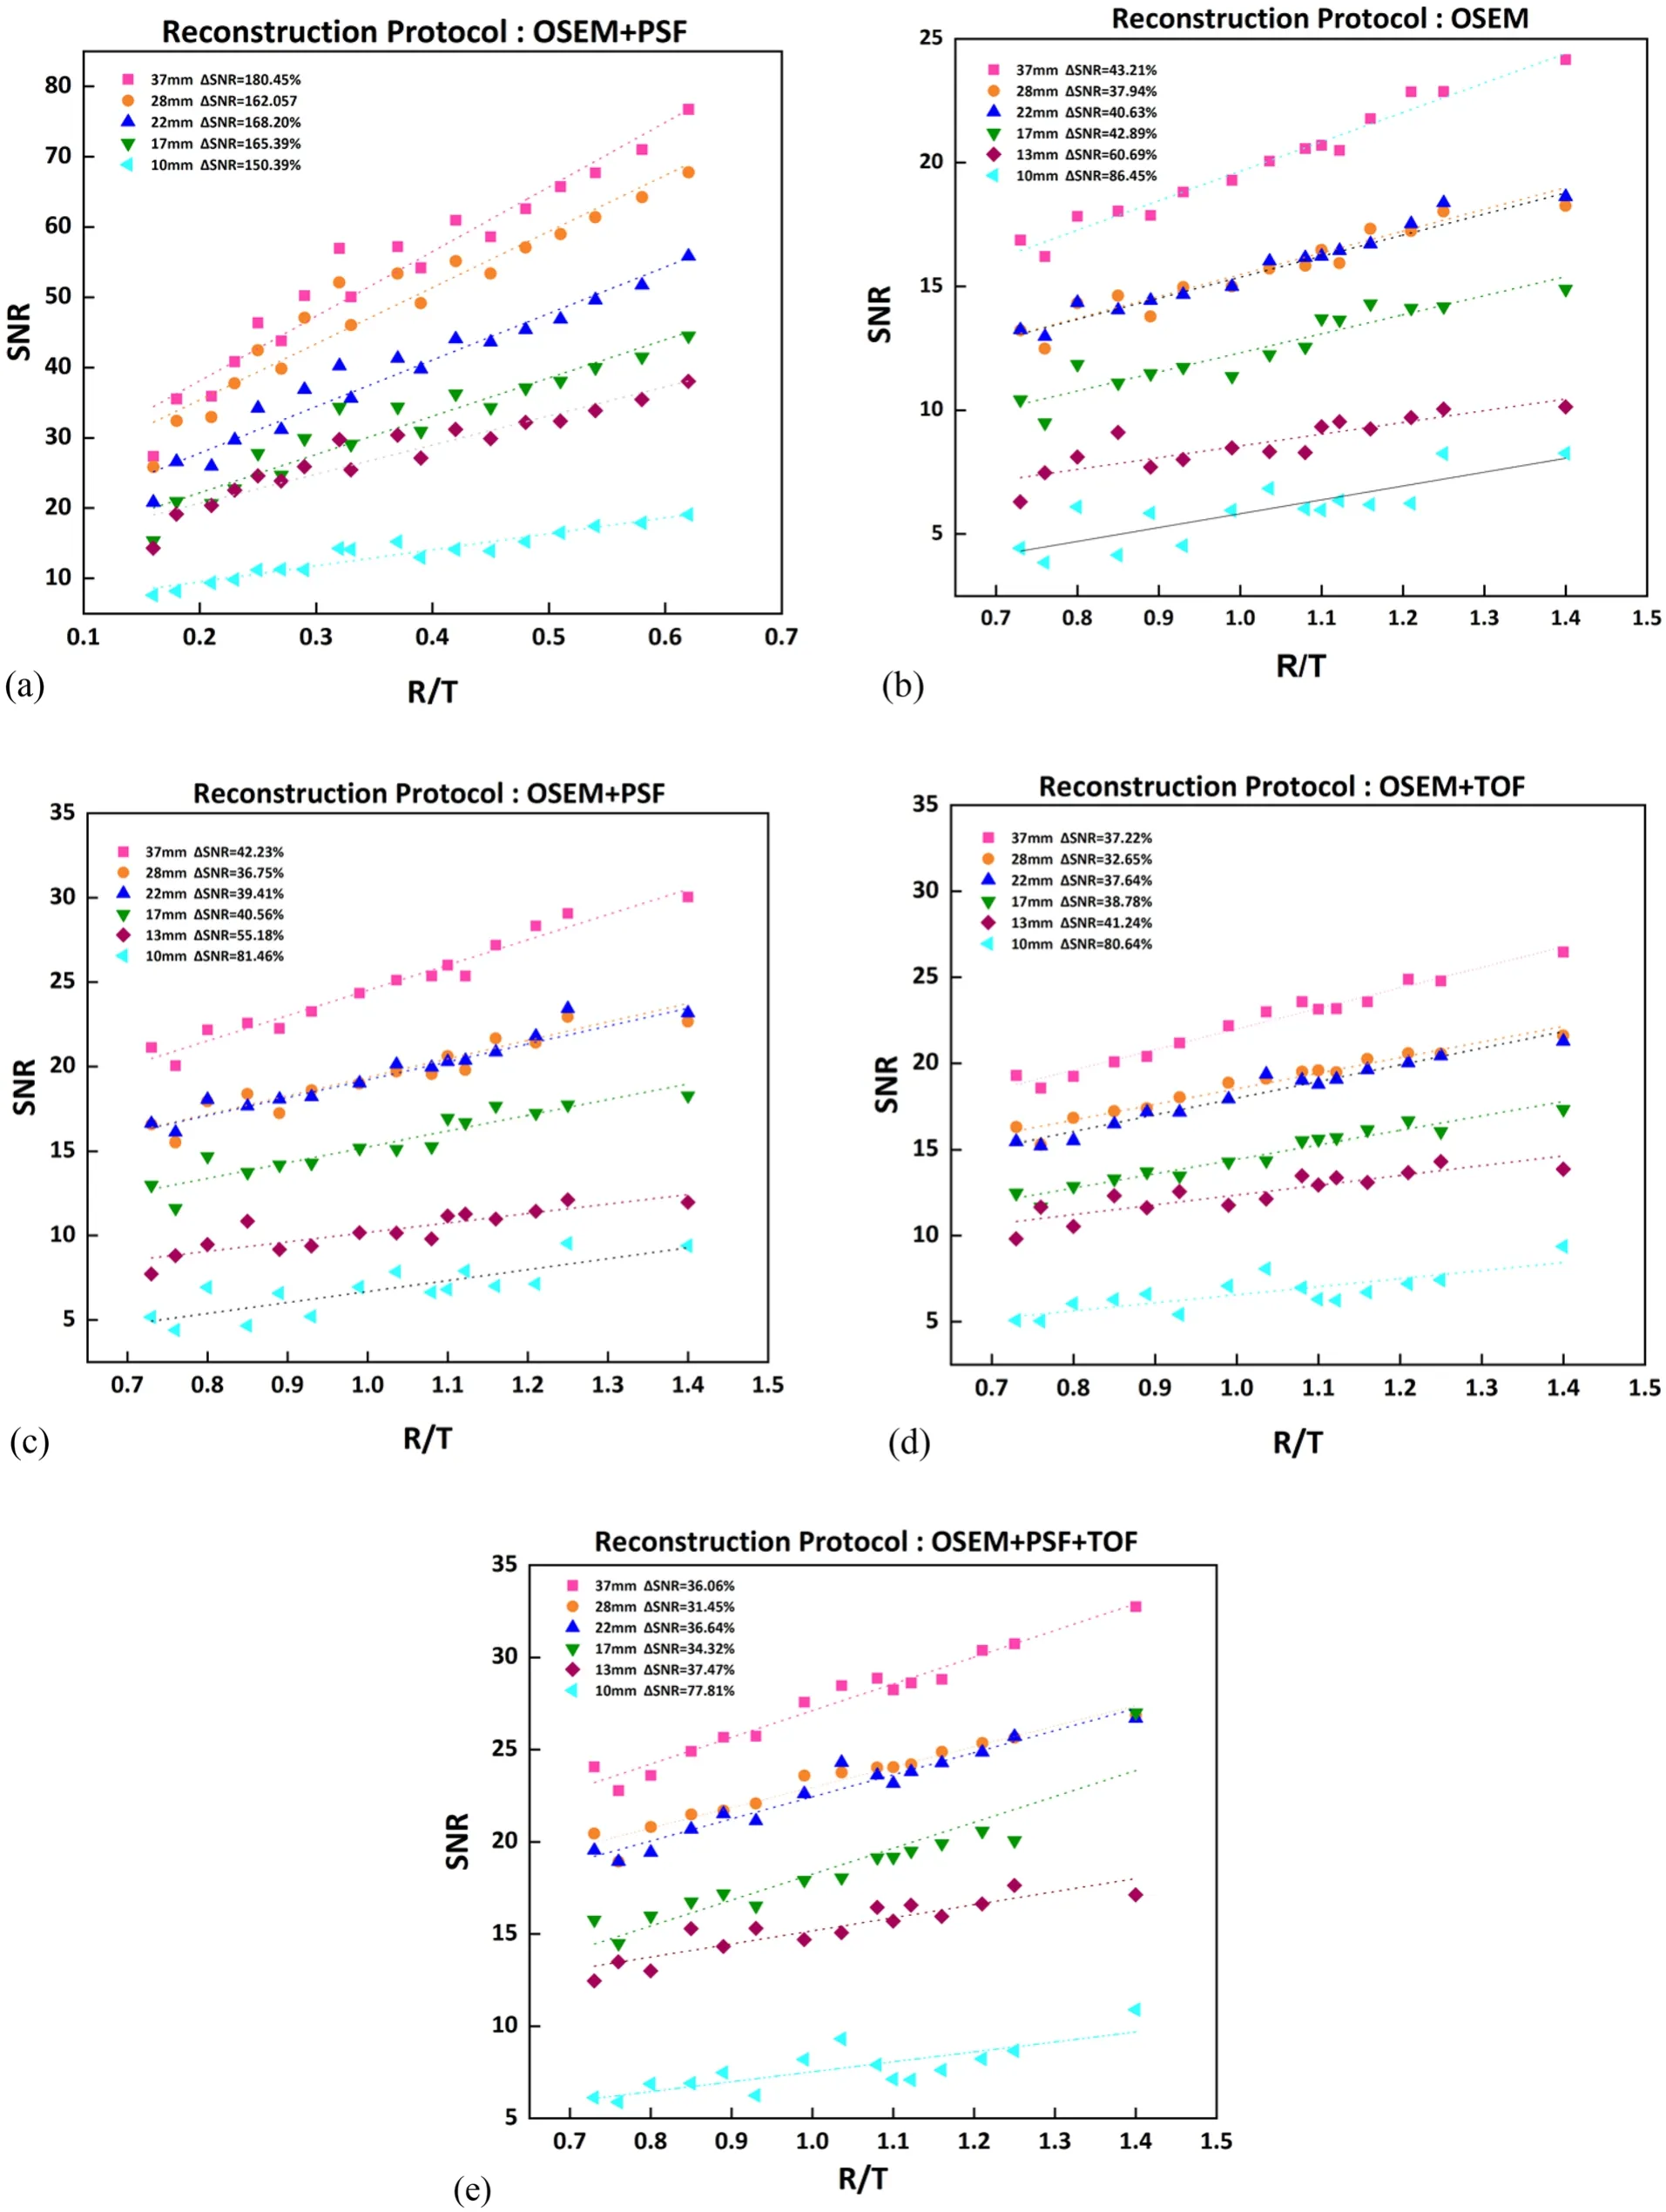
Fig.5 (Color online) SNR variations when various activities are considered in a phantom I and b–e phantom II, for different reconstruction protocols.Although the x-axis is a function of R/T, our experiments for a given phantom involve a decaying phantom (as we move from the right to the left), and in this process, though R/T decreases as the phantom decays, absolute counts (T) also decrease, explaining the reason for the degradation of the SNR
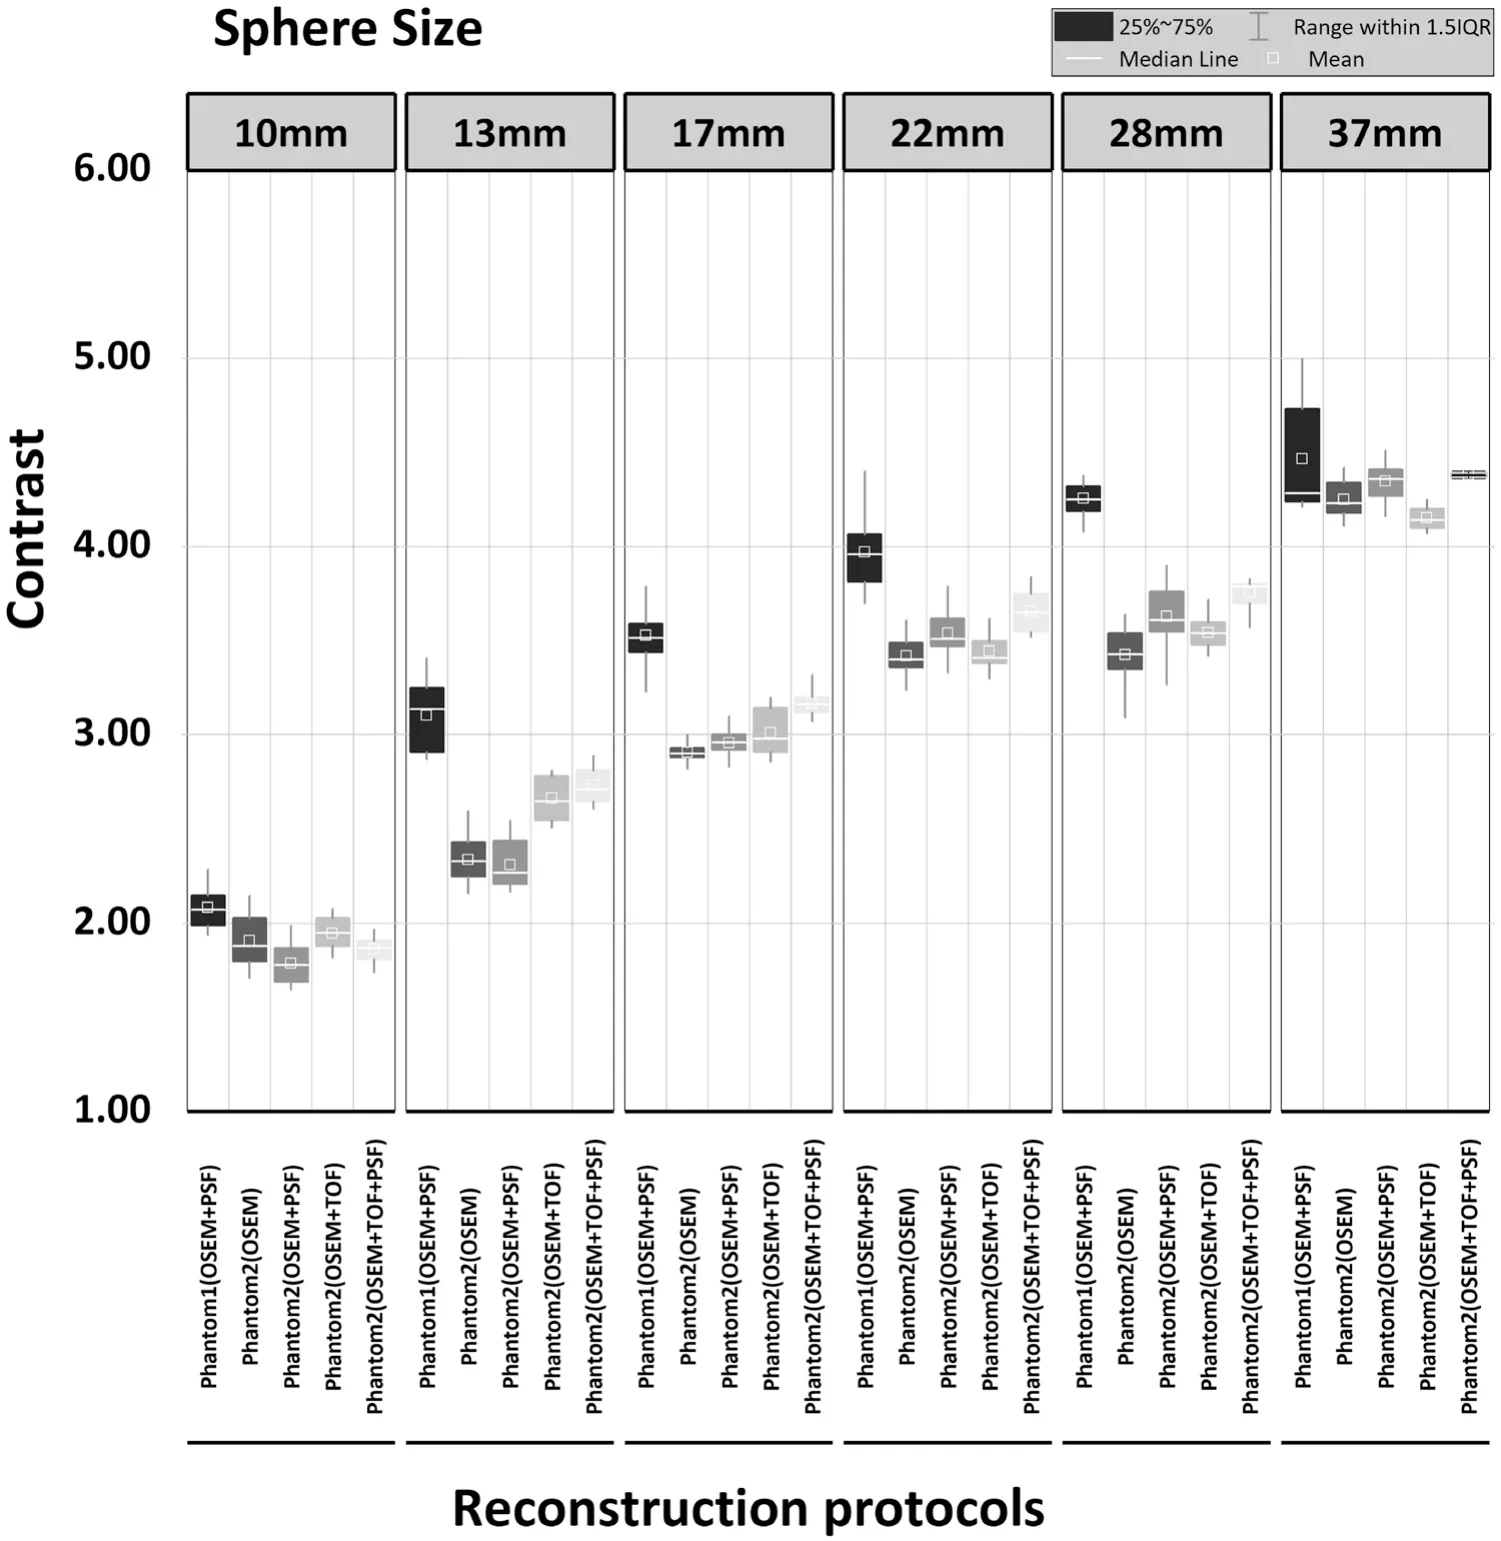
Fig.6 Box-and-whiskers plot of contrast for different spheres of phantoms, when various activities are considered in phantoms I and II with regard to different reconstruction protocols
According to Surti et al.[36], enhancing the axial FOV length can detract from the performance of a traditional scan, owing to the activity outside the FOV in terms of additional scatter and random coincidence.As already been reported, the activity and scatter environment in the axial FOV and outside the main FOV have significant effects on increasing theR/Tratio [37].As shown in Fig.4, scatter and random coincidence rates outside the FOV could also diminish the detectability in phantom II as compared with phantom I, although the background activity was higher in phantom II.
Figure 4a and b illustrate the increase in count rates andR/Tratio forSBR= 4:1 by increasing the activity concentration of the two phantoms that could increase the NECR for both phantom configurations.In addition, Carlier et al.[38]showed that the NECR and true rate were strongly correlated with the SNR.In addition, the OSEM reconstruction algorithm and its corresponding parameters affected the image SNR in the PET images that varied with the activity concentration [22].
With oncologic studies being the primary application of PET, recent work has shown that in modern TOF PET scanners, an improved trade-offexists between lesion contrast,image noise, and total imaging time, leading to a combination of improved lesion detectability, reduced scan time or injected radioactivity, and more accurate and precise lesion uptake measurement [39].
By combining Figs.3, 4, and 5, an interesting picture emerges.With increasing phantom counts, the system experienced an increasing dead-time, and in the transition from phantom I to phantom II, a major out-of-FOV-induced dead-time/paralysis was experienced.This coupled significant increase in randoms with increasing counts resulted in poorer images in phantom II than in phantom I.We evaluated the SNR for different reconstructions by considering different sphere sizes.Our findings revealed that the SNR of phantom II was lower than that of phantom I.The highest SNR was observed in the OSEM + PSF + TOF reconstruction, followed by the OSEM + PSF and OSEM + TOF reconstructions, for all sphere sizes.Shekari et al.[40] also showed a relative difference in the SNR between OSEM + TOF + PSF and OSEM reconstructions, with a considerably greater variation for smaller sizes compared to the 22 and 37 mm inserts at bothSBR= 2:1 and 4:1; this finding was consistent with our findings.Another study showed that the mean relative differences in the SNR between the non-TOF and optimal TOF in phantoms with activity ratios of 2:1 and 4:1 were 11.6 and 18.7%, respectively[[41]].
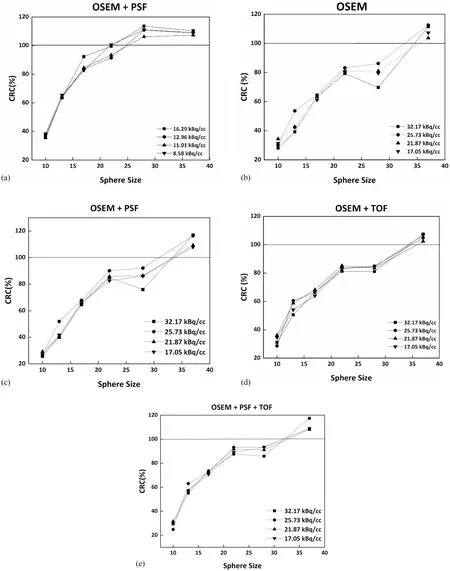
Fig.7 Variations in the CRC when various activities are considered in a phantom I and b–e phantom II, for different reconstruction protocols
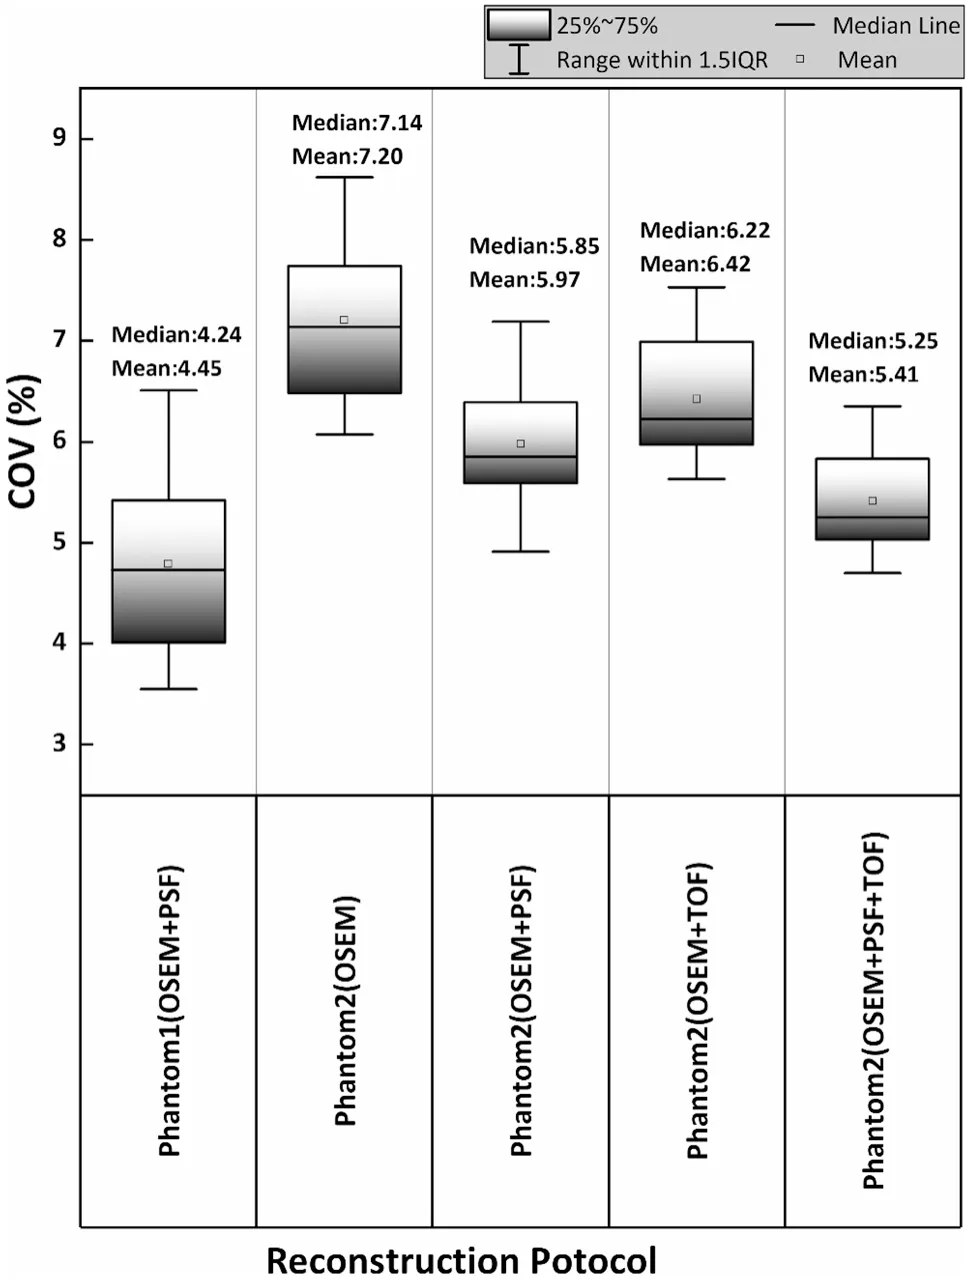
Fig.8 Illustration of box-and-whiskers plots for the COV for different background activities for phantoms I and II in the context of different reconstruction protocols
The resolution modeling of the PSF algorithm produces higher contrast values for small signals if the algorithm has sufficiently converged; this might increase the numerical observer SNR [42].The effect of the TOF algorithm on enhancing the contrast and lesion detectability was confirmed using multiple iterations and subsets at an SBR of 4:1 [43].
According to Akamatsu et al.[44], the PSF and TOF improved the COV in the phantom background in an FDG phantom study, particularly in low-activity models.The optimal COV was also obtained with the OSEM + PSF + TOF algorithm compared to other reconstructions in their study.The contrast in our phantom study was analyzed and concluded that the scatter and random coincidence rates outside the FOV affected the contrast for all sphere sizes and could lead to lower values (Fig.6).
Clearly, the contrast increased with more impact for smaller sphere sizes (10, 13, and 17 mm in diameter) and increased gradually for larger sphere sizes in both phantom designs and reconstruction protocols.OSEM + PSF + TOF and OSEM + TOF showed higher contrast values for sphere sizes of 10, 13, and 17 mm,whereas OSEM + PSF + TOF and OSEM + PSF showed higher contrast values for sphere sizes of 22, 28, and 37 mm.Moreover, the results of a study in 2019 showed that a decrease in sphere size from 28 to 10 mm (in diameter) led to a decrease in contrast recovery by 68.2 and 70.7% for OSEM and OSEM + PSF + TOF, respectively,at an SBR of 4:1 and by 54.7 and 56.3% at an SBR of 8:1, respectively [45].They revealed that TOF algorithms performed better than non-TOF algorithms in terms of contrast-noise trade-offefficiency, particularly for small lesions.According to Suljic et al.[46], the integration of TOF information into a reconstruction algorithm primarily affected the image noise level.
The random coincidence rate has been established as a significant factor affecting the image quality of PET scans[19].According to Brasse et al.[47], a low-noise estimation of random coincidences increases the image SNRs by approximately 15% as compared to the online subtraction of delayed coincidences for 3D whole-body imaging using a particular set of scanners and clinical protocols.The CRC depends on the object size, as reported by Lajtos et al.[48].According to Rogasch et al.[35], the OSEM + TOF,OSEM + PSF + TOF, and OSEM + TOF reconstructions surpassed the CRC by 10% in at least one of the three small spheres at all SBRs, and the differences increased as the SBR increased.
According to the current study, the CRC increased with increasing sphere size in both phantom configurations.The effect of background activity was lower when the TOF protocols were used for all sphere sizes, with a greater effect for OSEM + PSF + TOF.The lowest CRC value was observed for the OSEM protocol, although the OSEM + PSF protocol showed a higher CRC value than the OSEM protocol.The CRC values showed that adding coincidences outside the FOV negatively affected the CRC parameters.For larger and smaller sphere sizes (37 and 10 mm, respectively), the OSEM + PSF + TOF and OSEM + TOF protocols exhibited higher CRC values.
The present findings (Fig.7) revealed that the OSEM + PSF + TOF and OSEM + PSF protocols had lower COV values than the other protocols for phantom II.The COV in phantom I was lower than that in phantom II for all reconstruction protocols.Among the different phantom II reconstructions, the OSEM and OSEM + TOF + PSF protocols exhibited the highest and lowest COV values,respectively.
In this study, we noted that random and scatter coincidences originating outside the FOV directly affected the SNR, contrast, COV, and NECR of PET images.Lower SNR, ΔSNR, and contrast and higher COV were observed because of the random and scatter coincidences from outside the FOV.
Unlike in phantom I, variations in the SNR were more significant for smaller lesions than for larger lesions.The highest SNR was observed for the OSEM + PSF + TOF protocol.The OSEM + PSF + TOF and OSEM + TOF protocols showed higher CRC values for smaller and larger spheres (10 and 37 mm, respectively).In addition, higher values were observed for other sphere sizes in the OSEM + PSF + TOF and OSEM + PSF protocols, with a greater impact observed for OSEM + PSF + TOF.
The present results showed that random and scatter coincidences from outside the FOV caused image deterioration,with a greater impact on smaller sphere sizes and the OSEM protocol.This was more significant for higher activities,where the rate of out-of-FOV randoms was high.The random and scatter coincidence rates outside the FOV increased the SNR and COV and reduced the contrast.
5 Conclusion
Our results showed that random coincidences and scattering from outside the FOV induced image deterioration, with a greater impact on small sphere sizes and the OSEM protocol.Overall, this resulted in a lower SNR, lower contrast,and higher COV values, including out-of-FOV-induced dead-time effects.Furthermore, in scans where the number of random and scattered coincidences from outside the FOV was high, the combination of TOF and PSF reconstructions provided more favorable results than conventional reconstruction techniques.
Author contributions All authors contributed to the study conception and design.PG, MRA, and AR were involved in technical contribution of the study.Clinical contribution was performed by MBK.Material preparation, data collection and analysis were performed by MOA.The first draft of the manuscript was written by MOA and all authors commented on previous versions of the manuscript.All authors read and approved the final manuscript.
Declarations
Conflict of interest The authors declare that they have no competing interests.
杂志排行

Nuclear Science and Techniques的其它文章
- A machine learning approach to TCAD model calibration for MOSFET
- BL02U1: the relocated macromolecular crystallography beamline at the Shanghai Synchrotron Radiation Facility
- Coin-structured tunable beam shaping assembly design for accelerator-based boron neutron capture therapy for tumors at different depths and sizes
- Simulation study of BESIII with stitched CMOS pixel detector using ACTS
- Advances in nuclear detection and readout techniques
- Enhancing betavoltaic nuclear battery performance with 3D P+PNN+multi-groove structure via carrier evolution