BL02U1: the relocated macromolecular crystallography beamline at the Shanghai Synchrotron Radiation Facility
2024-01-10KeLiuHuanZhouQinXuHuaTingKongKunHaoZhangWeiWeiWangMinJunLiZhiJunWangQiangYanPanXingYaWangFengYuQiShengWang
Ke Liu · Huan Zhou · Qin Xu · Hua-Ting Kong · Kun-Hao Zhang · Wei-Wei Wang · Min-Jun Li ·Zhi-Jun Wang · Qiang-Yan Pan · Xing-Ya Wang · Feng Yu,2 · Qi-Sheng Wang,2
Abstract Macromolecular crystallography beamline BL17U1 at the Shanghai Synchrotron Radiation Facility has been relocated,upgraded, and given a new ID (BL02U1).It now delivers X-rays in the energy range of 6–16 keV, with a focused beam of 11.6 µm × 4.8 µm and photon flux greater than 1012 phs/s.The high credibility and stability of the beam and good timing synchronization of the equipment significantly improve the experimental efficiency.Since June 2021, when it officially opened to users, over 4200 h of beamtime have been provided to over 200 research groups to collect data at the beamline.Its good performance and stable operation have led to the resolution of several structures based on data collected at the beamline.
Keywords Macromolecular crystallography beamline · Shanghai Synchrotron Radiation Facility · BL02U1
1 Introduction
Macromolecular crystallography (MX) uses X-ray diffraction (XRD) to study three-dimensional structures and reveal the relationship between the structure and function of biological molecules.This is the most effective method for determining the spatial structures of biological macromolecules such as proteins and nucleic acids.As of February 2023, a total of 201,196 protein structures in the database of the Protein Data Bank (PDB) have been resolved,with the crystallography method used for 172,859 of these.The process for determining the crystal structure of a macromolecule generally includes the following steps: (1)expression and purification of the target protein, (2) growth of the crystals, (3) collection of diffraction data of the protein crystals using X-rays, and (4) analysis and calculation of the diffraction data to obtain a three-dimensional structure.Steps 2 and 3 are the most important steps in the process.It takes a considerable amount of time to obtain a suitable crystal and collect high-quality diffraction data for structural determination.As a diffraction data collection platform, the crystallography beamline is a powerful tool for analyzing protein crystal structures based on the high brightness, high collimation, and continuously adjustable wavelength characteristics of synchrotron X-rays.
Macromolecular crystallography beamline BL17U1 at the Shanghai Synchrotron Radiation Facility (SSRF) is an undulator beamline dedicated to MX.It has been in continuous service since 2009 and could deliver a high photon flux (> 1012phs/s) within a 67 µm × 23 µm spot on a sample in the 5–18 keV energy range [1].Over the past decade,over 4000 h of beam time per year have been supplied for MX research, and over 4100 protein structures have been resolved using this beamline [2–4], including some related to the pathogenesis of COVID-19 [5–7], and some related to antibodies, specific drugs, and vaccines for COVID-19[8–13].Both academic and commercial companies benefit from the stable and efficient operation of beamlines [14].
In recent years, with the growing demand for microcrystallography, smaller beamlines with higher flux densities have become a new developmental direction for MX research[15–19].It was reported that micrometer-sized X-ray beams could reduce the radiation damage to protein crystals,because the rate of energy deposition per mass of irradiated crystal was significantly reduced for beam sizes smaller than 15 μm, and as small as 5 μm [20, 21].Another advantage of brilliant micrometer-sized beams is an improvement in the diffraction resolution for small crystals, which can shorten the research period of crystal screening in some cases [22].To determine these challenging protein crystal structures,several schemes have been proposed that attempt to reduce the spot size of the beamline [23, 24].Based on the implementation of the SSRF Phase II project, beamline BL17U1 was redesigned for microfocusing in early 2019, decommissioned on Feb.8, 2021, and rebuilt as BL02U1.
The new beamline uses one of two canted undulators that share a straight section of sector 02 in the SSRF storage ring.The beamline uses a shorter undulator and canted beamline layout, which result in a smaller energy range for the delivered X-rays.The total length of the beamline is approximately 45 m, including the front end and hutch.After rapid installation and alignment, the relocated beamline was completed on May 31, 2021.
2 Beamline
The key optical components are an undulator, a monochromator, and a focusing mirror.As a canted layout beamline,the distance from the other beamline must be considered,which restricts the freedom of placement of the optical components and experimental stations.To increase this distance,two flat horizontal reflecting mirrors (HRM) are placed downstream of the double-crystal monochromator (DCM).
2.1 Source
BL02U1 and BL02U2 share a straight section in sector 02 of the SSRF, which is a third-generation light source with a 3.5 GeV storage ring 432 m in circumference.The upstream undulator (02U1), which delivers photons to BL02U1, is canted inboard by 3 mrad compared with the storage ring.The downstream undulator (02U2) is canted outboard by 3 mrad compared with the storage ring.The total canting angle between the two undulators is 6 mrad.Based on the 4.03 nm-rad emittance of the storage ring, the X-ray beam source has a size of 386 µm (FWHM) and divergence of 80µrad (FWHM) horizontally, and a size of 26 µm (FWHM)and divergence of 23 µrad (FWHM) vertically.
The beamline source is a 1.52 m long in-vacuum undulator (IVU) comprising 69 periods of NdFeB magnets, each with a length of 22 mm.The IVU has a minimum gap of 6 mm according to the current operating conditions, a peak magnetic field of 0.902 T, and a maximumKvalue of 1.81.The energy of the fundamental harmonic ranges from 2.0 to 5.1 keV when the IVU gap is tuned in the range of 6–30 mm.The undulator phase error is approximately 1.7° (rms) over the entire gap range of 6–30 mm.The IVU produces a maximum of 2.74 kW of power in total, of which only 65 W is confined in the central cone accepted by the beamline (100µrad horizontally and 50 µrad vertically).It delivers X-ray photons at 12.6 keV with a flux of 1.94 × 10¹⁴phs/s/0.1%BW in the central cone when the IVU gap is set to 7.375 mm.
2.2 Beamline optics
The optical design was optimized in order to be compatible with the canted layout, deliver as high a photon flux as possible in a focused beam smaller than 20 µm, cover a photon energy range of 6–16 keV, monochromize the photons with an energy resolution of 2 × 10⁻⁴, and obtain as large a working distance as possible for the experimental station.Along the beamline, the main optical components are the whitebeam slit, white-beam scanning wire, DCM, first diagnostic screen, first HRM, second HRM, second diagnostic screen,first beam position monitor (BPM), monochromatic beam slit, second BPM, and Kirkpatrick–Baez (K–B) focusing mirror pair, as shown in Fig.1.
The white-beam slit is located 20.5 m from the undulator,which defines the acceptance angle of the beamline as 0.1 mrad × 0.05 mrad horizontally and vertically.To withstand a heat load of up to 1500 W, the absorber is made of tantalum and has a sloped incident surface to accept the beam at a grazing angle of 2° to lower the power density.Water cooling is used to protect the absorber from the high heat loads.
The monochromator has a vertical geometry.To cover the photon energy range of 6–16 keV, a pair of Si(111) crystals in a (+n, -n) arrangement is used to monochromize the beam without dispersion.The Bragg rotation axis carries both crystals, with the first crystal at the rotation center.The exit beam position is fixed by translating the gaps between the crystals.The length of the second crystal covers the beam motion upon the variation of the Bragg angle to avoid the need for a second translation.Two piezo-positioners are mounted on the second crystal for fine pitch and roll motion adjustments.
The reflecting mirrors for the two HRMs, which are located at 28 and 30 m, were manufactured with the same geometric size for easy maintenance and cost saving.The grazing angle of each HRM is 3.5 mrad and they are coated with rhodium, which provides a high reflectivity of greater than 89% in the energy range of 6–16 keV.
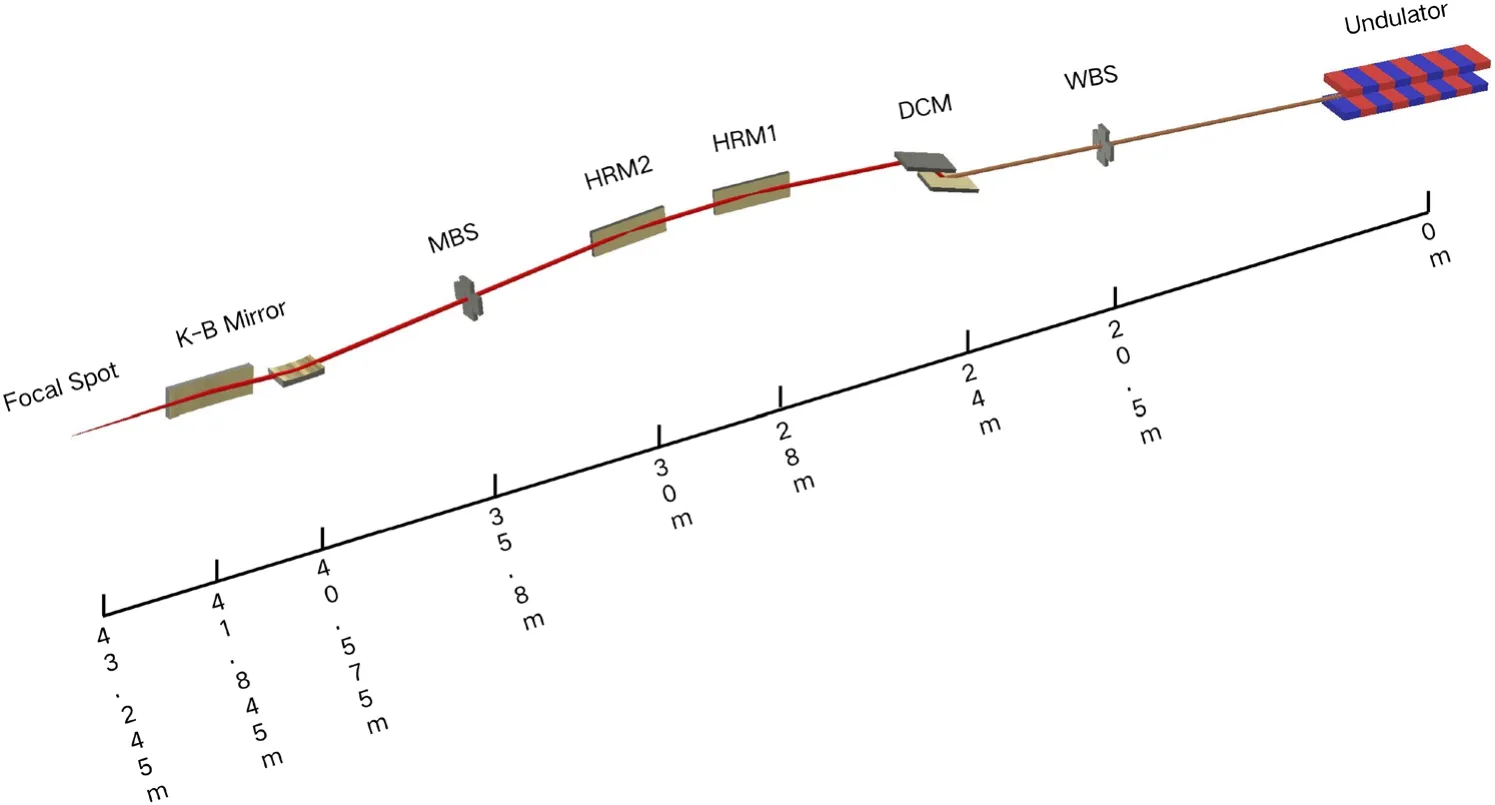
Fig.1 (Color online) Schematic optical layout (not to scale)of BL02U1.All distances are given with respect to the undulator source position
The monochromatic beam slit is located at 35.8 m,which defines the acceptance angle of the downstream focusing system.The blades of the slits are two L-shaped tantalum blocks facing each other.Each block has two motors arranged perpendicularly to achieve horizontal and vertical motion.The blocks can be moved to overlap and completely cut offthe beam.
Two elliptical surface mirrors with fixed curvatures,located at 40.575 and 41.845 m, are arranged as a K-B mirror pair to focus the beam at the sample position at 43.245 m, with demagnifications of 15.2 and 29.89 in the vertical and horizontal directions, respectively.As a compromise between the mirror acceptance angle and working distance in the experimental station, the grazing angle is 4 mrad for each mirror, which restricts the reflectivity of the rhodium coating for photon energies above 16 keV, but can improve the photon flux at 12.6 keV.
A white-beam scanning wire located upstream of the DCM and two diagnostic screens located downstream of the DCM are used for commissioning.The white-beam scanning wire comprises two crossing wires, and the scanning plane is perpendicular to the incoming beam.The scanning direction is 45°, with each wire in the scanning plane, to obtain photoelectric information in the horizontal and vertical directions simultaneously.Two diagnostic screens are placed downstream of the DCM and second HFM.Diagnostic screens equipped with YAG:Ce scintillators are used for monochromatic beam analysis.
Two BPMs are placed at 32.9 and 39.9 m and used for monochromatic beam position and direction monitoring.The BPMs are backscattered photodiode QBPMs from FMB Oxford.Each BPM has four diodes for detecting the scattered radiation from two switchable metal foils (one 0.5 µm nickel foil and one 0.5 µm titanium foil) used to detect photons in different energy ranges.
2.3 Beamline specification measurement
Through precise alignment, the beamline can efficiently deliver photons from the undulator to a sample.When the undulator gap is set to 7.375 mm, the photon flux spectrum has a range of 11–13 keV, as shown in Fig.2a, which is the 5th order harmonic of the undulator.
To evaluate the energy resolution, an absorption spectrum was obtained at the Cu K-edge, as shown in Fig.2b.The absorption edge characteristics indicated that the beamline's energy resolution was better than 2 × 10⁻⁴.
Knife-edge scans were performed to measure the beam profiles horizontally and vertically.At the sample position,the beam had horizontal and vertical profiles with 11.6 and 4.8 µm FWHM values, respectively, as shown in Fig.2c.
Considering the tuning curve of the undulator, absorption in the Be window, and remaining air path to the sample, the photon flux at the sample position should be greater than 1012phs/s over an energy range of 6–16 keV.The flux was measured when the storage ring current was 200 mA and then normalized to 300 mA, as shown in Fig.2d.
With its single-stage focusing geometry, the instability of the focused beam is caused by vibrations from the source,DCM crystal, and mirrors, which are present as beam spot vibrations and flux fluctuations.A fluorescence-based beam position online monitoring device [25] was used to measure the beam spot vibration with a sampling rate of 100 Hz and total sampling time of 10 s.An ionization chamber with high-frequency readout electronics was set downstream of the sample position to measure the fluctuation, which had a readout frequency of 100 Hz and total sampling time of 10 s.The results shown in Fig.3 indicate that the highest vibrations occurred at 8–9 Hz.The liquid nitrogen supply pump of the DCM, which was set to 28 Hz, made a small contribution to the vibration in the vertical direction.The stability (rms) of the beam position had values of 0.6 and 0.5 µm in the horizontal and vertical directions, respectively.The stability (rms) of the beam flux was 0.34%, according to the measurements.

Fig.2 (Color online) Characteristics of the photon beam: a spectrum of 5th-order harmonic of undulator with a gap of 7.375 mm, b normalized absorption spectrum at Cu K-edge, c beam profile at sample position, and d photon flux from 6 to 16 keV at sample position
All the specifications of the beamline are listed in Table 1.At the sample position, the photon flux at 12.6 keV was 4.5 × 10¹²phs/s for a spot size of 11.6 µm × 4.8 µm, and the beam divergence was approximately 1.3 mrad × 0.25 mrad.
3 Experimental station
Some equipment in the experimental station was rebuilt to suit the canted beamline layout, as shown in Fig.4.Compact and opposite designs were adopted for the diffractometer and sample changer to avoid the pipe of the other canted beamline passing through the experimental station.The working distance for the experimental station was 744 mm between the HFM exit Be window and sample position, which accommodated a beam conditional box for the diffractometer.This beam conditional box consisted of a KEI-AT20R attenuator from Kohzu for incoming photon flux attenuation, 3.3 cm ionization chamber for the incoming photon flux monitor, and shutter for exposure time control.
3.1 Detector
The detector used was a Dectris Eiger2 S 9 M with a frame rate of up to 40 Hz.It has 3108 × 3262 pixels with a 75 μm × 75 μm size, for a total detection area of 233 mm × 245 mm.The layout of the experimental station includes a detector-to-sample distance range of 150–750 mm, which provides the maximum detectable 2-theta angle of 39.2° when the detector center superposes with the beam.
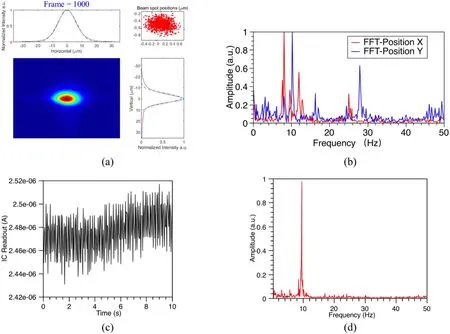
Fig.3 (Color online) Beam stability: a position stability measured at 100 Hz over period of 10 s, where the red spot in the window at the top right is the center position of the beam fitted by a Gaussian function for each frame; b Fourier transform of beam position stability; c photon flux stability measured at 100 Hz over period of 10 s, and d Fourier transform of photon flux stability
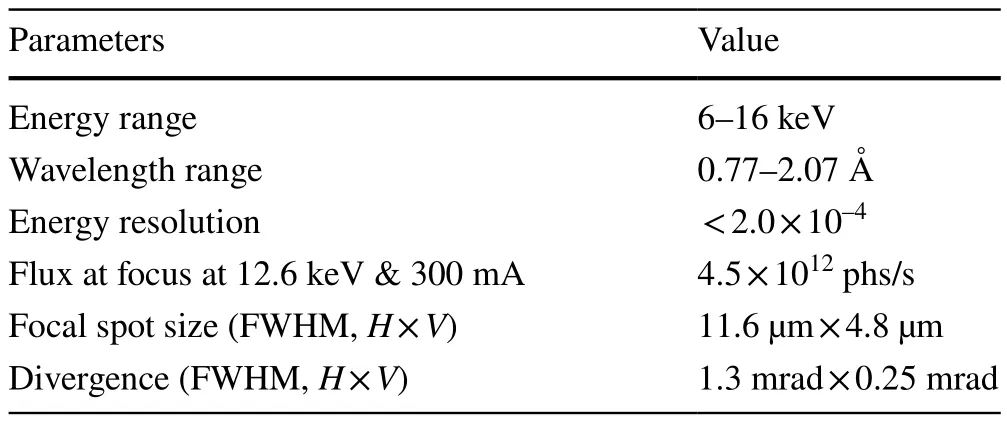
Table 1 Specifications of the BL02U1 photon beam at the sample position
3.2 Diffractometer
The rebuilt experimental station employs a homemade diffractometer called Sealion, as shown in Fig.4, which is composed of a one-axis air-bearing rotation motor, an onaxis microscope, a collimator, a beamstop, and docks for the cryostream and fluorescence detectors.
The on-axis microscope is composed of a 10 × objective lens, 90° reflecting mirror, 12.5:1 zoom lens, and 1 × camera tube with a 1/2″ CCD camera.Two holes with a diameter of 2 mm were drilled through the objective lens and reflecting mirror, which were precisely aligned to allow the passage of the beam.The microscope has a resolution of up to 900 lp/mm within a field of view (FOV) of 0.14 mm × 0.19 mm at the highest magnification mode, and a resolution of 270 lp/mm within an FOV of 1.7 mm × 2.3 mm at the lowest magnification mode.The working distance is 34 mm, which creates space to mount a sample.
The collimator is composed of two tantalum metal blocks with holes of different sizes (50 and 300 µm) for the purpose of reducing the stray beam.
3.3 Automation
There is a homemade automatic sample changer called Swordfish employed for automatic sample mounting.It is composed of a 6-axis robot arm, gripper, dewar that can contain 21 uni-pucks, and gas–liquid phase separator for a liquid nitrogen supply.
The data analysis pipeline Aquarium [26] is used for automatic data processing and can process raw data images automatically after data collection is completed.
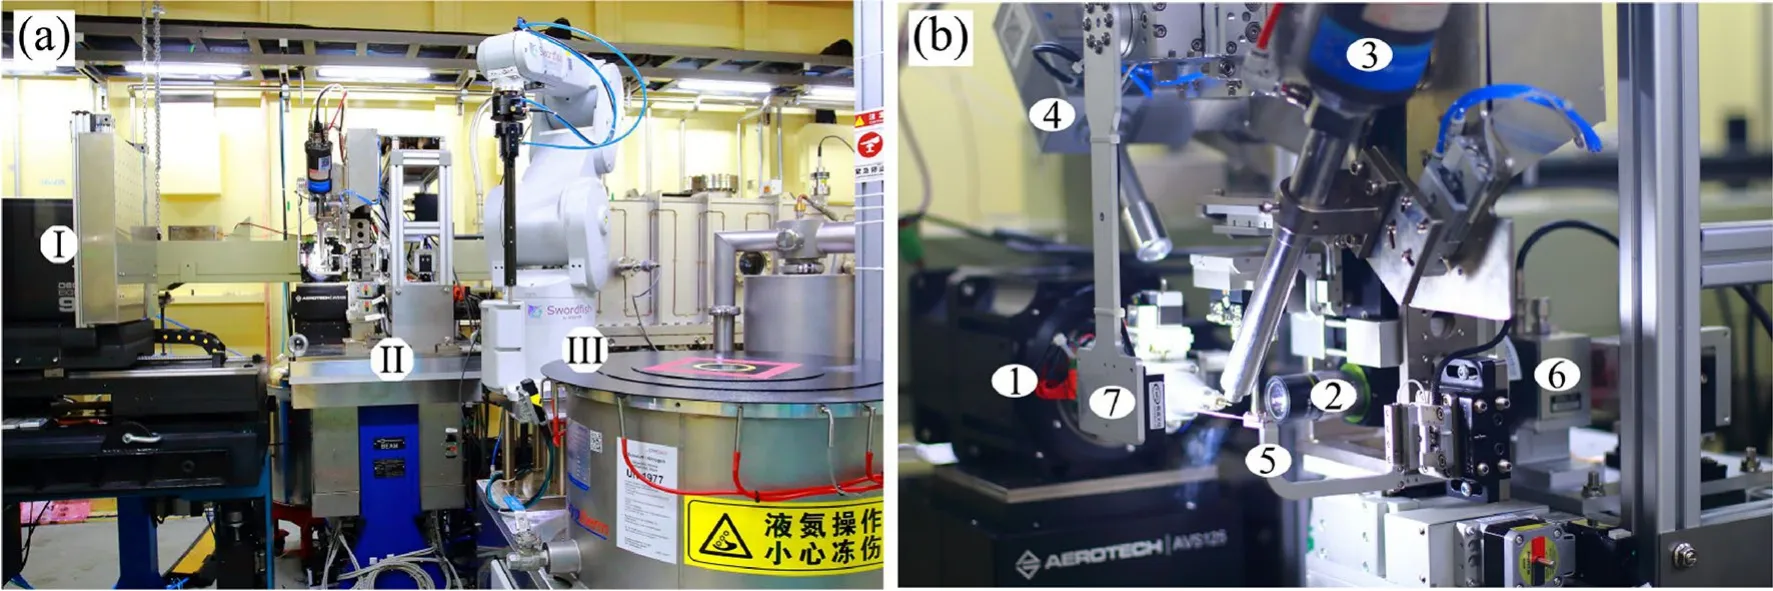
Fig.4 (Color online) View of BL02U1 experimental station and sample environment: a photograph of the experimental station showing the (I) Eiger2 detector, (II) Sealion diffractometer, and (III) Swordfish robot; and b sample environment showing the (1) air-bearing goniometer, (2) on-axis camera, (3) cryocooler, (4) fluorescence detector, (5)collimator, (6) attenuator, and (7) backlight
3.4 User interface
A homemade user interface based on webpage access called Finback is shown in Fig.5.It lists all the key information about the experiment at the top, including the electron beam current, photon energy, photon flux, sample ambient temperature, experimental hutch humidity and temperature, sample orientation angle, and detector distance.The control command module for the sample changer robot is placed on the left side, which also shows the sample information.The signal from the sensor on the goniometer indicates whether the sample is mounted.The window in the middle is an interactive interface for sample centering, and the goniometer moves the sample to the cross-hairs when the user clicks it using the microscope view.The control command module for data collection is placed on the right side and lists all the key parameters for the experimental setting, which can be a test of either a single image or the whole dataset.
3.5 Data collection
The beamline can deliver a brilliant beam with a flux density greater than 1010phs/s/µm2to a sample, which could cause significant radiation damage and destroy a crystal in seconds, even at a temperature of 100 K.Thus, it is necessary to determine a suitable strategy for data collection using either beam attenuation or a short exposure time.The latter requires higher timing synchronization precision for the goniometer, shutter, and detector.The experimental station offers a sampling rate of up to 40 Hz, which means that the shortest exposure time for each image is 0.025 s,and 40 images are generated in 1 s.To verify the reliability, a set of comparative experiments was designed,as listed in Table 2.Six thaumatin crystals were used for data collection, and each crystal was exposed three times at three locations with different exposure times and transmittances.The transmittance was inversely proportional to the exposure time to maintain the same dose rate for each dataset.The sequence ordered by the exposure time for each crystal was reversed to prevent radiation damage from affecting the consistency of the experimental data.The data analysis results showed that theRmergevalue for the inner shell of each dataset was approximately 0.04.There was no noticeable difference in the data quality obtained with long and short exposure times.However, a short exposure time with a high-transmittance beam obviously increased the experimental efficiency.
4 Productivity
BL02U1 has been available to users since June 2021 and has provided 4200 h of beam time as of February 2023.A total of 84 structures have been resolved with the support of this beamline and added to the PDB (http:// www.pdb.org), including protein, DNA, and RNA structures.
4.1 Complex structure: RBD-hACE2
The omicron and delta Covid-19 mutants are currently the two most important of the five "variants of concern(VOC)" defined by the World Health Organization (WHO).Omicron has appeared in 128 countries and regions and has attracted worldwide attention.The receptor-binding domain (RBD) of this mutant strain, which is the most critical RBD of the spike S protein, carries up to 15 amino acid mutations that cover the features of the alpha, beta,and gamma mutant strains.The delta variant is the most contagious variant of Covid-19 so far.Understanding the mechanisms by which the omicron and delta mutants recognize receptors and invade cells is critical for vaccine and drug development.Gao et al.resolved the crystal structures of hACE2 in complex with the RBDs of the omicron and delta variants at a resolution of 3.0 Å, showing the recombination of the interaction region and changes in the combined capability caused by the mutant [27].
4.2 Anti-infective therapy
The ClpP gene is highly conserved.Abnormal activation of bacterial ClpP is another way to discover new antibiotics.However, it is still difficult to develop a selective Staphylococcus aureus ClpP activator that does not interfere with the function of ClpP in Homo sapiens.By resolving the crystal structures, the research group of Caiguang Yang identified(R)–and (S)–ZG197 as highly selective Staphylococcus aureus ClpP activators [28].The key structural elements in Homo sapiens ClpP, especially W146, and their combined action with a C-terminal motif, are very helpful in the recognition of activators.These findings indicate that a species-specific activator of Staphylococcus aureus ClpP is a promising therapeutic agent for the treatment of Staphylococcal infections.
4.3 Methyltransferase ribozyme
Ribozymes can be utilized in a limited range of chemical catalyzes, such as site-specific methyl transfer reactions.The research group of Lin Huang resolved the crystal structure of a ribozyme at a resolution of 2.3 Å, which showed a threechannel structure and RNA folds that generated a specific binding site for the methyl donor substrate.The space group of the ribozyme crystal was P2221, with unit cell dimensions ofa= 50.38 Å,b= 52.5 Å, andc= 99.9 Å (PDB entry:7V9E)[29].The diffraction data were collected at a wavelength of 0.97918 Å and phased using a single-wavelength anomalous dispersion method with eleven barium atoms.
5 Discussion and conclusion
As the first macromolecular crystallography beamline at a third-generation synchrotron facility in mainland China,BL17U1 operated for over 10 years and was the most important data collection platform for Chinese macromolecular crystallography researchers.To provide better performance,the beamline was upgraded and reconstructed in a very short time.
BL02U1 was designed to overcome the shortening of the straight section and limitation of the canted beamline layout, while maintaining a high photon flux and suitable photon energy range for the research requirements of macromolecular crystallography.It provides a greatly improved photon flux density by focusing the beam down to 10 µm.At the experimental station, the use of key equipment developed in-house and self-developed control and data acquisition software greatly facilitate its operation and maintenance.Benefitting from the high photon flux density and beam stability, the experimental efficiency was significantly improved, and the time required to collect a set of diffractiondata was shortened from minutes to seconds.Based on the high-performance and high-quality operation of the beamline, many protein structures have been resolved using data collected at BL02U1.
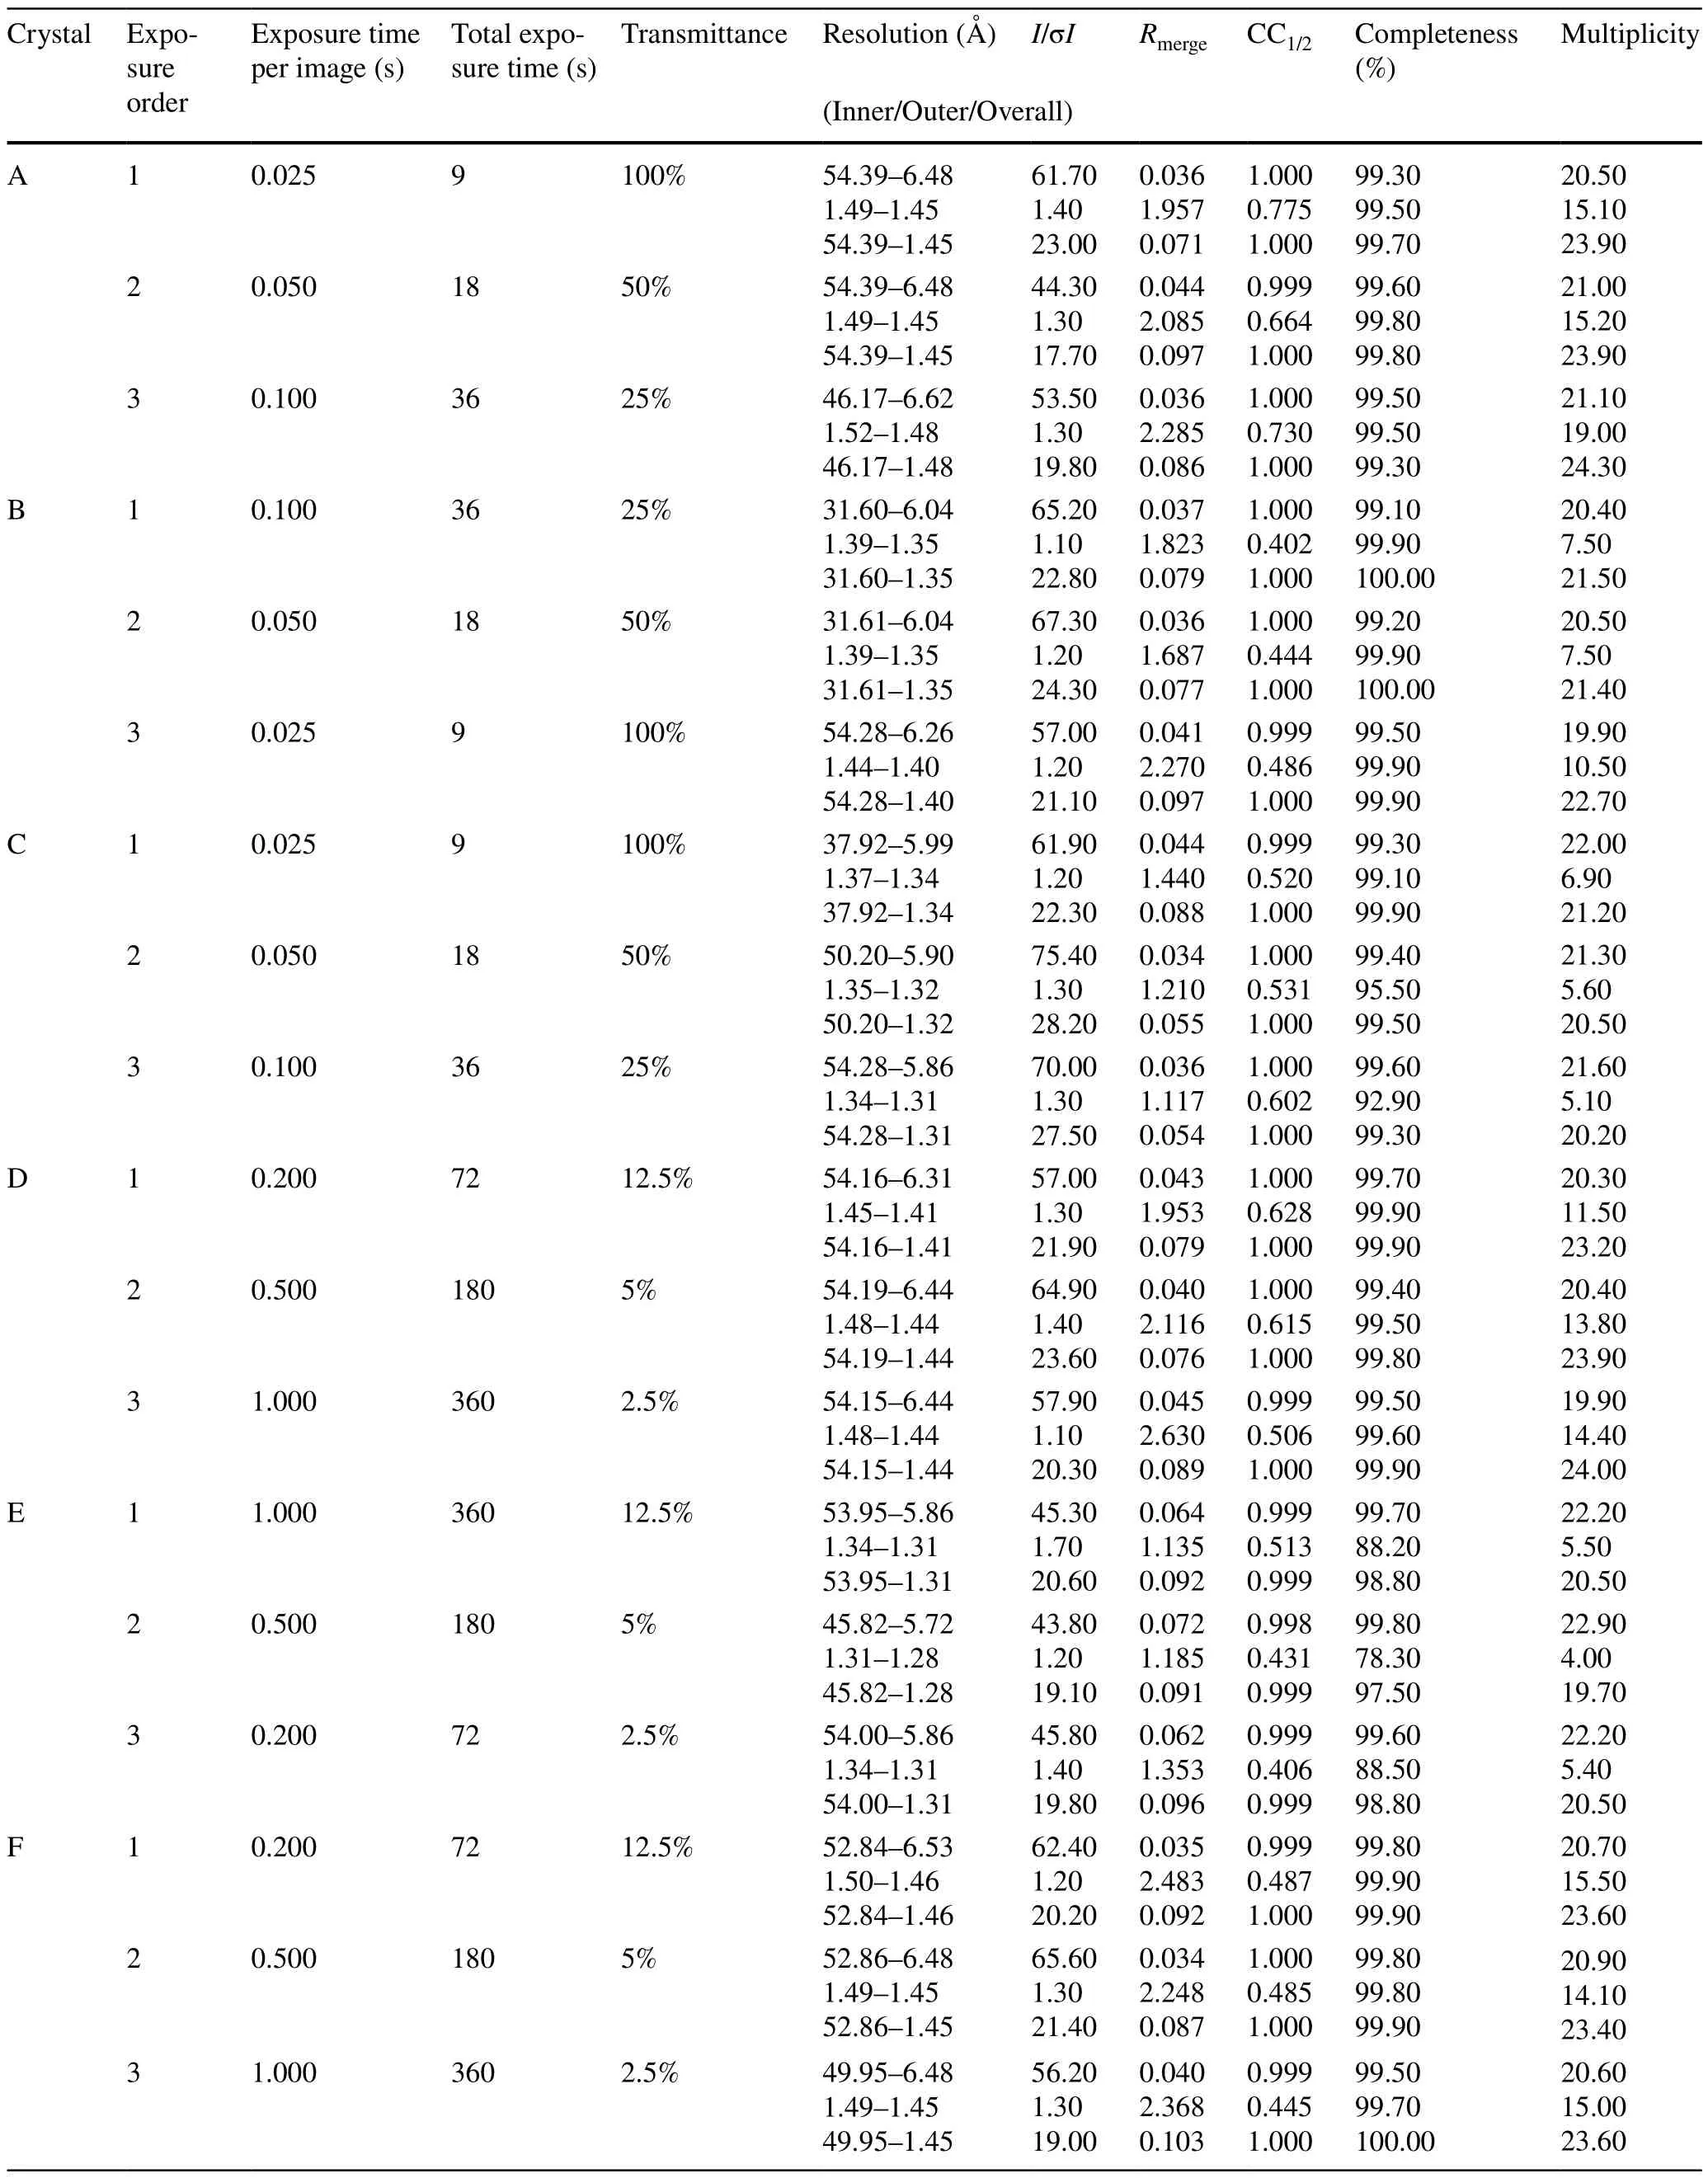
Table 2 Crystallographic data collection statistics for thaumatin
Acknowledgements We thank the staffof the department of beam engineering technology in SSRF for the engineering design and installation, as well as the financial support of the SSRF Phase-II project.
Author contributions All authors contributed to the study conception and design.Feng Yu and Qi-Sheng Wang contributed to the general study conception, financial support, and supervision of this study.Ke Liu contributed to the beamline design.Feng Yu contributed to the experimental station design.Qin Xu and Wei-Wei Wang contributed to the material preparation.Huan Zhou and Hua-Ting Kong contributed to the data collection and formal data analysis.Kun-Hao Zhang and Qiang-Yan Pan contributed to the diffractometer design.Min-Jun Li,Zhi-Jun Wang and Xing-Ya Wang reviewed the manuscript and gave many useful suggestions.The first draft of the manuscript was written by Ke Liu and all authors commented on previous versions of the manuscript.All authors read and approved the final manuscript.
Data availability statement The data that support the findings of this study are openly available in Science Data Bank at https:// www.doi.org/ 10.57760/ scien cedb.j00186.00322 and https:// cstr.cn/ 31253.11.scien cedb.j00186.00322.
Declarations
Conflict of interest The authors declare that they have no competing interests.
杂志排行

Nuclear Science and Techniques的其它文章
- A machine learning approach to TCAD model calibration for MOSFET
- Coin-structured tunable beam shaping assembly design for accelerator-based boron neutron capture therapy for tumors at different depths and sizes
- Simulation study of BESIII with stitched CMOS pixel detector using ACTS
- Advances in nuclear detection and readout techniques
- Enhancing betavoltaic nuclear battery performance with 3D P+PNN+multi-groove structure via carrier evolution
- Measurement and simulation of the leakage neutron spectra from Fe spheres bombarded with 14 MeV neutrons