Measurement and simulation of the leakage neutron spectra from Fe spheres bombarded with 14 MeV neutrons
2024-01-10QiZhaoYangBoNieYanYanDingShiYuZhangJieRenKuoZhiXuXinYiPanXiChaoRuan
Qi Zhao · Yang-Bo Nie, · Yan-Yan Ding · Shi-Yu Zhang · Jie Ren · Kuo-Zhi Xu · Xin-Yi Pan · Xi-Chao Ruan,
Abstract Iron is commonly used as a structural and shielding material in nuclear devices.The accuracy of its nuclear data is critical for the design of nuclear devices.The evaluation data of 56Fe isotopes in the latest version of the CENDL-3.2 library from China was significantly updated.This new data must be tested before it can be used.To test the reliability of this data and assess the shielding effect, a shielding benchmark experiment was conducted with natural Fe spherical samples using a pulsed deuterium–tritium neutron source at the China Institute of Atomic Energy (CIAE).The leakage neutron spectra from the natural spherical iron samples with different thicknesses (4.5, 7.5, and 12 cm) were measured between 0.8 and 16 MeV after interacting with 14 MeV neutrons using the time-of-flight method.The simulation results were obtained by Monte Carlo simulations by employing the Fe data from the CENDL-3.2, ENDF/B-VIII.0, and JEDNL-5.0 libraries.The measured and simulated leakage neutron spectra and penetration rates were compared, demonstrating that the CENDL-3.2 library performs sufficiently overall.The simulation results of the other two libraries were underestimated for scattering at the continuum energy level.
Keywords Iron sphere · CENDL-3.2 · Shielding benchmark experiment · Pulsed 14 MeV neutron source · Time-of-flight method
1 Introduction
A complete set of nuclear data is frequently required as an input for simulation calculations for the design of reactors,nuclear fuel cycles, nuclear medicine, and applications of nuclear technology [1, 2].Most international countries with nuclear power have created evaluation libraries to meet the application requirements of nuclear data.The USA, Western Europe, Soviet Union, Japan, International Atomic Energy Agency, and China have constructed nuclear data libraries since the 1960s, such as the ENDF/B, JEEF, BROND,JENDL, FENDL, and CENDL, respectively.The latest version of the CENDL-3.2 library was released in 2020 [3],whereas that of the JENDL-5.0 library was released in 2021[4].
Nuclear evaluation data refers to the results obtained from assessments or evaluations of nuclear processes or events and can be used to assess the safety and efficacy of nuclear technology.This type of data may include the measurements of radioactive materials, radiation levels, and other parameters related to nuclear events or processes.These data are widely used for microscopic cross-sectional measurements[5–7], as well as for accelerator and reactor designs [8].Nuclear evaluation data are important for assessing nuclear safety, particularly for developing and operating nuclear power plants and other facilities that handle radioactive materials.Nuclear technologies require careful monitoring and assessment to ensure that safety risks are minimized and the technologies are used effectively and responsibly[9].A benchmark experiment is critical for determining the accuracy of the assessment data and is an important aspect of analyzing nuclear data before it is distributed to users[10].Macroscopic sample measurements are an important prerequisite for benchmark experiments; for certain critical evaluation data, a series of macroscopic sample measurements must be performed to verify their reliability.Benchmark experiments are important for validating the nuclear data, which is essential for a wide range of nuclear applications.A benchmark experiment involves comparing predictions made using nuclear data with experimental measurements obtained under controlled conditions.By comparing the results of these calculations with the experimental data,scientists can evaluate the accuracy of the nuclear data in predicting the behavior of nuclei under various conditions.
This process is critical for ensuring the safety and reliability of nuclear applications because inaccurate nuclear data can lead to errors in the reactor design and operation, as well as present potential safety risks [11].Therefore, benchmark experiments are critical for improving the understanding of nuclear processes and developing more accurate models for predicting the behavior of nuclei.
Iron plays a critical role in the nuclear industry owing to its unique properties [12], including its ability to absorb and decelerate neutrons, which are fundamental particles used in nuclear reactions.Iron is extensively used in the construction of nuclear reactors, particularly in the form of steel, an alloy mainly composed of iron.In nuclear reactors,iron-based materials are used to manufacture various components, such as reactor pressure vessels, steam generators,and fuel cladding.These components are crucial for the safe operation of reactors and are critical for controlling nuclear reactions.Iron is also used for nuclear fuel production.In certain nuclear reactors, iron is used as a matrix material to encapsulate the nuclear fuel pellets.Encapsulation helps contain radioactive material and prevents it from leaking into the environment.Overall, the role of iron in the nuclear industry is essential because it provides a reliable and durable material for constructing nuclear facilities and manufacturing nuclear components.Improving the accuracy of the nuclear evaluation data of Fe isotopes, especially56Fe, is highly significant for reducing the redundancy of the shielding design of nuclear devices and improving their miniaturization and refinement.The penetration problem, which is the movement of particles in a wide geometric region packed with matter, is one of the most common challenges in radiation shielding calculations.To improve the accuracy of the calculation results of radiation shielding after the neutrons deeply penetrate the iron, high-quality nuclear evaluation data of56Fe is required as supporting information.
Several shielding benchmark experiments of Fe have been conducted to test the evaluation data of the Fe isotopes.These include measurements of the leakage neutron spectra of the Fe sphere by a D–T neutron source in the Lawrence Livermore National Laboratory (LLNL) [13], the angular leakage neutron spectra of slab samples in the Japan Atomic Energy Research Institute (JAERI) [14], and the leakage neutron and γ spectra of slab samples in the Technical University of Dresden (TUD) [15].The absolute reaction rates in spherical Fe systems were measured at the Institute of Nuclear Physics and Chemistry of CAEP [16, 17] and the leakage neutron spectra of the slab samples were measured at the China Institute of Atomic Energy (CIAE) [18].These results provide important experimental data for analyzing and improving the Fe evaluation data in their libraries [19].
To assess the quality of the56Fe evaluation data in the CENDL-3.2 libraries and to provide high-quality evaluation data for the deep penetration shielding calculations of Fe,a shielding benchmark experiment of Fe spheres based on a fusion D–T neutron source was conducted in this study.Using the time-of-flight method, the leakage neutron spectra of D–T neutrons passing through iron spheres of different thicknesses were measured, which were 4.5, 7.5, and 12-cm-thick, and the measured energy ranged between 0.8 and 16 MeV.The MCNP-4C program was used to obtain the simulated results; the evaluation data of Fe from the CENDL-3.2, ENDF/B-VIII.0, and JEDNL-5.0 libraries were used.The simulated and experimental results were compared and the differences were analyzed.The results demonstrate that the simulated results of the CENDL-3.2 library are in sufficient agreement with the experimental results, and the evaluated nuclear data of Fe from the CENDL-3.2 library can be used as the optimal data for nuclear device shielding calculations.
2 Experiment setup
The Chinese Academy of Atomic Energy Sciences established an integral experimental system for verifying the nuclear evaluation data [20–24].Because there is only one reaction channel for neutron and hydrogen (H) elastic scattering, and its cross-section is commonly used as the international standard, the leakage neutron spectrum obtained by measuring the hydrogen-containing material (standard sample) is the main source for checking the integration of the experimental system.The CIAE system was experimentally tested by measuring the leakage neutron spectra of polyethylene and water samples [25].The schematic of the experiment for measuring the leakage neutron spectrum of an Fe sphere sample is shown in Fig.1, which mainly includes a neutron source, sample, collimated shield, detectors, and an electronic acquisition system.The primary experimental parameters are listed in Table 1.
2.1 Neutron source

Fig.1 (Color online) Overall experimental layout
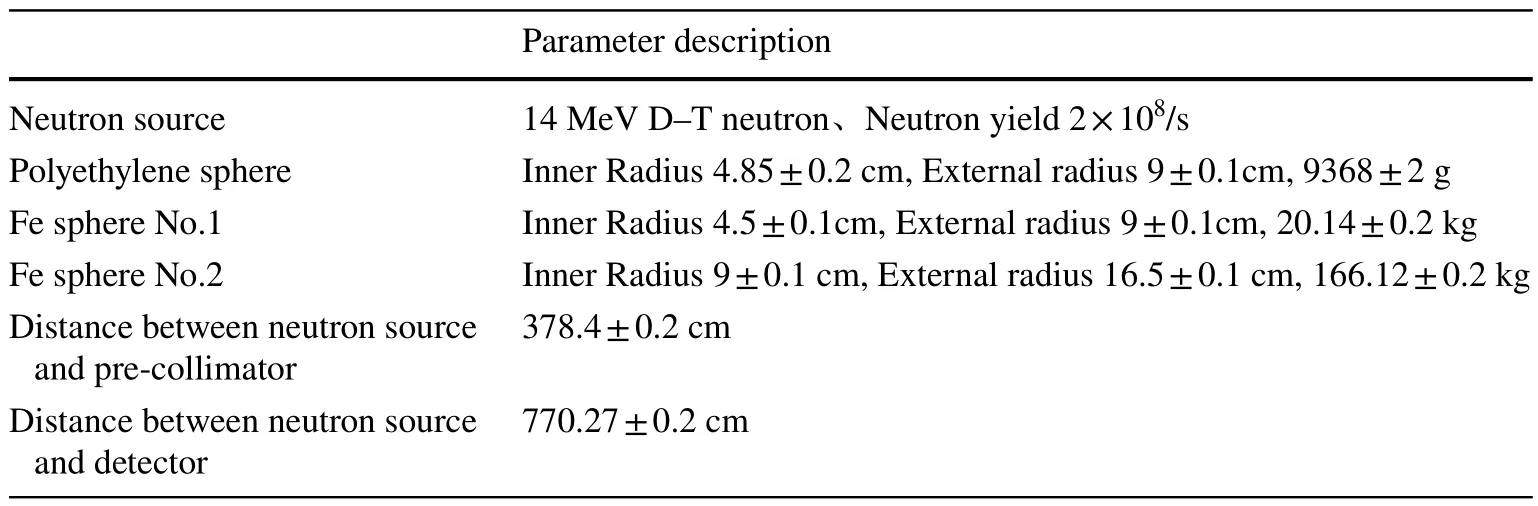
Table 1 Main experimental parameters
Pulsed 300 keV D ions were generated using a Cockcroft-Walton accelerator at the Key Laboratory of Nuclear Data in CIAE, which bombards a tritium–loaded titanium (T–Ti)target to produce pulsed neutrons of approximately 14 MeV through the D(T, n)4He reaction [26].The diameter of the T–Ti target was 2.2 cm, and that of the active zone was 1.6 cm; the thickness was approximately 2.6 μm.The parameters related to the D–T neutron source are as follows.The beam intensity, pulse width, frequency, and neutron yield are approximately 10 μA, 2.5 ns, 1.5 MHz, and 2 × 10⁸/s,respectively.The neutron yields in this experiment were acquired using the associated particle method, which measured the4He particles using an Au–Si surface barrier detector situated 135° from the beamline [27, 28].
2.2 Samples
Polyethylene and natural iron were selected as the samples;among these, the polyethylene sample was used to test the accuracy of the data received from the measurement system.The spherical Fe shell model of the sample is shown in Fig.2, which is joined by two hemispherical shells.There are two holes in the spherical shell, which are used to accommodate the target tube of the neutron source; the tube is used to hold the associated4He particles to enable the T–Ti target to penetrate the center of the shell.The dimensions are listed in Table 1, and the mass ratios of the various elements of the sample iron sphere are listed in Table 2.A new spherical shell (Fe sphere No.3) is used in these experiments, which is composed of Fe spheres Nos.1 and 2.Considering the influence of the two hemispheres on the leakage neutron spectrum at the fitting point, the fitting plane is rotated by approximately 15° when the sample is placed.Thus, the detector is a complete block of iron spheres at a stereo angle to the sample.
2.3 Collimator

Fig.2 Model of spherical iron shell
During the experiment, neutrons not only interact with the sample, but also with other devices in the laboratory;these neutrons may enter the detector after scattering and form background counts.To reduce the influence of the background, a system that combines collimating and shielding was used in the experiment, which was composed of a pre-collimator and an additional collimator embedded in the wall [29].By using this system and placing the detector outside of the collimator in the wall, the background spectrum measured in the experiment was far lower than the other spectra, as shown in Fig.3.
2.4 Detector systems and data processing
The time-of-flight spectra of the leaking neutrons were measured after passing through the spherical Fe sample.An EJ-301 liquid scintillator detector that was 5.08 cm in diameter and 2.54 cm thick was used; the distance between the detector and neutron source was 769 ± 1 cm at the 90°direction of the beam.Figure 4 presents the electronic circuit used in the experiment.
The acquisition system using the CAMAC bus unified the EJ-301 detector and beam pick-up signals into the KMAX system to obtain the charge integration of the signals (QDC),pulse shape discrimination spectrum (PSD), and time-offlight spectrum (TOF) of the leakage particles.

The QDC of the signal was used as the energy (En) of the particle, after which the energy scale was calibrated with137Cs and22Na γ radioactive sources.
Considering PSD, particle discrimination is performed according to the different times of the pulse crossing the zero-point generated by the different particles; the 2160A module produced by CANBERRA accomplished this function.
The TOF is derived from the anode signal of the detector as the starting time signal.There is a copper ring in the accelerator tube that generates an induced charge when a D-ion pulse beam cluster passes through it to form a pick-up signal, which is used as the stop signal after an appropriate delay.Therefore, to determine the actual time of the neutron flight, the time of one cycle is deducted from the observed time.
The neutron and γ were screened and selected by an offline analysis using the Kmax software to obtain the neutron and γ time-of-flight spectra of the EJ-301 detector,where the γ time-of-flight spectra can be used to obtain the time distribution of the pulsed neutrons.
During the experimental data processing, the final time-of-flight spectrum was obtained using the following equation:
Here, TOFinis the actual neutron spectrum entering the detector,εNis the detector efficiency,Kis the coefficient when measuring the neutron yield by the accompanying particle method,Nαis the number of alpha particles obtained from the measurement,Sis the detector area,TOFOUTis the neutron event detected by the detector, andis the count of the neutron source.The spectrum of the final time-of-flight was obtained as the neutron flux per unit neutron per unit area (cm-2).
3 Simulation
In addition to the experimental measurements, experimental simulations are also an important part of the shielding benchmark research.The simulation was implemented by using the MCNP code.The neutron time-of-flight spectra simulated results were obtained using the neutron evaluation data of a specific library and MCNP code, which can be directly compared to the experimental results.Subsequently,the simulated results were compared with the experimental results to evaluate and verify the evaluation data.The neutron source, sample, and detector are the most important parameters in the experiment.An accurate description of the neutron source (energy spectrum distribution, angular flux distribution, and pulsed time distribution) and detector(neutron detection efficiency curve) is critical for ensuring the accuracy of the simulation results [30].
3.1 Energy spectra and angular distribution of the neutron source
MCNP simulations require input information of the neutron source; the precision of the description of the neutron source directly affects the accuracy of the output results.In general,the energy spectrum and angular distribution of the neutron source can be obtained using both experimental measurements and simulations.However, accurate experimental measurements are difficult given the situation of an accelerator in an experimental hall; therefore, the TARGET program was used to calculate the energy spectrum of the neutron source [31].The TARGET program, developed by PTB in Germany, can calculate the energy spectrum and angular distribution of a deuterium–tritium neutron source based on the incident D-particle and target parameters (energy, pulse width, and tritium target thickness).The results of the TARGET calculations are shown in Fig.5, where the neutron energy decreased as the exit angle increased.The spectrum of the neutron source and the angular distribution calculated by using the TARGET program can be directly used as the parameters of the neutron source in the MCNP program.

Fig.5 (Color online) The energy spectrum and angular distribution of the D–T neutron source
3.2 Time distribution of the pulsed neutron
In the simulation of the time-of-flight spectrum, the pulsed time distribution of the neutron source requires a precise description.The pulse-time distributions of the neutron sources for the different samples were obtained by extracting the time-of-flight spectra of the leakage γ-particle from the measurements.In the offline analysis of the data, the γ-particle was selected to extract the time-of-flight spectrum,which can be used as the time distribution of the pulsed neutrons after appropriate processing, as shown in Fig.6.
3.3 Detector efficiency
A liquid scintillator detector was used to measure the energy spectrum of the fast neutron in the experiments.The detector efficiency curve is an important parameter for measuring the neutron spectrum by liquid scintillator detectors.The detector efficiency curve was calculated using the NEFF program developed by PTB (Germany) [32], which was obtained after describing the detector geometry, light response curve,and energy threshold in the NEFF program.The threshold energy for simulating the detector efficiency curve was chosen to be 0.3 times that of the Compton edge energy of137Cs,and the neutron energy corresponding to this Compton edge was 0.8 MeV.The simulation results are shown in Fig.7,which were stored as the detector efficiency in the input card of the MCNP code.

Fig.6 (Color online) Time distributions of pulsed neutrons of the different samples

Fig.7 Simulation result of the detector efficiency
3.4 The time-of-flight spectrum
The energy spectra, angular flux distribution, pulse-time distribution of the source neutrons, and detector efficiency curve of the liquid scintillator detector are described in the input card of the MCNP-4C code [33].The environment of the experimental hall was complicated and difficult to describe for the simulated physical model; thus, only neutrons within the solid angle of the detector to the sample were considered.According to the background measurement shown in Fig.3, the neutrons scattering into the detector by the walls, ground, and other facilities can be ignored.Structures that significantly influence the neutrons of the incoming detector include the target, sample,and collimators.Therefore, the entire experimental hall was simplified as an air-filled cylinder.The target, collimators, and sample were modeled according to the actual structure anddimensions.The data for polyethylene and Fe were adopted from the evaluation data of the CENDL-3.2, ENDF/B-VIII.0[34], and JEDNL-5.0 libraries, and all other structural material information of the nuclei were obtained from the evaluation data of the CENDL-3.2 library.The simulated results of the time-of-flight spectra can be directly obtained using the MCNP program.A ring detector was used in the simulation, and the time-of-flight spectrum obtained from the simulation indicates the neutron flux per unit area (cm-2), which can be directly compared with the experimentally measured spectrum.The calculation model is shown in Fig.8.

Fig.8 (Color online) Simulation model in the MCNP program
4 Uncertainties analysis
The final time-of-flight spectrum obtained in the experiment is given by Eq.1, where the coefficient k of the associated particle method is corrected by comparing the measurements and simulations of the neutron source; thus, the value ofKis as follows:
whereNEXis the neutron count obtained by measuring the time-of-flight spectrum of the neutron source,Nαnis the corresponding associated α count,εSMis efficiency of the detector obtained from the simulation,NSIMis the flux of the simulated time-of-flight spectrum of the neutron source,andSis the detector area.According to Eqs.1 and 2, TOFfinalis as follows:
Because the experimental data are finally normalized using the relative coefficients, considering that the ratio of the experimental measurements of the neutron source to the simulation results is used as the relative coefficientK, most of the systematic errors are reduced or eliminated, including the angular errors caused by the measurements of the associated α particle and time-of-flight spectra.Only the statistical error from the simulation of the neutron source(≤ 0.5%), the statistical uncertainties in the measurement of the time-of-flight spectrum of the neutron source (≤ 0.5%),the statistical uncertainties in the measurement of the alpha particles (≤ 0.2%), the relative detection efficiency uncertainties (≤ 3%), and the statistical uncertainties in the neutron counts of each channel remain in the final uncertainties[35].
5 Experimental results and discussion
5.1 Neutron source measurement results
First, the TOF spectrum of the D–T neutron source was measured directly in the experiment, the results of which are shown in Fig.9a.The leakage neutron spectrum is composed of the following two parts: the direct contribution of the neutrons emitted by the source and the contribution of the scattered neutrons.The direct contribution from the neutron source was mostly between 120 and 206 ns, and the contribution from the scattered neutrons was mostly between 206 and 620 ns.The target tube-scattered, air-scattered, and collimator-scattered neutrons accounted for the majority of the scattered neutrons.
The model shown in Fig.8 was used to simulate the timeof-flight spectrum of the neutron source.Table 3 lists the integral values of the experimental and simulated results for the two intervals and the C/E ratio (simulated value/experimental value).The experimental and simulated results for the direct contribution interval of the neutron source were significantly similar, indicating that the measurement system was generally reliable.The experimental results are higher than the simulated results for the scattered neutron interval; Fig.9a demonstrates that there is a peak near 350 ns(approximately 2.5 MeV), which is primarily owing to the fact that the unreacted deuterium (D) ions will be continuously deposited in the target during the experiment, and subsequently react with the incident D ions behind with the D(d,n)3He reaction to produce neutrons of approximately 2.5 MeV.The probability of this reaction increases as the time of the target usage increases.In addition, the situation in the experimental hall is more complex than that in the simulation model.It is impossible to consider all scattered neutrons, leading to lower simulation results.
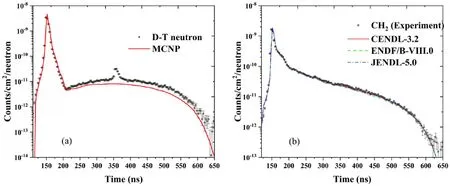
Fig.9 (Color online) a Comparison of the simulated and experimental results of the time-of-flight spectra of the neutron source.b Comparison of the simulated and experimental results for the polyethylene samples

Table 3 Comparison of the experimental measurements and simulations of the neutron sources
5.2 Measurement results of the polyethylene sample
To further ensure the reliability of the measurement system, measurements of the leakage neutron spectrum were obtained, and the simulation of a standard sample (polyethylene sphere) was performed.Data from the CENDL-3.2,ENDF/B-VIII.0, and JEDNL-5.0 libraries were used for the polyethylene material in the simulation; simulation and experimental results of the different libraries were obtained,as shown in Fig.9b.
By calculating the energy distribution of the emitted neutrons after their interaction with C and H nuclides, the spectrum of the leaking neutrons after the interaction of the 14 MeV neutrons with the polyethylene spheres can be approximately divided into three intervals:
(1) The elastic scattering interval (120–200 ns, depending on the pulse width of the source neutron) primarily includes C and H elastic scattering.The minimum energy of a neutron emitted by the elastic scattering of C is approximately 10.5 MeV (180°).
(2) The vast majority of the H elastic scattering interval(200–250 ns) is owing to H elastic scattering.
(3) The low-energy neutron interval includes inelastic scattering from C, the C reaction (n, n'3α), elastic scattering from H, and multiple scatterings.
Table 4 lists the integral values of the experimental results for each interval, the integral values of the simulation results for different libraries, and theC/Evalues.
The cross-section of the hydrogen elastic scattering was used as the standard.A comparison of the results shown in the preceding table indicates that the deviation of the C/E values of CENDL-3.2 library and JENDL-5.0 in the H elastic scattering interval is within 3%, and the deviation of the simulation result from ENDF/B-VIII.0 is less than 1%, confirming the reliability of the measurement system.Notably,the simulation results obtained by using the ENDF/B-VIII.0 library in the low-energy neutron interval are significantly underestimated by approximately 9% when compared to the experimental results, which is primarily because the neutronenergy spectrum of the (n, n'3α) reaction of C obtained by the ENDF/B-VIII.0 library is significantly lower than that of the other libraries.

Table 4 Measurement results of the polyethylene sample
5.3 Measurement results of the Fe sample
The time-of-flight spectra of the leaking neutrons from the deuterium–tritium pulsed neutrons interacting with the spherical Fe samples of three different thicknesses (4.5, 7.5,and 12 cm) were measured using the time-of-flight method.The MCNP program was used to calculate the simulated results of the leaking neutron spectra of the spherical Fe samples using the following three libraries: CENDL-3.2,ENDF/B-VIII, and JEDNL-5.0.Figure 10 presents a comparison of the experimental and simulated results.
The 14 MeV neutrons interacted with the natural iron sample through four main reaction channels: elastic scattering (n, el), discrete energy-level inelastic scattering (n,inl)D, continuous energy-level inelastic scattering (n, inl)C, and (n, 2n) reactions.The NDPlot software can be used to draw the secondary neutron energy spectrum of a natural iron sample incident with the 14 MeV neutrons, as shown in Fig.11.By combining the pulse time widths that were experimentally obtained, the time-of-flight spectrum of the outgoing neutron was divided into four intervals based on the energy intervals of the different reaction channels, as listed in Table 5.
According to Fig.11, the entire experimental energy spectrum is divided into the following four intervals: 12.5–16 MeV indicates elastic scattering (n,el),8.5–12.5 MeV indicates discrete energy-level inelastic scattering (n,inl)D, 2.4–8.5 MeV indicates continuous energy-level inelastic scattering (n,inl)C, and 0.8–2.4 MeV indicates the (n,2n) reaction.
The experimental and simulated spectra were integrated according to the aforementioned energy intervals; the experimental integrated values, simulated integrated values, C/E values, and neutron penetration rates with different thicknesses were obtained for each interval, as listed in Table 6.
The following can be concluded based on the results shown in Tables 6 and 7:
(1) The neutron penetration rate in the 0.8–16 MeV interval slightly exceeds 1 at a thickness of 4.5 cm, as shown in Table 6.This is because the thickness is relatively small, the neutrons have not decelerated to below 0.8 MeV, and the neutrons present a certain proliferation owing to the (n,2n) reaction.As the thickness of the sample increases, the neutrons constantly decelerate, and the neutrons below 0.8 MeV become more abundant, while the neutrons in the 0.8–16 MeV interval continue to decrease, as well as the penetration.
(2) The neutron scattering interval ranges between 4 and 16 MeV, which includes elastic scattering, discrete energy-level inelastic scattering, and continuous energy-level inelastic scattering.Because the leaking neutrons in this part of the interval are primarily affected by the cross-section of the scattering neutrons,the transmittance exhibits an exponentially decaying trend.The exponential decay law satisfied by the penetration rate should bey=e-Ax, whereyis the penetration rate andxis the thickness of the Fe sample.The fitting results using the experimental data in Table 6 are shown in Fig.12.According to the results, the fitting parameterAis 0.15495 for the elastic scattering energy region and 0.08423 for the energy region between 2.4 and 16 MeV.

Fig.10 (Color online) Comparison of the simulated and experimental results of iron spheres with varying thicknesses: a 4.5 cm, b 7.5 cm,and c 12 cm
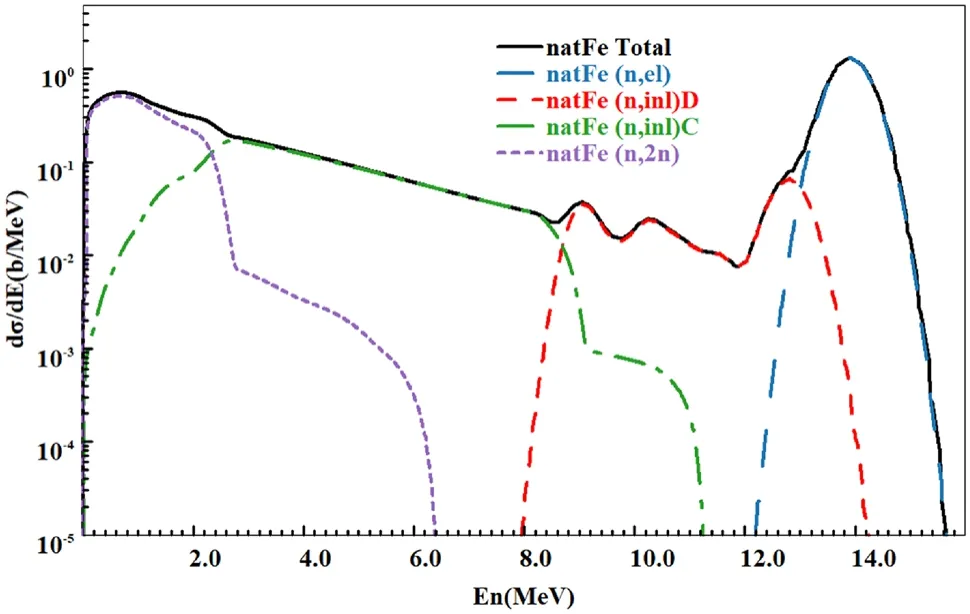
Fig.11 (Color online) Secondary neutron energy spectrum of the natural iron samples at the 14 MeV neutron incidence given by the CENDL-3.2 library

Table 5 The energy interval corresponding to each reaction channel
(3) The variation in theC/Evalues of the 0.8–16 MeV neutrons with different spherical iron thicknesses using the various libraries is shown in Fig.13.The total crosssection provided by the CENDL-3.2 library is apparently slightly larger, and that provided by the ENDF/B-VIII.0 library is smaller; this deviation increases as the thickness increases.The simulation results of the JENDL-5.0 database are in sufficient agreement with the experimental results, and the overall deviation can be controlled within 3%.
(4) Fig.3 and Table 6 demonstrate that when the thickness increases from 4.5 cm to 12.5 cm, the leakage neutrons in the elastic scattering interval gradually decrease.When the thickness is increased from 4.5 to 7.5 cm, the leakage neutron count in the inelastic scattering interval significantly reduces; however, when the thickness is increased from 7.5 to 12 cm, it does not significantly change.This is owing to the fact that the amount of leakage neutrons in the inelastic scattering interval increases as the high-energy neutrons decelerate and decreases when the thickness increases; the change in the neutron count as the thickness changes is a result of both effects.These two effects also apply to the counting law for leaking neutrons in the (n,2n)interval.Moreover, only neutrons with energies greater than 0.8 MeV are measured in this experiment, thus,a large fraction of neutrons are decelerated to below 0.8 MeV and are not included in the count.The overall trend of the leakage neutron counts in the (n,2n)interval decreased and then increased as the thickness increased.
(5) TheC/Evalues obtained by these three libraries gradually decreased as the thickness increased, whereas theC/Evalues for the discrete energy-level inelastic scattering intervals gradually increased.This suggests that the cross-sections of the inelastic scattering for the data from all three libraries may be slightly larger, and the cross-sections of the elastic scattering are slightly smaller.
(6) The simulated values of the inelastic scattering interval at the continuum energy level for both the JENDL-5.0 and ENDF/B-VIII.0 libraries were approximately 10% lower than the experimental values for all three thicknesses.This indicates that the cross-sections of the inelastic scattering at the continuum energy level are small, which are given by the JENDL-5.0 and ENDF/B-VIII.0 libraries for the 14.5 MeV incident neutron natural iron samples.As shown in Fig.14, the energy spectrum of the secondary neutrons given by the ENDF/B-VIII.0 library is larger between 0 and 3 MeV but smaller between 3 and 8 MeV, which may be the reason for the underestimation of the simulation results using the ENDF/B-VIII.0 library in this interval.The simulation results of the CENDL-3.2 library exhibited different degrees of bias in the simulated values in the(n,2n) interval.
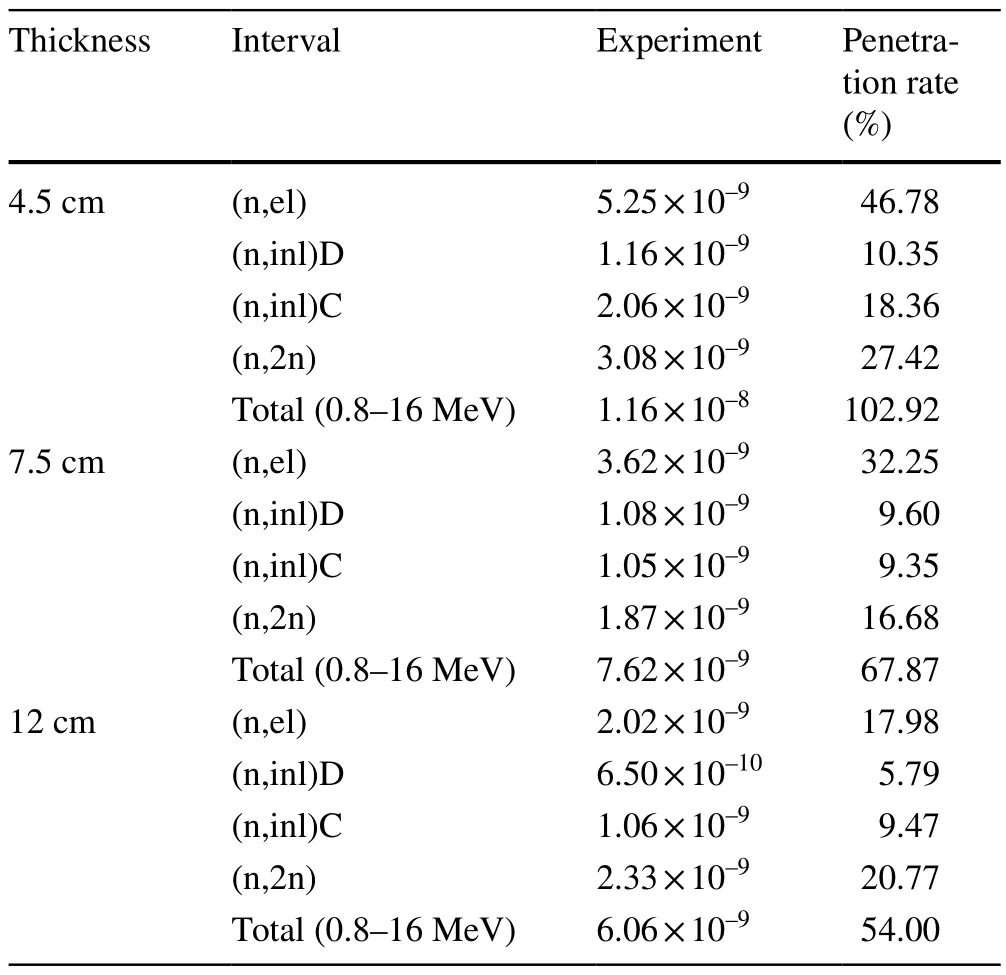
Table 6 C/E values and penetration rates of the iron spheres with different thicknesses
6 Summary
In this study, an integration experiment of a sphere Fe shield was conducted using a D–T pulsed neutron source at theChina Institute of Atomic Energy.The leakage neutron spectra of Fe spheres with thicknesses of 4.5, 7.5, and 12 cm were measured using the time-of-flight method.To test the reliability of the iron data in the CENDL-3.2, ENDF/BVII.0, and JENDL-5.0 libraries, the time-of-flight spectra were simulated using the MCNP-4C code.In the simulation,in addition to the physical model, the detector efficiency,energy and angular distributions of the neutron source, and pulse neutron time distributions are fully considered, such that the time-of-flight spectrum demonstrates an improved fine structure, which will help compare the time-of-flight spectra for short time intervals.The entire time-of-flight spectrum was divided into four intervals: elastic scattering(n, el), discrete energy-level inelastic scattering (n, inl)D,continuous energy-level inelastic scattering (n, inl)C, and(n, 2n) reaction intervals.Subsequently, the simulation and experimental results at different intervals were compared to verify the data for the different reaction channels.
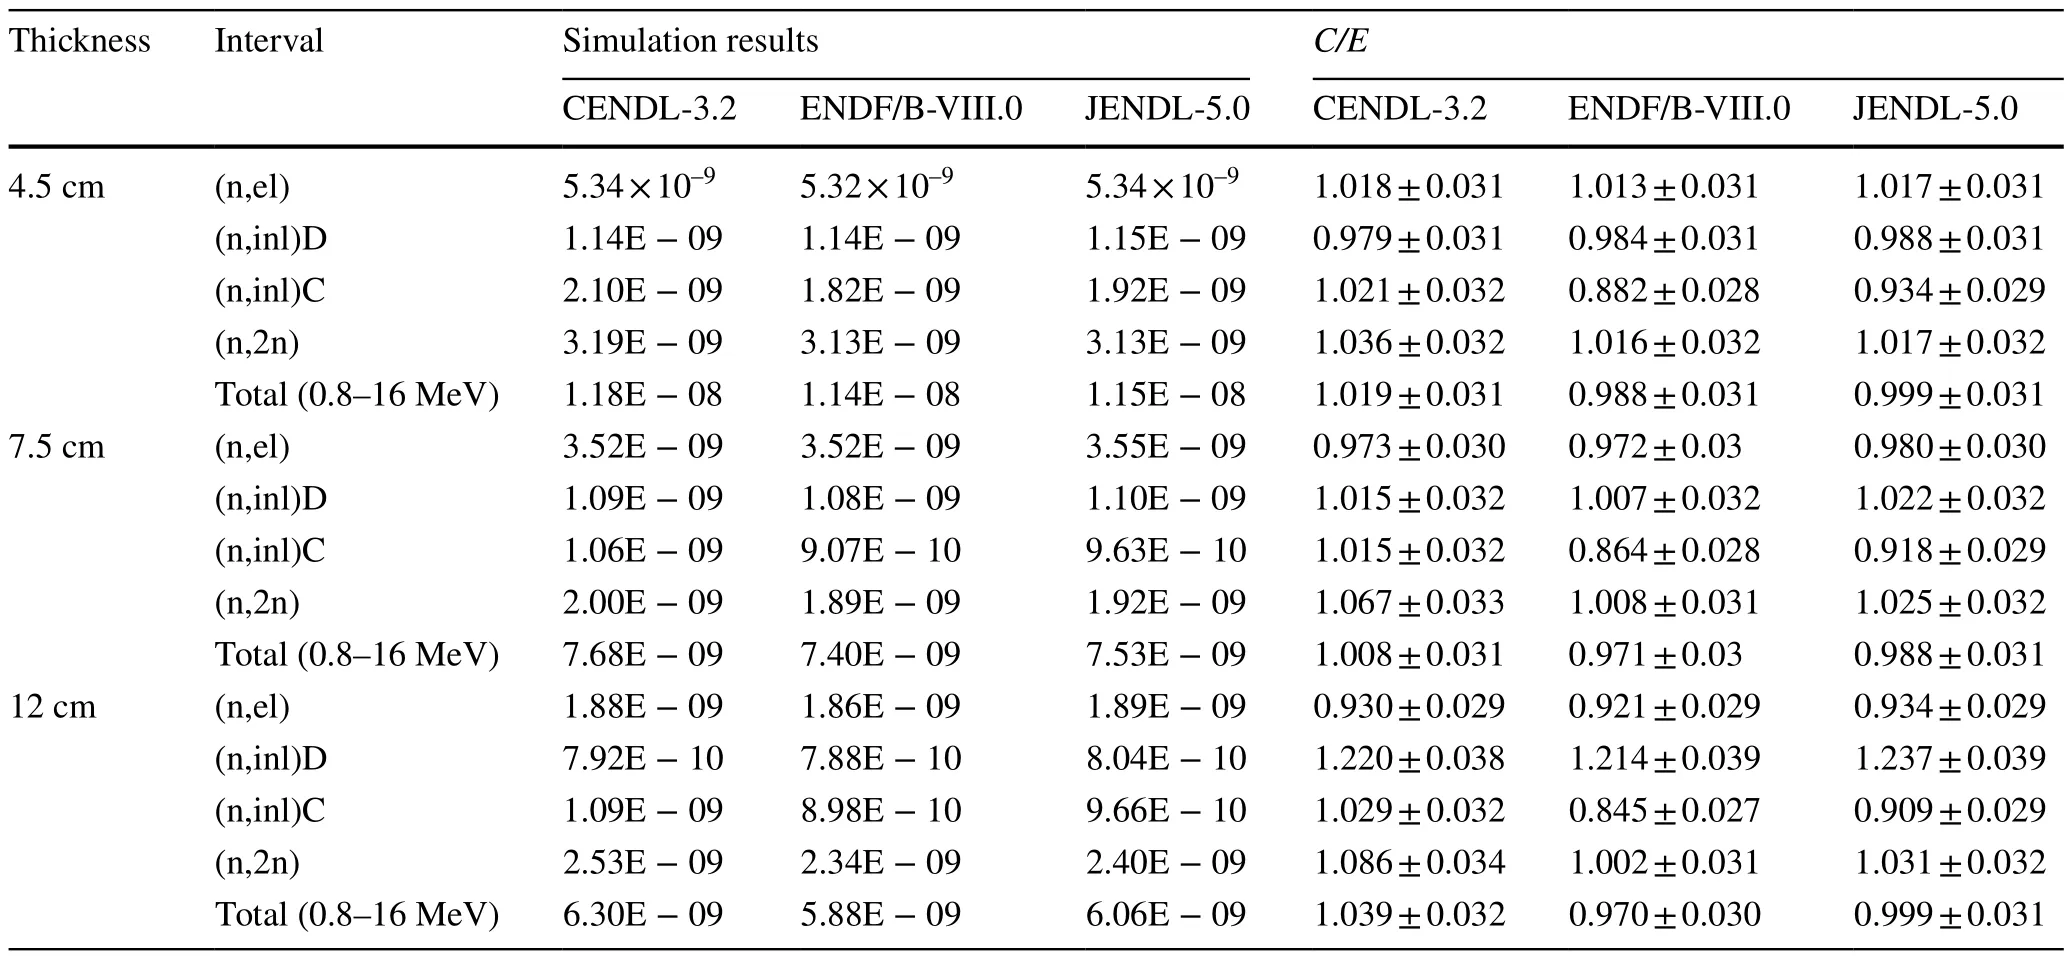
Table 7 C/E values of the different thicknesses
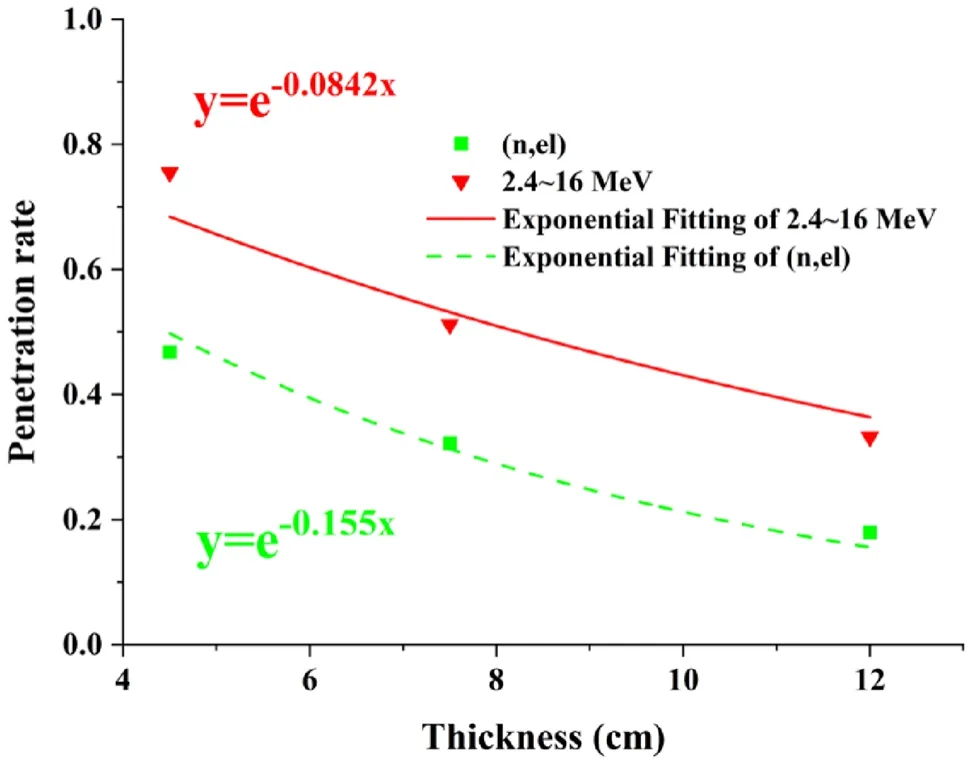
Fig.12 Trend of the neutron penetration rate in different energy regions with varying thicknesses of the spherical iron

Fig.13 The C/E value trends with varying iron thicknesses in the interval between 0.8 and 16 MeV
According to the comparison results, the following conclusions can be drawn: (1) The simulation results of the CENDL-3.2 library are in the best agreement with the experimental results.(2) The simulations from the JEDNL-5.0 library were approximately 8% lower in the continuum energy-level inelastic scattering interval, whereas the simulations from the ENDF/B-VIII.0 library were approximately 10% lower.This may be owing to the fact that the ENDF/B-VIII.0 and JENDL-5.0 libraries underestimate the energy spectrum of the secondary neutrons of the high energy part of the continuum energy-level inelastic scattering.
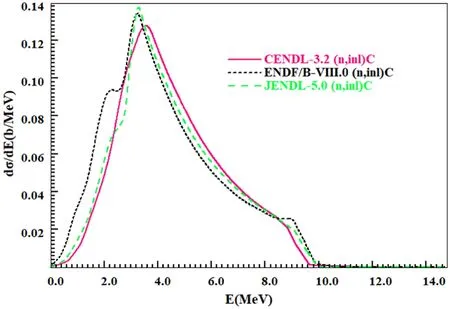
Fig.14 Secondary neutron spectrum of the inelastic scattering at the continuum energy level produced by 14 MeV incident neutrons on natural Fe
Acknowledgements The authors would like to thank the Cockcroft-Walton accelerator group for their excellent operation of the D–T neutron source in the CIAE.
Author contributions All authors contributed to the study conception and design.Material preparation, data collection and analysis were performed by Qi Zhao, Yang-Bo Nie, Yan-Yan Ding, Shi-Yu Zhang,Jie Ren, Kuo-Zhi Xu, Xin-Yi Pan and Xi-Chao Ruan.The first draft of the manuscript was written by Qi Zhao and all authors commented on previous versions of the manuscript.All authors read and approved the final manuscript.
Data availability The data that support the findings of this study are openly available in Science Data Bank at https:// doi.org/ 10.57760/ scien cedb.11991 and https:// cstr.cn/ 31253.11.scien cedb.11991.
Declarations
Conflict of interest The authors declare that they have no competing interests.
杂志排行

Nuclear Science and Techniques的其它文章
- A machine learning approach to TCAD model calibration for MOSFET
- BL02U1: the relocated macromolecular crystallography beamline at the Shanghai Synchrotron Radiation Facility
- Coin-structured tunable beam shaping assembly design for accelerator-based boron neutron capture therapy for tumors at different depths and sizes
- Simulation study of BESIII with stitched CMOS pixel detector using ACTS
- Advances in nuclear detection and readout techniques
- Enhancing betavoltaic nuclear battery performance with 3D P+PNN+multi-groove structure via carrier evolution