Research on multi-factor stock selection model based on random forest algorithm
2024-01-04YANGMiaojieWANGCaifengWUChenhua
YANG Miaojie, WANG Caifeng, WU Chenhua
(School of Mathematics and Physics, University of Science and Technology Beijing,Beijing 100083, China)
Abstract:Although quantitative investment has been developed in recent decades, and strategies have also tended to diversify, various problems and bottlenecks have also come with it,such as data selection,much shorter valid period of the model in financial market.This paper builds a multi factor stock selection model based on the random forest algorithm. In the model, 12 factors were selected from 6 different dimensions to construct the factor pool, and the factor data was pre-processed. After determining the model parameters, based on the processed data, the prediction and operation strategy guidance for a single stock has achieved a considerable rate of return, which has laid the foundation for the construction of a portfolio below. In the construction of the portfolio, the stock pool we select is composed of CSI 300 constituent stocks that can better represent the Chinese stock market. Two years of data from 2013-01-01 to 2015-01-01 were selected, including 12 selected factors and the rise of stocks. In order to simulate the real situation as much as possible in the process of strategy writing, influencing factors such as slippage and handling fees were set. As a result, in the back test of the model, an annualized return rate of 25.5% was obtained. In addition, according to the importance and correlation analysis of features in the random forest algorithm, the factors and models were further improved. The annualized rate of return of the improved model was as high as 32.2%,and the excess return alpha reached 15.1%. These obtained higher sharpe ratio and lower retracement.
Keywords: multi-factor stock selection, quantitative investment, random forest,stock market, machine learning
1 Introduction
Predicting the performance of stock market is one of the most difficult things in the field of financial investment. In order to pursue this goal, investors and scholars have developed many methods. In recent years, with the development of machine learning,it has become a hot research field in stock forecasting for financial investment.
Reference [1] used machine learning to predict the information in social media and financial news, so as to classify the rise and fall of the stock market. This study provides a framework to use news and social media as external factors to predict the future development trend of the stock market, and also studies the influence of feature selection on the prediction performance of the algorithm, and finds that the reduction of features has a positive impact on the performance of the classifier. In addition, by comparing the accuracy of multiple machine learning classifiers, it is found that the accuracy of random forest classification is the highest.
In view of the characteristics of financial market volatility and non-linearity that are difficult to predict, it[2]adopted the technology of artificial neural network and random forest to use the financial data of stock as the input of the model to predict the closing price of stock. However, it is unable to show the changes of the stock market in a more comprehensive way.
In reference [3], they applied four machine learning algorithms: artificial neural network,support vector machine,naive Bayes and random forest. First,they input the trading data of stocks (opening price, closing price, highest price and lowest price) to calculate 10 technical parameters. Secondly, the technical parameters are transformed into trend determination data to predict the trend and stock index of Indian stock market, and the accuracy of each prediction model is evaluated. It is concluded that the overall performance of random forest is better than the other three prediction models, and when the technical parameters are transformed into trend determination data,the performance of all prediction models will be improved. The focus of this paper is short-term forecast, and the view of stock trend is relatively single, there are many categories to discuss. From above,this paper will focus on combining external factors with the internal factors to do long-term forecast, and consider building portfolio for back testing, that is, multi-factor stock selection[4-6].
2 Methodology
2.1 Multi-factor stock selection theory
Multi-factor stock selection is one of the most widely used methods in quantitative investment. The main idea is to take the stock or the various factors of the listed company represented by the stock as the factors that affect the stock return rate.Through various methods, we can select the stocks that meet the standards and the stocks that do not meet the standards. There are many categories of factors, roughly divided into fundamental factors and technical factors, while fundamental factors can be divided into macroeconomic fundamentals and corporate fundamentals. Technical factors include momentum factors, mixed factors, etc., which are mostly synthesized by stock price data. Choosing the right factor can get twice the result with half the effort for the performance of the model.
In the traditional multi-factor stock selection model, after the factor selection, the factor score is calculated by giving different weights to different factors, and then the stock screening results are obtained by sorting based on this, which is the so-called scoring method. In addition, there is regression method. The so-called regression method is to regress the historical return rate of stock and the selected factors to get the regression equation, and bring the new factor data into the regression equation, so as to predict the future return rate of stock, and then sort them to get the screening results [4-5,7].
Based on the above content,the construction process of multi-factor stock selection model can be divided into: factor determination →pre-processing →validity test→model establishment →model evaluation.
2.2 Random forest
As the name implies, the so-called random forest is to build up a forest through n decision trees in a random way. After the sample data is input, each decision tree will vote to judge and classify. Finally, the one with the most votes will be regarded as the final classification result.
Random forest[8-9] is an extension of bagging. It uses decision tree as the base classifier to build bagging, see Fig.1. In the process of training decision tree, random selection of features is introduced[10-12], which is also the reason why the performance of random forest[13-15] is superior.
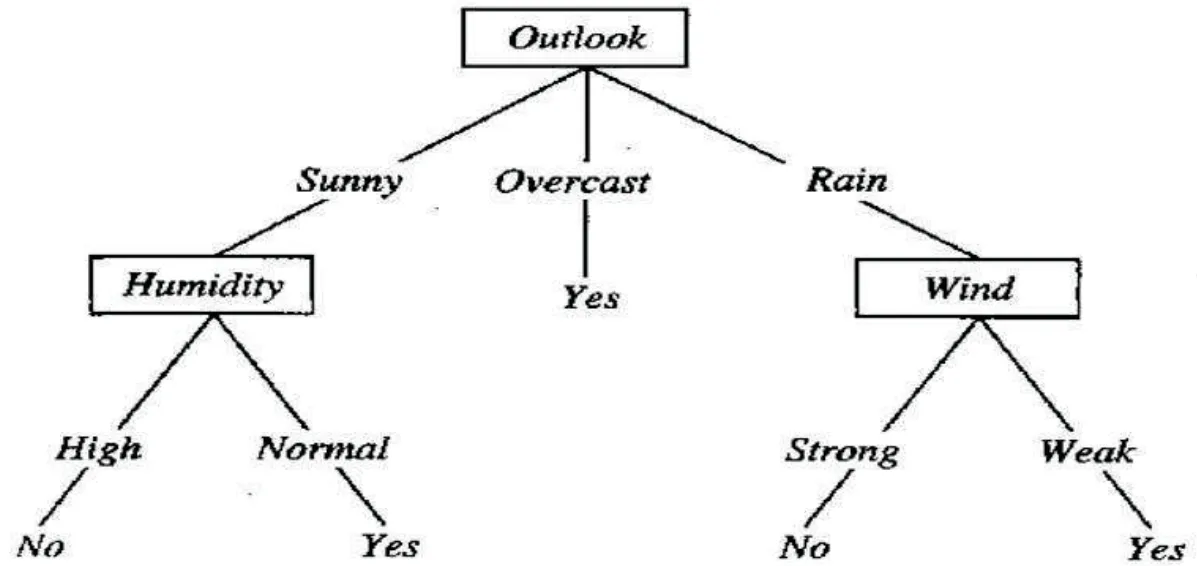
Fig. 1 Schematic diagram of Decision tree algorithm.
Decision tree is the structure of a tree. Each non leaf node represents the test of a feature, while the branch represents the output of the feature in a domain, and finally stores the category in the leaf node. It is a weak classifier. In order to get random forest, we need Bagging method, see Fig.2. It is a method of synthesizing multiple weak classifiers into one strong classifier. Its steps are generally as follows, see Fig.3.
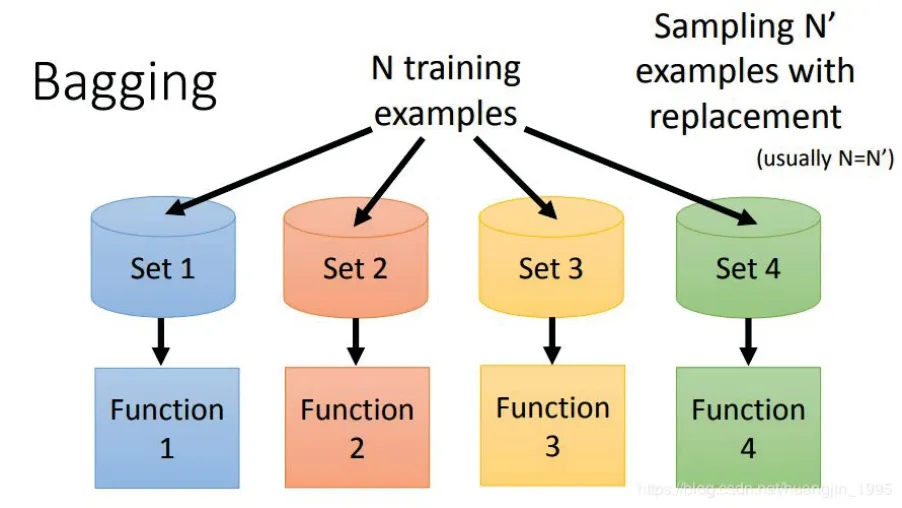
Fig. 2 Schematic diagram of Bagging algorithm.
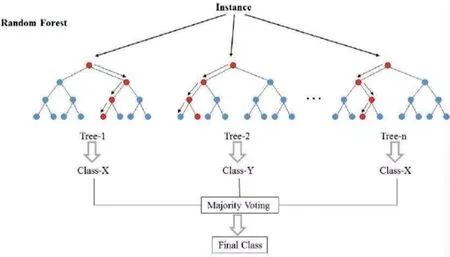
Fig. 3 Schematic diagram of Random forest algorithm.
(1) For a given set ofMsamples,msamples with return are sampled, and a training set containingmsamples is obtained. AfterNrounds, a total ofNtraining sets are obtained, and any two ofNtraining sets are independent.
(2) Each time we use a training set to get a model,Ntraining sets can get a total ofNbase classifiers.
(3)For the classification problem,the above-mentionedN-base classifiers are voted to get the classification results. And for the regression problem, the mean value of the above model is calculated as the final result.
3 Experimental process
3.1 Data acquisition and processing
The core of the multi-factor stock selection model based on the random forest algorithm is still the factors, so the choice of the factors largely determines the quality of a model. Referring to the research of other scholars, it is found that their choice of factors is mostly single. Therefore, this paper selects 12 factors with a wide range and wide coverage for research, as shown in Table 1. The data comes from Tonglian data,during the period from January 1, 2013 to January 1, 2015.
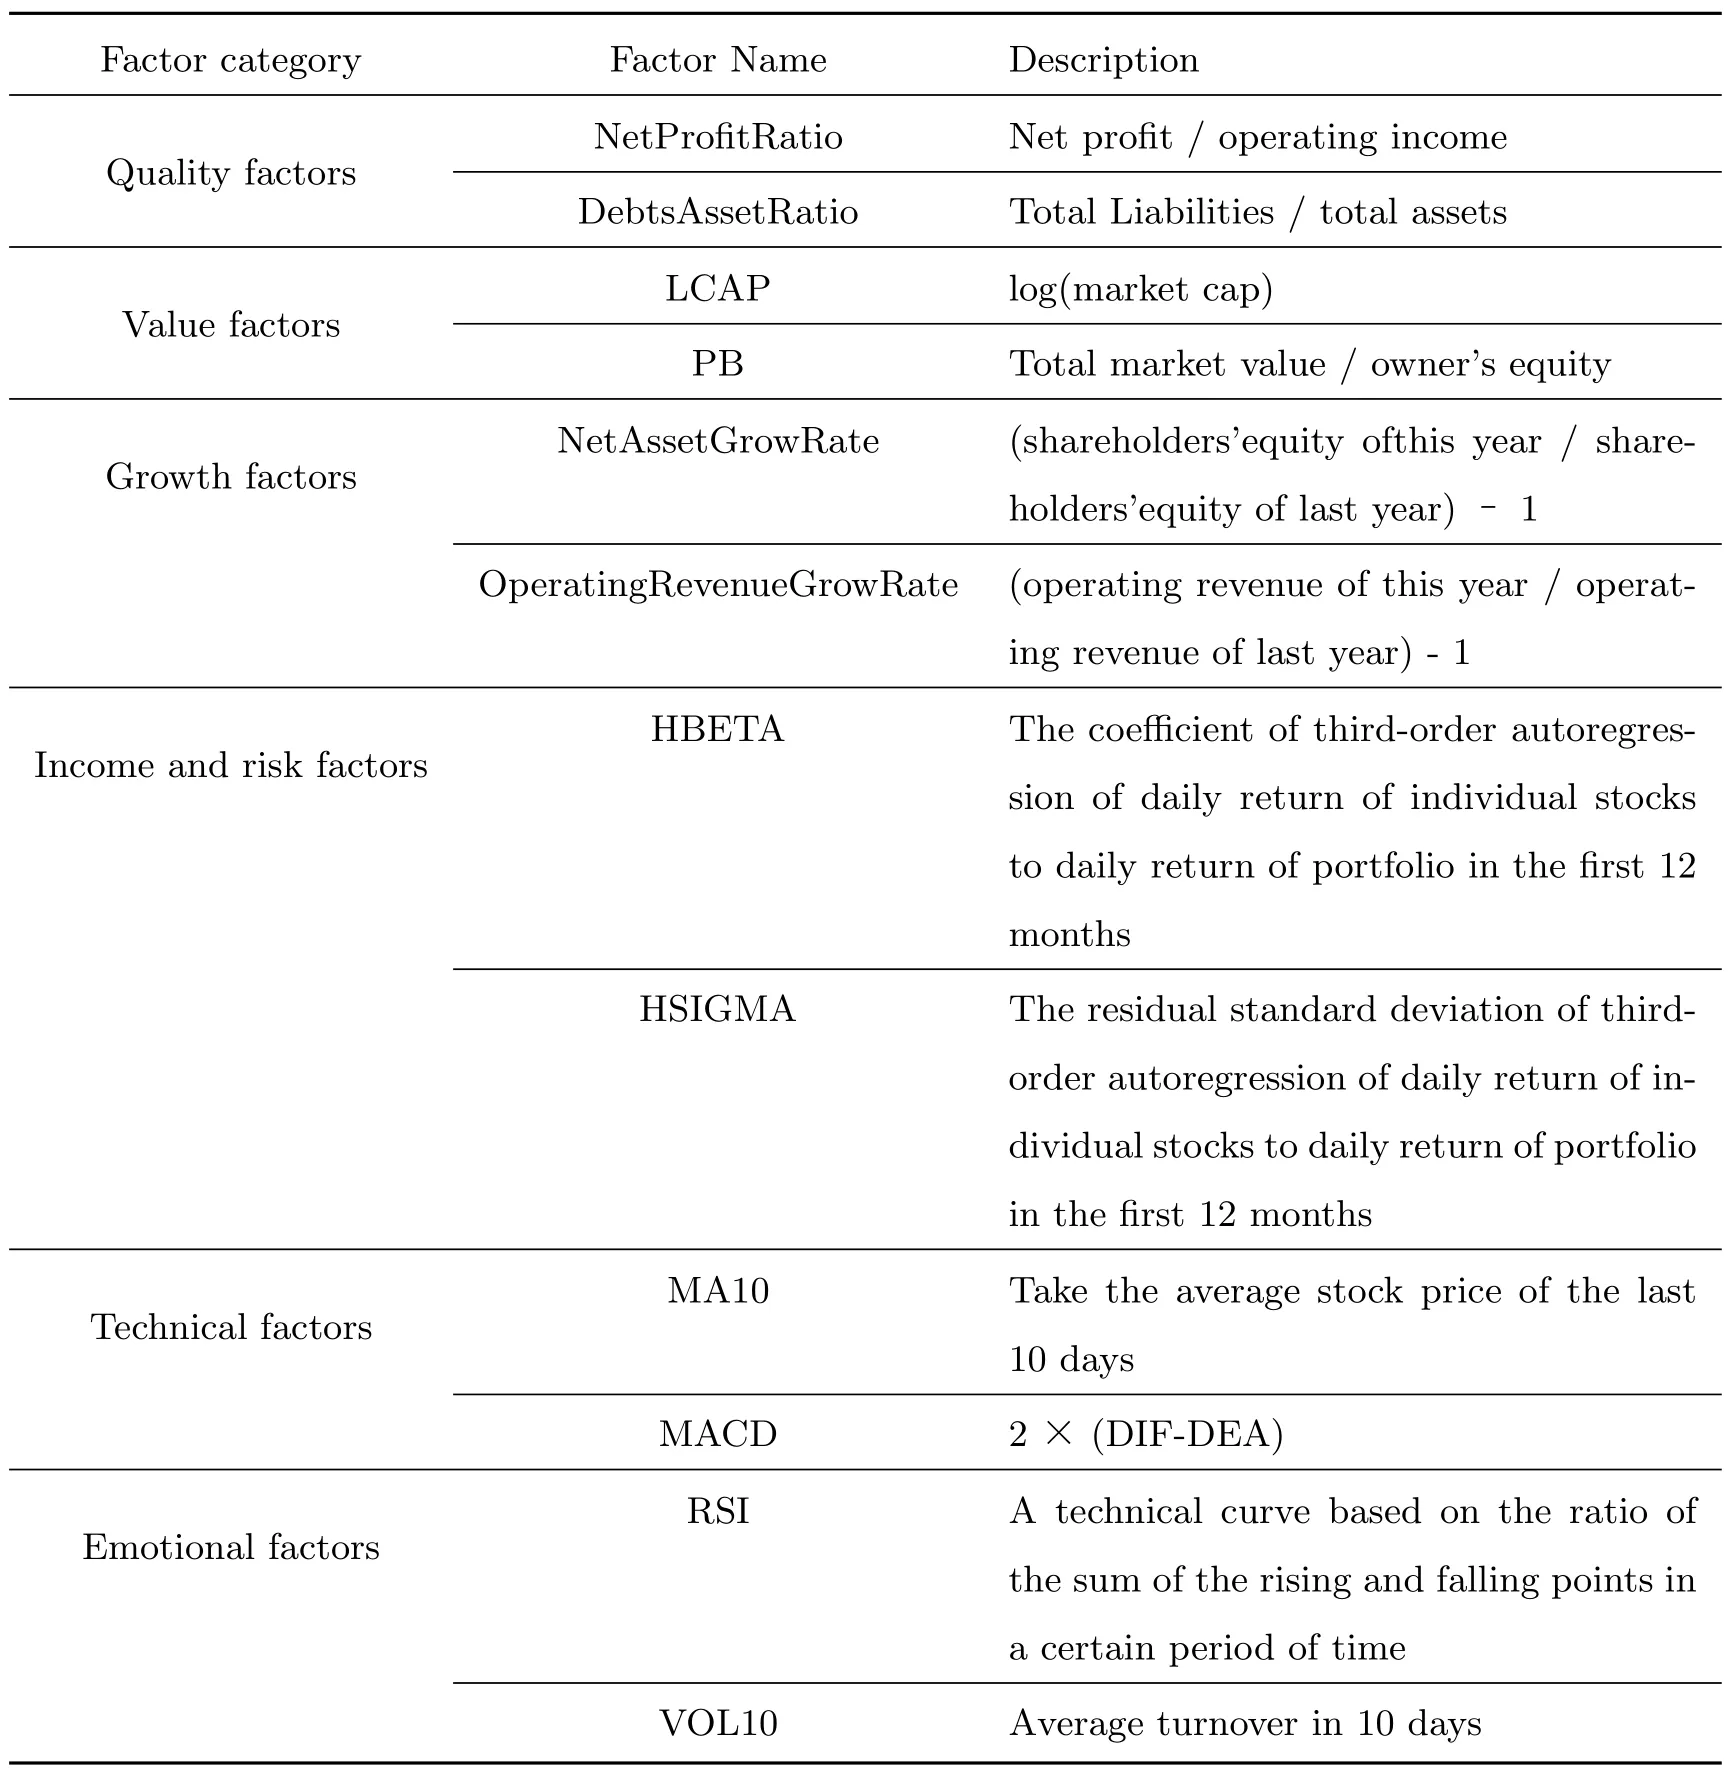
Table 1 There are 6 categories in the factor pool and 12 factors in total.
After the data is collected, 3Υ method is used to remove the extreme data and Z-score method is used to standardize the data,so as to make the model more accurate.
The operation of this paper is carried out through the function of sklearn Library in Python. There are two important parameters in random forest function: the number of decision trees(n-Estimators)and the maximum depth of the tree(max-depth). The optimal parameters determined by grid search are: n-estimators=50,max-depth=2.
3.2 Single stock forecast
The data sample with stock code of 300236 (Shanghai Xinyang) is selected for the experiment, and its characteristic factors are processed. The label represents the up and down with 1 and - 1 instead. The data set is divided into training set and test set with the proportion of 3:1, and 10-fold cross validation is set. When we get the forecast results of the rise and fall,on this basis,we decide to buy or sell the stock,and calculate the yield. The results are as follows, shown in Fig.4, Fig.5 and Fig.6.
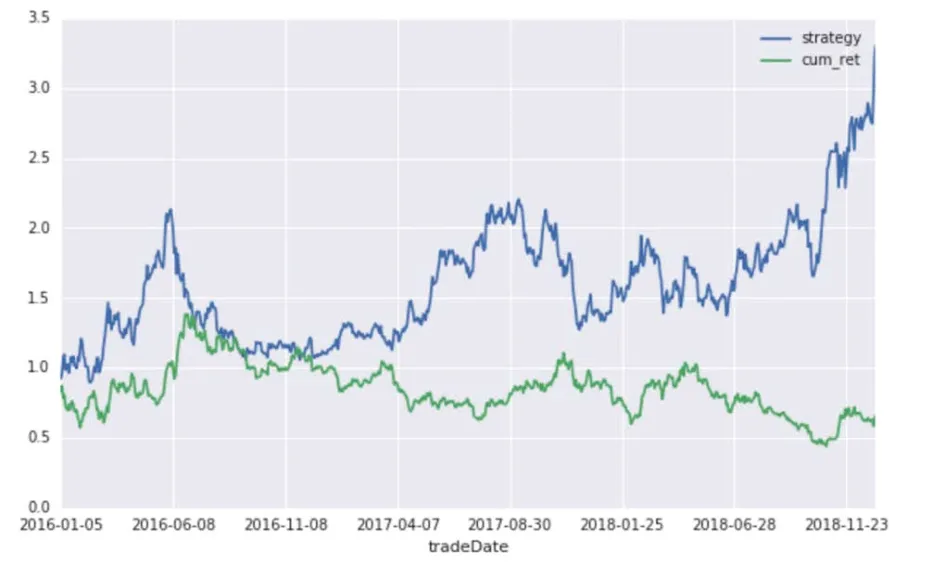
Fig. 4 The results on the training set show that the strategic return is higher than the long-term return, x axis represents time, y axis represents yield.
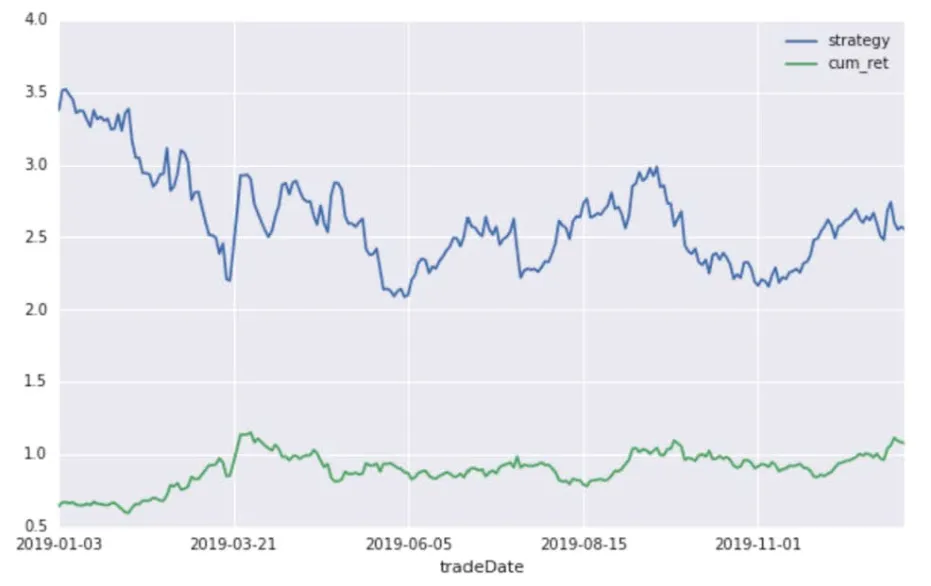
Fig. 5 The results on the test set show that the strategic return is higher than the long-term return, x axis represents time, y axis represents yield.
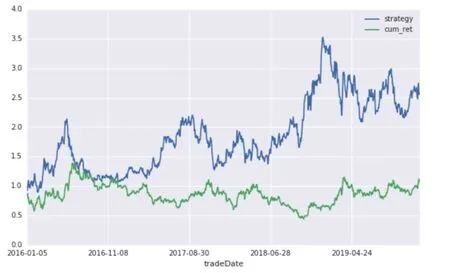
Fig. 6 This is the result on the whole data set, which shows the excellent prediction ability of random forest, x axis represents time, y axis represents yield.
We find that the yield of investment based on the prediction results of stochastic forest algorithm is significantly higher than that of long-term holding,which shows that stochastic forest algorithm has certain effect on prediction.
3.3 Establishing a multi-factor stock selection model
In the traditional multi-factor model,the stock is graded by factor value weighting,and the corresponding portfolio is constructed and tested back according to the scoring results. In the random forest stock selection model, the main difference is to use the random forest algorithm instead of the scoring method. According to the above, in the multi-factor stock selection model, the random forest is to predict the stock return by regression,and to build the portfolio by ranking the predicted return(the top 20 stocks are selected in this paper).
According to this principle, this paper takes the Shanghai and Shenzhen 300 constituent stocks as the stock pool, 12 factors selected previously as the factor pool, the backtesting date is from January 1, 2013 to January 1, 2015 for two years, and takes the Shanghai and Shenzhen 300 index as the benchmark for backtesting. In order to present the most real situation, this strategy also sets the handling fees and sliding points, and adjusts the positions in a month cycle, the results of model back testing are shown in Table 2 and Fig.7.
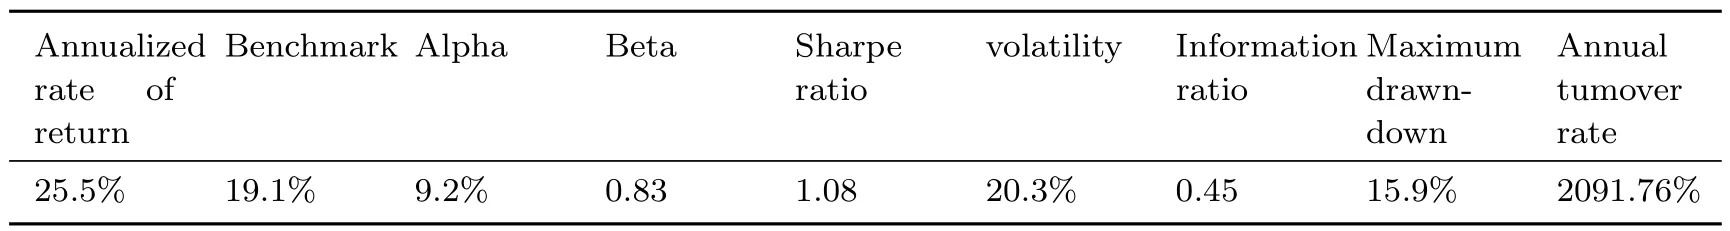
Table 2 Results of model back testing,including annualized return,sharp ratio,etc.
In the multi-factor model, the most influential factor is the factor. This paper selects the factors at random and does not consider the correlation between them.Thus, there may be multiple collinearity between factors, and some of them may have little effect on the model. Therefore, this paper studies the correlation and importance of factors with the help of the function of Sklearn library to improve the model.

Fig. 7 The return of the strategy is significantly higher than the benchmark, and the indicators, such as sharp ratio, are more prominent.
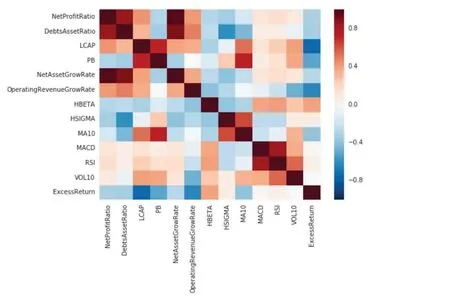
Fig. 8 Thermodynamic diagram of correlation between various factors, the darker the color, the more relevant it is.
As shown in Fig.8 and Fig.9, it is found that there is a large correlation between some factors, such as netprofitratio and debtsassetsratio, LACP and Pb, etc., and among all the factors, LACP, Pb, Hbeta, MACD, RSI and other factors have a high contribution to excess return. Combined with these characteristics,the improved model retains four factors, namely, LACP, Hbeta, RSI, MACD, to test the model back. After that, the results are shown in Table 3.
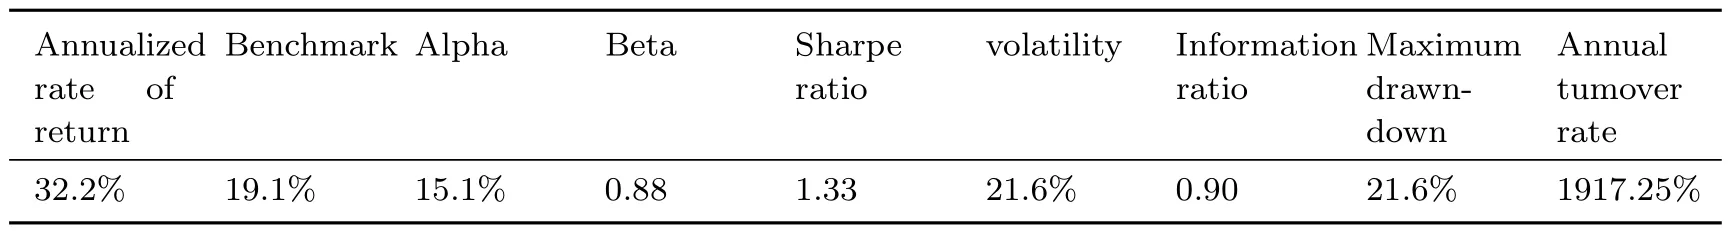
Table 3 Results of improved model back testing, including annualized return, sharp ratio, etc.
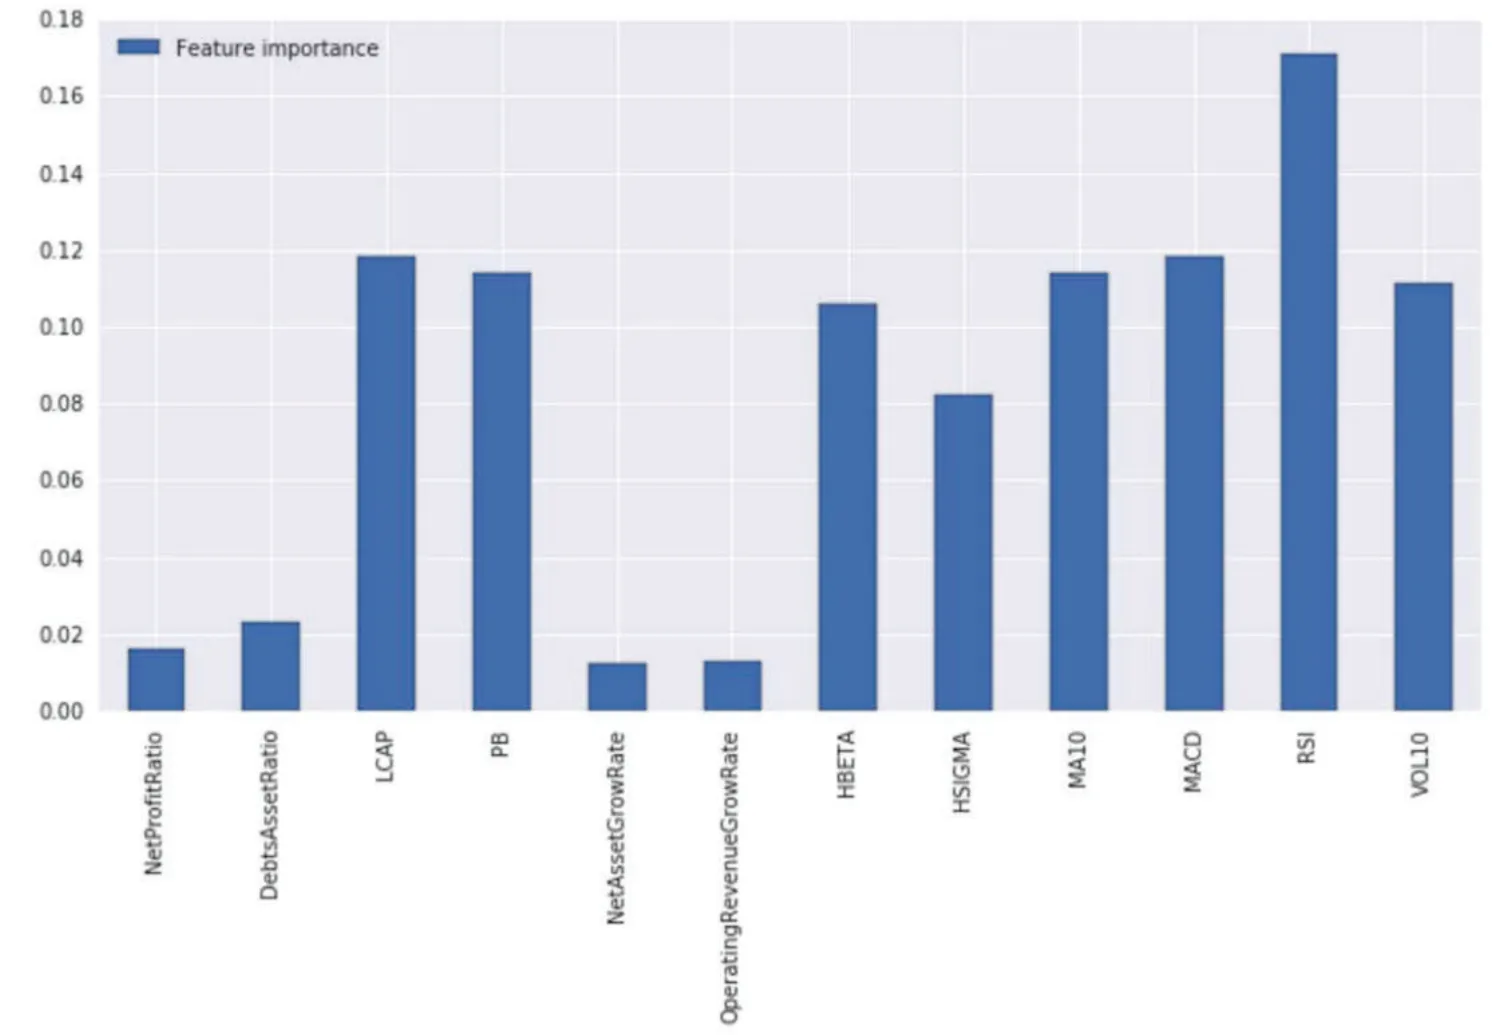
Fig. 9 Importance of factors, the y-axis represents the importance, and the larger the value is, the more important it is.
It can be seen from Fig.10 that compared with the original model,the annual yield,alpha,Sharpe ratio and information ratio of the improved model have been significantly improved.
3.4 Test and evaluation of the model
For a traditional multi-factor model, the focus of the study is its effectiveness. In the stock selection model based on random forest, the same study should be carried out. In addition, random forest is one of the machine learning algorithms. Generally,the model accuracy and ROC curve are used to evaluate the machine learning model.
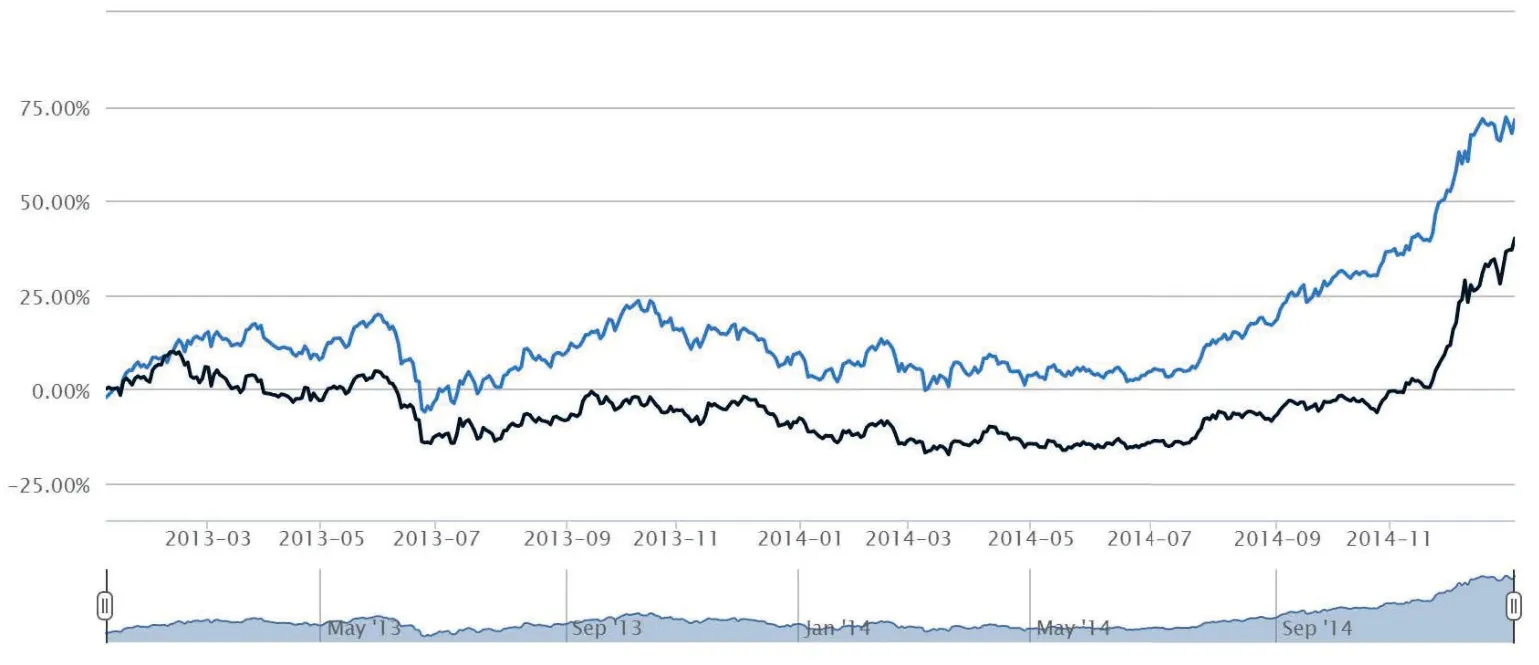
Fig. 10 After filtering the factors, we can see that the return rate of backtesting is higher than that of the previous model, and some indicators are better.
For the validity test of multi-factor model, the method of layered backtesting is generally adopted. Its principle is to treat all factors as a “composite” factor, and then divide the stocks sorted by random forest into n groups on average, and backtest each group. Theoretically, the best situation is that the return rate of each group decreases in turn,but in the actual operation,it is often unable to achieve such a state. Therefore,generally speaking, as long as there is a significant difference between the former group and the latter group, the model is considered to be effective.
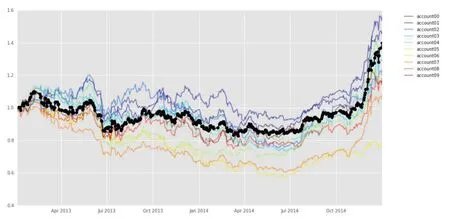
Fig. 11 After sorting the stocks into 10 groups, the return curve of each group has the same trend, but the return rate has obvious difference. The x axis represents time, y axis represents return.
According to this principle, the sorted stocks are divided into 10 groups, and each group is retested to observe its return, as shown in Fig.11. It can be seen from Fig.12 that there is a significant difference in the rate of return between the groups, and the first two groups have significantly higher returns than the latter two groups, so the model is considered effective.
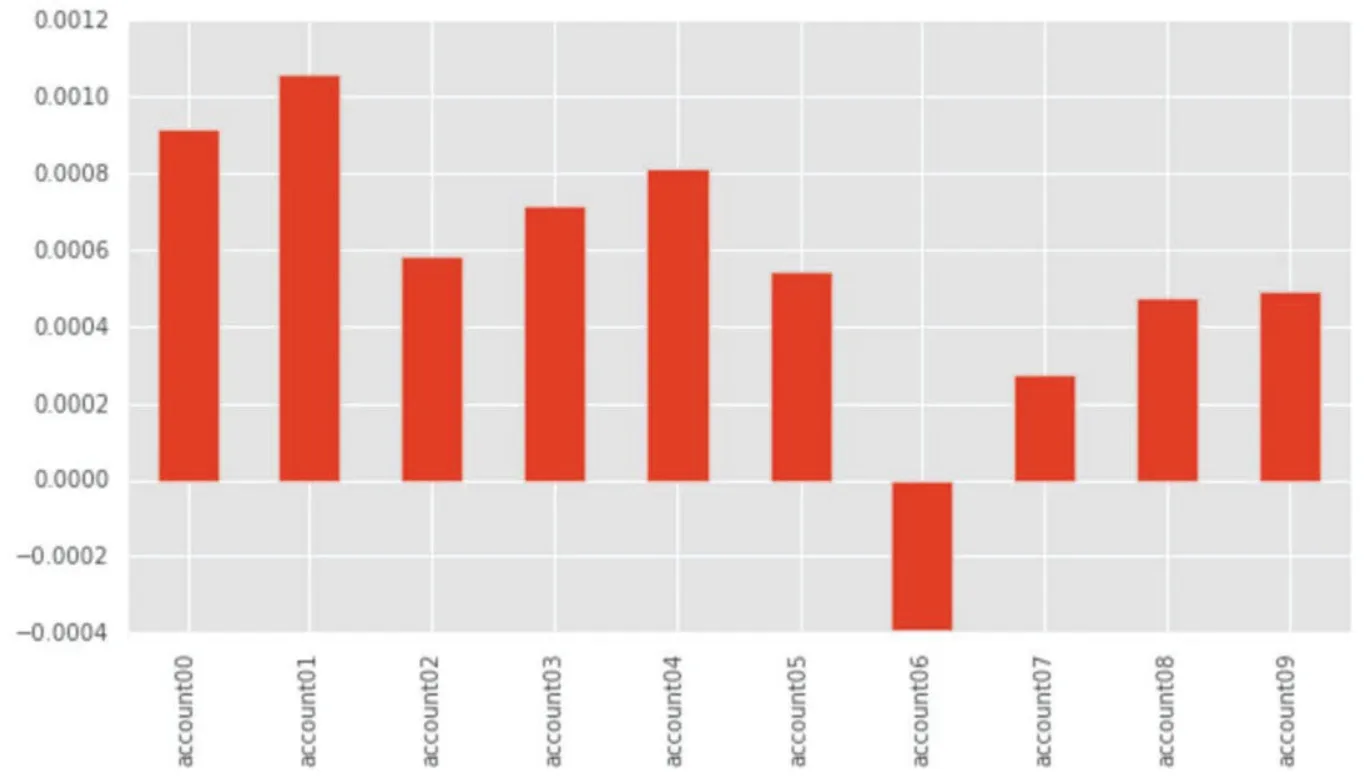
Fig. 12 More specifically, the average return of each group of stocks, the first three groups, especially the first two groups, are significantly higher than the latter one. The x axis represents time, y axis represents average return.

Fig. 13 The x axis represents time, y axis represents accuracy, and the accuracy curve finally tends to about 57%.
Model accuracy and ROC curve are common indexes for evaluating machine learning algorithm. For example, model. The accuracy of the model calculated based on this is shown in Fig.13. It can be seen that it fluctuates up and down 55%,and the accuracy greater than 50% indicates that the model has certain application value. And the ROC curve of an excellent classification model should be as close to the upper left corner of the square of unit area as possible. AUC value refers to the area under the ROC curve. The larger the AUC value is, the better the effect of the classifier is. The ROC curve is drawn as shown in Fig.14. The AUC value =0.565 > 0.5. According to the practical experience, when AUC > 0.5, the model has application value.
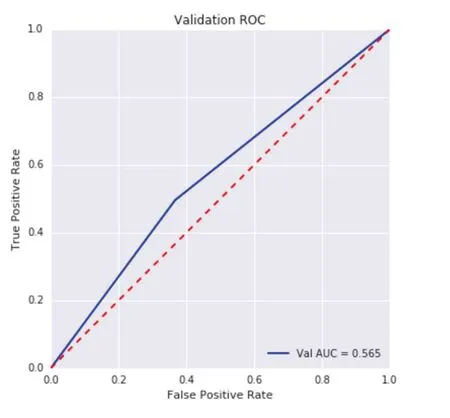
Fig. 14 The x axis represents time, y axis represents accuracy, and the accuracy curve finally tends to about 57%.
4 Conclusion
In this paper, the random forest algorithm in machine learning is introduced into the traditional multi-factor model, and the stock selection strategy in Shanghai and Shenzhen 300 stocks is established. The effectiveness of the multi-factor stock selection model based on the random forest algorithm in A-share market is proved, and the following conclusions are obtained: first,the random forest algorithm has better prediction ability. In the multi-factor model,the accuracy of random forest fluctuates up and down at 55%, AUC value is 0.565, which shows a certain prediction effect. Secondly,in the model established in this paper, the annual yield of 25.5% is obtained without factor improvement, and the annual yield of 32.2% is obtained after factor improvement, which is far higher than the benchmark yield, which shows that the investment strategy has strong practicability and value.
Of course, limited to the level and time limit of the authors, this paper also has many shortcomings. In the optimization of parameters, only two main parameters are optimized by grid search method, and the optimization of parameters is one-time,there is no dynamic adjustment for the dynamic stock market. However, the selection of factor pool is subjective, and the random forest algorithm can′t select the features.In this paper, the factors are mainly focused on the internal factors of stocks, and the external factors are not considered enough. In addition, there are many algorithms for machine learning. This paper is limited to the space and time, and only tries to use random forest algorithm, but fails to use a variety of algorithms for horizontal comparison.
