NDVI characteristics and precipitation sensitivity of urban agglomeration in Central Shanxi Basin
2023-12-19WANGYuefeiLIUHailongFUJieLIYangjunBAIXinqiangTIANQingchun
WANG Yue-fei ,LIU Hai-long , ,FU Jie ,LI Yang-jun ,BAI Xin-qiang TIAN Qing-chun
1 The Institute of Shanxi Architectural Design and Research Co.,Ltd,Taiyuan 030000,CHINA
2 School of Geography and Environmental Science,Shanxi Normal University,Taiyuan 030000,CHINA
Abstract: The overall NDVI characteristics and precipitation sensitivity in the study area from 2000 to 2018 were investigated using NDVI images of urban agglomeration in central Shanxi basin in 2000,2005,2010,and 2018 as well as the climate data of China's surface cumulative annual value data set (1981-2010) in accordance with the method such as the geographically weighted regression model.As can be seen from the results,first,the overall NDVI pattern of urban agglomeration in central Shanxi basin,China has been changed and distributed along the topography in the shape of strip.Second,the spatial evolution of NDVI in the study area is varied significantly with the trend of expansion as a whole and a shrinking trend in some areas.Third,the overall precipitation in the study area presents a declining trend from the west to the east,while the NDVI precipitation sensitivity shows a decreasing trend from west to east.To be specific,the west and the east have a positive value of 1.3129 with strong sensitivity and a negative value of -1.0908 with weak sensitivity,respectively.The study results are expected to provide a scientific basis for restoring vegetation and formulating disaster prevention policies for urban agglomeration in Central Shanxi Basin.
Key words: NDVI;precipitation sensitivity;urban agglomeration
1 Introduction
NDVI(Normalized Difference Vegetation Index)is a normalized vegetation index that can present the development trend of ecological space through monitoring changes in vegetation growth status,vegetation coverage,and vegetation productivity(Gamon et al.,2013;Li et al.,2017).Ecosystem functions degrading has been accelerated due to problems such as destruction of ecological functions,deterioration of the ecological environment,and endangerment of biodiversity resulted from the unreasonable occupation of ecological space by human activities and the plunder as well as the damage of ecological space resources by economic development.As the construction of ecological civilization is deepened,the national government has clearly raised the strategy of “intensive and efficient production space,appropriate living space,and beautiful ecological space”as well as indicated that the establishment of a land space development and protection system is to solve the problems such as occupation of high-quality farmland and ecological space,ecological destruction,and environmental pollution caused by disorderly development,over-development,and decentralized development through theIntegratedReform PlanforPromotingEcologicalProgress.It marks that China is on the way to protecting ecological balance via the reasonable planning of ecological space.Urban agglomerations are currently positioned as an important economic unit to drive new urbanization in China (Fang et al.,2018).But at the same time,the ecological land contradiction between vegetation restoration and returning farmland to forests has been intensified under the rapid development of urban agglomerations.As a result,some new problems including the uneven distribution of population,resources,environment,and economy,unbalanced social and economic development as well as imbalanced ecological protection have been generated.In response to the above problem,it is of great urgency to study the sustainable development of ecological space in urban agglomerations.
Foreign researchers analyzed the ecological causes of population changes in major urban agglomerations (Bochkareva,1983).Data on city clustering,population,and changes in land-use types were collected based on satellite remote sensing image sequence,aiming to link the environmental degradation of urban agglomerations with population growth,migration,and urbanization (Poyil and Misra,2015).Regional heat supply technologies of urban agglomerations were studied to promote economic growth and environmental protection (Dominik et al.,2020).The formation and correlation of urban agglomeration in the Black Sea area were analyzed(Azhaman et al.,2021).Contributions of urban and suburban green space systems to the ecosystem and human health were discussed (Konstantinos et al.,2007).The ACRM algorithm was used to improve NDVI accuracy using Landsat-8 optical remote sensing data(Cesar et al.,2019).The NDVI values captured by satellites were used to study the ecological changes in peatland vegetation as a response to the concern over climate warming (McPartland et al.,2019).NDVI spatiotemporal sequences were developed based on chamaephyte climate (Padhee,2019) and were used to identify and recognize the forest plant communities (Pesaresi et al.,2020).Quantitative NDVI analysis was conducted on the growth of island plantations in environmental changes (Herrera et al.,2021).The relationship between climate features and ecological development was studied(Darius et al.,2020;Deniz et al.,2019;Jha et al.,2019).Geographically weighted regression was conducted to analyze regional environments and climate features (Dheera,2017;Narayan et al.,2022;Shetty et al.,2021;Naikoo et al.,2022).
Chinese researchers studied urban agglomerations from the perspective of the ecological environment (Qi et al.,2018;Hu et al.,2019;Wang et al.,2020;Liu et al.,2022).The ecological space monitoring and ecological safety evaluation of Qingdao were made via remote sensing(Li et al.,2020).Chinese scholars generally explored the relationship between vegetation conditions and climate changes to discuss the adaptation of vegetation ecosystems in Yunnan to climate change,to analyze the vegetation NDVI changes and climate factors in Northern China(Fu et al.,2020;Zhao et al.,2019;He et al.,2020;Liu et al.,2020),to verify the correlation between vegetation changes and climate factors in the Xizang Plateau (Du et al.,2019;Han et al.,2019;La et al.,2019),and to examine the impact of extreme temperature and rainfall on vegetation index(He et al.,2020;Cheng et al.,2020).In addition,researchers have made a comprehensive analysis of the geographically weighted regression model(Lu et al.,2020)to estimate the PM 2.5 concentration in Beijing,Tianjin,and Hebei (Zhang et al.,2020) and to model the downscaling of precipitation products(Shi et al.,2019;Xiang et al.,2019;Zeng et al.,2018).
To sum up,the researches of NDVI have been conducted mostly with the topic focusing on regional changes in the scale of administrative units after sorting out related research findings,and less concerned about the economic units of major human activities.
2 Materials and methods
2.1 Study area
The urban agglomeration in Central Shanxi Basin is located in the eastern Loess Plateau,which is a part of farming-pastoral zone of northern China.The Xinding Basin and the Taiyuan Basin are in the northern and western parts of the study area,respectively;and the Luliang mountainous area and the Taihang mountainous area are in the western and eastern part of the study area,respectively.The terrain of the study area with an average elevation of 800m is characterized by being low in the middle and high in the west and east.The study area dominated by temperate continental climate is located in the intersection of temperate continental climate and temperate monsoon climate,featuring cold winters and hot summers,with large variations in annual temperature.The urban agglomeration in Central Shanxi Basin includes Gujiao City,Jiancaoping District,Jinyuan District,Qingxu County,Wanbailin District,Xiaodian District,Xinghualing District,Yangqu County,and Yingze District of Taiyuan City,Jiexiu City,Pingyao County,Qi County,Taigu County,and Yuci District of Jinzhong City,Jiaocheng County,Fenyang City,Wenshui City,and Xiaoyi City of Luliang City as well as Yuanping City,Xinfu District,Dingxiang County of Xinzhou City,according to theIntegratedDevelopmentPlanningoutlinefortheUrbanAgglomerationintheBasin ofcentralShanxi(2019-2030).
2.2 Data sources
The administrative area boundary map used was obtained from the 1:4 million data of the Basic Geographic Information Center of the National Bureau of Surveying and Mapping and Geographic Information(http://ngcc.sbsm.gov.cn/)with the review number is GS(2016)No.2556,while geographic data were sourced from the Resource and Environmental Science Data Center of the Chinese Academy of Sciences (http://www.resdc.cn).And NDVI data is 1:100,000 data produced by the team led by Xu Xinliang,involving 4 phases,2000,2005,2010 and 2018,with a spatial resolution of 1km.The maximum values of monthly NDVI values from January to December of each year were selected.This period is the vegetation growth state throughout the year,which can well reflect the development trend of regional vegetation.Precipitation data were from the cumulative annual value data set (1981-2010) of the China National Meteorological Science Data Center (http://www.nmic.cn/).The socio-economic data were obtained from the Integrated development planning outline for the urban agglomeration in Central Shanxi Basin (2019-2030)and national economic and social development statistical bulletin in the corresponding year of counties(cities,and districts).
2.3 Methodology
2.3.1 NDVI and precipitation related models
The coordination of NDVI and precipitation was varied.Based on this,this paper comprehensively analyzed the agglomeration characteristics of NDVI and precipitation upon the study on the agglomeration trend between the global unit and adjacent units using spatial auto-correlation in order to accurately judge the ecological spatial correlation.Moreover,the agglomeration status of the ecological space in the study area (Zhang et al.,2020) was also analyzed through the Getis-OrdGiindex before the discussion on the characteristics of differentiation and heterogeneity between NDVI and precipitation.The calculation equation is:
Where,Wijis the spatial weight matrix between elementsiandj.xiandxjare the attribute values of elementsiandj.Nis the sum of the number of counties in the area,andsis the aggregation of all spatial weights.If theGivalue is positive,it indicates that the region is a hotspot.The higher theGivalue,the higher the spatial agglomeration level.Conversely,it is a cold spot region.
2.3.2 Geographically weighted regression model
Regression parameters are varied with the change of geographic location in geostatistical spatial analysis,so that the correlation between the observed variables and the related factor variables can be varied in different spatial geographic locations.Spline function difference and kriging difference are to carry out unbiased estimation of the unknown sampling points of spatial variables making use of the structure of the data function.The Geographically Weighted Regression model is a model based on general linear regression,that is,geographic location factors are added to the linear regression parameters.Spatial difference and geographic weighted regression were utilized to study the precipitation sensitivity of the study area.The calculation equation is:
Wheremandnare the coordinates of required sample points.andniare coordinates of corresponding control points.
WhereZbis the desired value.Znis the known value.Wnis the spatial weight.Sis the number of samples.
Whereb0is a constant.biis an independent variable regression parameter.xijis an independent variable.The(ui,vi)is a geographical location factor of sampling pointi.
3 Results
3.1 Temporal-spatial characteristics of vegetation coverage
3.1.1 Characteristics of NDVI spatial pattern
A NDVI pattern map was drawn according to the 1km resolution NDVI data of the urban agglomeration in Central Shanxi Basin,as shown in Figure 1.The overall NDVI pattern in the study area was changed markedly from 2000 to 2018,presenting a characteristic of rising,falling and rising,which was distributed along the strip terrain.High vegetation coverage can be found in the Lvliang Mountain in the west,the Taihang Mountain in the east,while low vegetation coverage can be seen in the northern Xinding Basin and the southern Taiyuan basin.Note that the lowest coverage can be witnessed in Downtown Taiyuan City(incl.Xinghualing District,Wanbolin District,Jinyuan District,Xiaodian District,Yingze District and Xinghualing District).The NDVI pattern of the study area was concentrated in the west in 2000,featuring lower coverage in the north and south,with the lowest in the central part.The coverage ranged from 0.6 to 0.7 during vegetation period witnessed the largest proportion,accounting for 44.10%,and the coverage ranged from 0.5 to 0.6 and from 0.7 to 0.8 accounted for a relatively large proportion.And the coverage ranging from 0.1 to 0.2 has the smallest proportion,accounting for 0.01,while there is no coverage in the range of 0-0.1 and of 0.9-1.And the rest had small coverages,according to Table 1.The NDVI pattern in the study area was varied mildly in 2005,showing a rising characteristic.Of which,the vegetation coverage increased the most in the west,increased moderately in the north and south,and decreased the most in the central part.The vegetation coverage ranged from 0.7 to 0.8 had the largest proportion,accounting for 37.22%;the coverage ranged from 0.8 to 0.9 had a relatively large proportion.And the intervals of 0.1-0.2 and 0.2-0.3 had the smallest proportion,accounting for 0.009%,while there was still no coverage in the intervals of 0-0.1 and 0.9-1.And the remaining coverage was small.The NDVI pattern in the study area was varied slightly in 2010,showing a declining characteristic.Of which,the vegetation coverage increased the most in the west,increased moderately in the north,and decreased greatly in the south and declined the most in the central part.The vegetation coverage ranged from 0.6 to 0.7 had the largest proportion,accounting for 41.24%;the coverage ranged from 0.7 to 0.8 had a relatively large proportion.And the intervals of 0.9-1 had the smallest proportion,accounting for 0.01%,while there was no coverage in the intervals of 0-0.1.And the remaining coverage was small.The NDVI pattern in the study area was varied greatly in 2018,showing a rising characteristic.Of which,the vegetation coverage increased the most in the west and the east,increased moderately in the north and south,and decreased the most in the central part.The vegetation coverage ranged from 0.8 to 0.9 had the largest proportion,accounting for 38.05%;the coverage ranged from 0.7 to 0.8 had a relatively large proportion.And the intervals of 0.1-0.2 had the smallest proportion,accounting for 0.02%,while there was no coverage in the intervals of 0-0.1 and 0.9-1.And the remaining coverage was small.Evidently,the overall NDVI pattern of the study area was on the rise from 2000 to 2018.Meanwhile,the ecological environment has seen an upward trend thanks to the increased vegetation coverage of the urban agglomeration in Central Shanxi Basin although it remained declined in the central and southern regions due to the rapid increase in construction land as well as some vegetation spaces being converted into construction land.
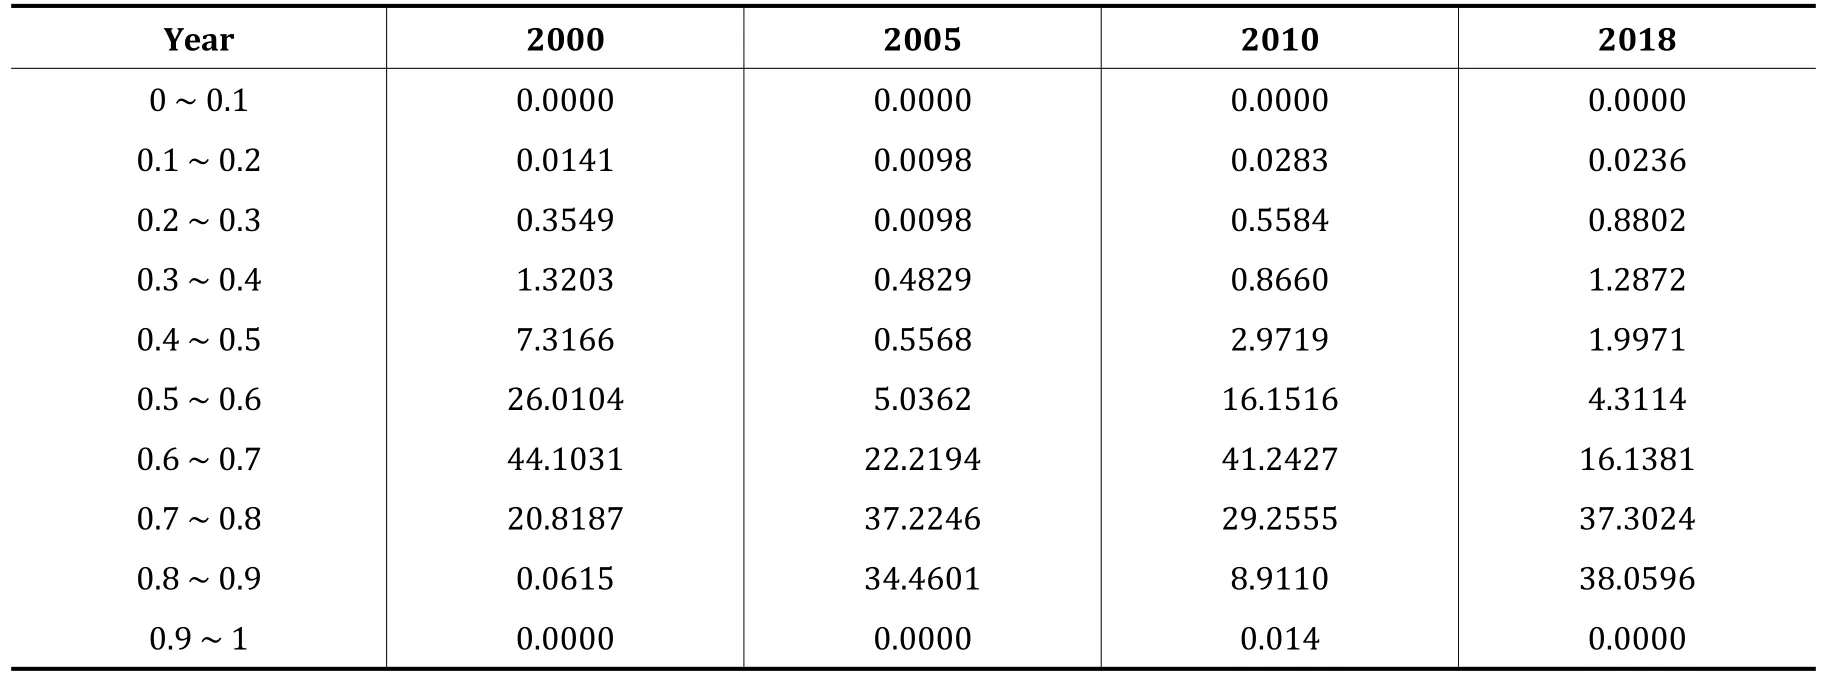
Table 1 Staged spatial pattern of NDVI space of urban agglomeration in Central Shanxi Basin,2000-2018(%)
3.1.2 NDVI spatial evolution characteristics
Also,a NDVI spatial evolution map of the urban agglomeration in Central Shanxi Basin was drawn in accordance with the difference value of the NDVI reclassified raster image calculated by the grid calculator in ArcGIS 10.4.1,as shown in Figure 2.The study area witnessed evident NDVI spatial evolution from 2000 to 2018,presenting a trend of expansion as a whole.It was concentrated in the western,eastern,and southern regions,with an increased area of 15091 km2in total.On the contrary,some areas in the central part were contracted,with an expanded area of 648 km2in total.The study area is located in the eastern part of the Loess Plateau with a temperate continental climate,which is a natural transition zone between arid and semi-arid.It has a main influence on vegetation coverage when woodland and grassland are used as ecological land,and cultivated land as semi-ecological land.

Figure 2 Changed NDVI of urban agglomeration in Central Shanxi Basin,2000-2018
The overall annual average expansion of forest land from 2000 to 2018 was 0.04%;the overall annual average reduction of grassland was 0.18%,and the overall annual average reduction of arable land was 0.48%,according to the land use planning scheme released by the Ministry of Natural Resources of Shanxi Province.The NDVI pattern of the study area was characterized by maintaining from 2000 to 2005,being expansion in the southwest and contraction in the central part.The evolved value of coverage ranged from 0 to 0.1 during vegetation period witnessed the greatest proportion,accounting for 64.73%,and those from 0.1 to 0 had a relatively large proportion.And the interval of-0.3 to-0.2 had the smallest proportion,reaching 0.01,while there was no evolved value of coverage in the range of-0.5 to-0.3 and 0.3 to 0.5.And the remaining had small coverages,according to Table 2.

Table 2 Staged chang of NDVI space of urban agglomeration in Central Shanxi Basin,2000-2018(%)
The NDVI pattern of the study area was characterized by contraction from 2005 to 2010,being expansion in the southwest and contraction in the central part.The evolved value of coverage ranged from 0 to 0.1 during vegetation period witnessed the greatest proportion,accounting for 57.84%,and those from-0.1 to 0 had a relatively large proportion.And the interval of-0.3 to-0.2 had the smallest proportion,reaching 0.09,while there was no evolved value of coverage in the range of -0.5 to -0.3 and 0.3 to 0.5.And the remaining had small coverages.The average annual expansions of forest,grassland,and cultivated land were 0.007%,0.02%,and 0.17%,respectively,in terms of vegetation coverage,thanks to the policy of returning farmland to forests or grassland implemented by the Shanxi government in 1999.Vegetation coverage has been declined for the vegetation possess certain growth periods.The NDVI pattern of the study area was characterized by expansion from 2010 to 2018,being expansion in the west,the east as well as the south and contraction in the central part.The evolved value of coverage ranged from 0 to 0.1 during vegetation period still had the greatest proportion,accounting for 47.50%,and those from 0.1 to 0.2 had a relatively large proportion.And the interval of -0.4 to -0.3 had the smallest proportion,reaching 0.08,while there was no evolved value of coverage in the range of-0.5 to-0.4 and 0.4 to 0.5.And the remaining had small coverages.The characteristics of vegetation coverage in the study area were originated from the second implementation of the policy of returning farmland to forests and grasslands in Shanxi Province in 2014,raising the vegetation coverage.In the meantime,part of the land was changed into construction land under the economic and social development.In particular,residential lands were increased in the central area and the south under the accelerated construction speed in 2012.Evidently,the overall ecological space of the study area is expanding,with expansion in the west,the south and the east,less expansion in the north,and contraction in the central part.Therefore,ecological protection and sustainable development should be highly concerned in the study to promote the harmonious development of man and land while coping with the rapid development of the city.
3.2 Analysis of NDVI and precipitation sensitivity
3.2.1 Characteristics of spatial variation of precipitation
Spline is a deterministic difference with the interpolation result of a global trend,which greatly exceeds the value range of sample points.Kriging is a statistical interpolation method with the interpolation result using only local factors.And the unknown value range was estimated to be less than the extreme value of the sample point.To avoid the deviation in the study of precipitation sensitivity,data used were selected from China's surface cumulative annual value data set(1981-2010),which were the average of multi-year precipitation according to the National Meteorological Science Data Center (http://www.nmic.cn/).Data were analyzed using Spline and Kriging (as shown in Figure 3) in this paper.As displayed in Spline,the urban agglomeration in Central Shanxi Basin is characterized by greater precipitation in the west and less precipitation in the east,presenting a progressive decline from the west to the east as a whole.The southwestern part of the study area observed the most precipitation,with more than 440mm.The western part had more precipitation,ranging from 420mm to 440mm.The central part had a large variation in precipitation,in general,maintaining at 410mm.And the eastern part had the least precipitation,with less than 390mm.As displayed by Kriging in the study area,more precipitation was witnessed in the west and less in the east,showing a trend of decreasing from the west to the east.The southwestern part of the study area had the most precipitation,ranging from 430mm to 440mm.The western part had more precipitation.The central part had a large variation in precipitation,still maintaining at 410mm.The eastern part had less precipitation,and the southeast has the least precipitation,ranging from 390mm to 400mm.Spline and Kriging had basically consistent precipitation trend,with the same areas of more and less precipitation,and the precipitation in the central part maintaining at 410mm.But the maximum precipitation range of Spline is greater than that of Kriging,and the minimum precipitation range of Spline is lower than that of Kriging.The study area is located in the central part of Shanxi,with Taihang Mountain in the east and Lvliang Mountain in the west.Its precipitation trend is varied under the influence of the southeast monsoon.Therefore,more precipitation in the study area was detected in the southwest and less in the east and southeast as a whole,showing a trend of decreasing from the west to the east.
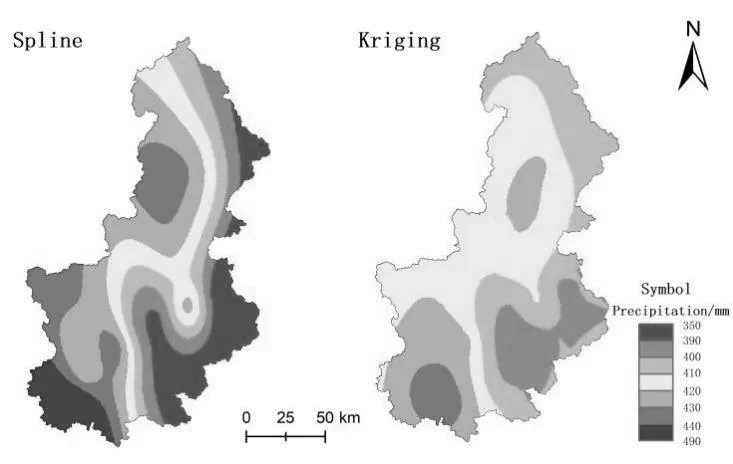
Figure 3 Spatial change of characteristics of precipitation of urban agglomeration in Central Shanxi Basin
3.2.2 Correlation between NDVI and precipitation
In addition,a 10km vector grid was made for the urban agglomeration in Central Shanxi Basin,and the average of the ecological spaces in various grids was calculated through statistically partitioning the reclassified images to reflect the overall correlation characteristics of the region,as shown in Figure 4.Spatial trends of the two methods were consistent in the simulation of Spline and Kriging precipitation by NDVI.But Spline had the higher linear slope and apparent variations in space.Through further analysis,the global Moran I index of NDVI and Spline precipitation was obtained as-0.1723,being negatively correlated.And the global Moran I index of NDVI and Kriging precipitation was -0.1055,being negatively correlated,with a weak correlation.The correlation coefficient of precipitation between NDVI and Spline was -0.0001,while the standard error of precipitation between NDVI and Kriging was-0.0003.The precipitation P value for NDVI and Spline was 0.1658,while the precipitation P value for NDVI and Kriging was 0.4469.Evidently,Spline and Spline were significant.NDVI and Spline hotspots in the study area were mainly distributed in the west and southeast as well as the north,whereas the cold spots were in the south.And the remaining areas were insignificant.NDVI and Kriging hotspots in the study area were mainly distributed in the west and the central part,whereas the cold spots were in the southeast.And the remaining areas were insignificant.Apparently,NDVI in the study area presented a circle-layered distribution of the cold and hot spots simulated by Spline and Kriging precipitation.Among them,the west and the south were the main hotspot and cold spot gathering areas,respectively.
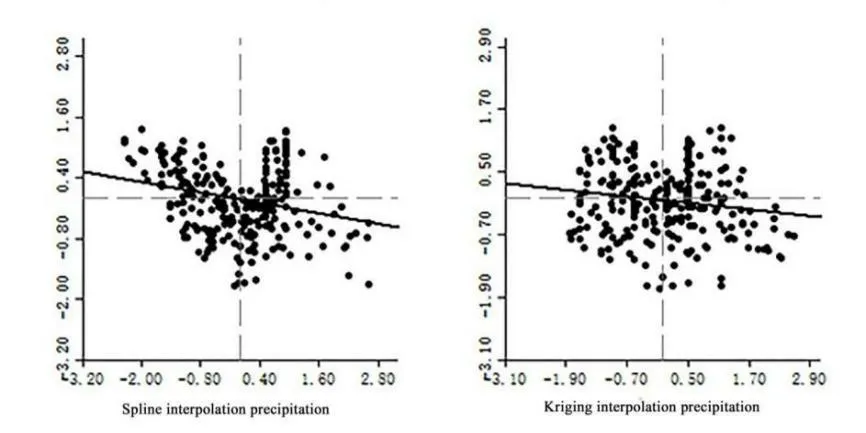
Figure 4 Correlation of NDVI and precipitation of urban agglomeration in Central Shanxi Basin
3.2.3 NDVI precipitation sensitivity analysis
The influence of precipitation on NDVI was also verified using the Geographically Weighted Regression model upon the setting of the average value in the grid.According to the results,Spline has a favorable simulation effect on the NDVI precipitation sensitivity of the urban agglomeration in Central Shanxi Basin (as shown in Table 3) with R2as 0.8662 and adjusted R2as 0.8530.By comparison,Kriging has a dissatisfactory simulation effect on the NDVI precipitation sensitivity with R2as 0.8075,and adjusted R2as 0.7855.Hence,NDVI precipitation sensitivity of spline function interpolation was mainly discussed in this paper.The NDVI precipitation sensitivity trend chart was drawn through the geographically weighted regression model,as presented in Figure 5.The precipitation sensitivity trends of the Spline and Kriging spatial simulation study area were basically consistent,decreasing from the west to the east.The NDVI precipitation sensitivity was the maximum in the west,reaching 1.3129,with the minimum in the southeast and northeast,reaching-1.0908.The NDVI precipitation sensitivity coefficient of Spline function in the study area was varied greatly,whereas the NDVI precipitation sensitivity coefficient of Kriging difference was varied slightly.The NDVI precipitation sensitivity coefficient was varied in the study area under the influence of the temperate monsoon climate and topography,causing that the west is highly sensitive and the east weakly sensitive.As the central part is a densely urban area,it is of moderate sensitivity.The NDVI precipitation sensitivity in the study area was decreasing from the west to the east as a whole.
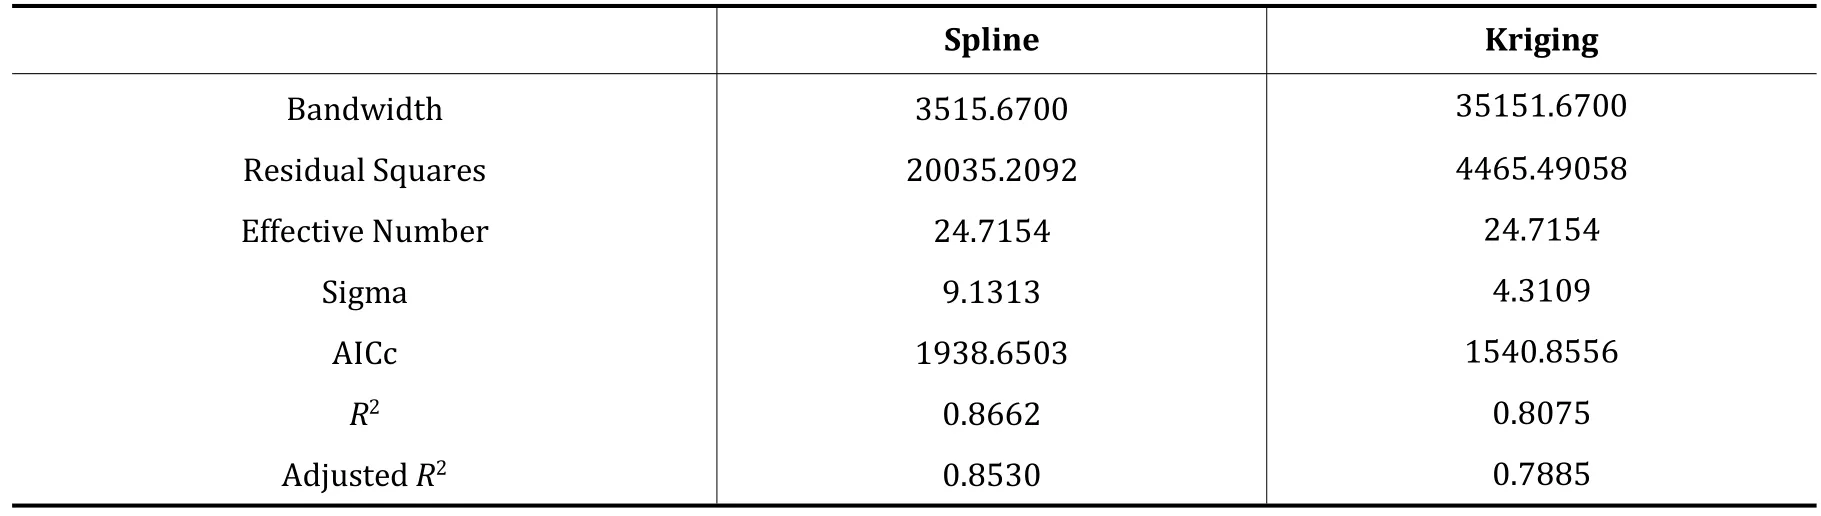
Table 3 The estimation results of GWR model of precipitation sensitivity

Figure 5 Characteristics of spatial pattern of ecological precipitation sensitivity of urban agglomeration in Central Shanxi Basin
4 Discussion and conclusion
4.1 Discussion
This paper studied NDVI and precipitation sensitivity of the urban agglomeration in Central Shanxi Basin in conjunction with related NDVI researches (Gamon et al.,2013;Li et al.,2017)based on the function of NDVI in nature protection,ecological protection,mountain forest protection,ecosystem stability and diversity protection.The overall pattern of NDVI in the study area from 2000 to 2018 was not varied significantly and distributed in strips along the terrain,with main concentration in the Lvliang Mountains in the west,followed by the east.The Xinding Basin in the north and the Taiyuan Basin in the south had low NDVI with the lowest in the central part.The study area witnessed evident NDVI spatial evolution from 2000 to 2018,presenting a trend of expansion as a whole.It was concentrated in the western,eastern,and southern regions,with an increased area of 15091 km2in total.But some areas in the central and southern part were contracted The results obtained in this paper were basically consistent with those made by(He et al.,2020)in the study of the NDVI variation characteristics in northern China and(Liu et al.,2020)who found the NDVI variation trend in central Shanxi in the NDVI study of different vegetation covered types in the Loess Plateau.The average annual expansion of woodland was 0.04%;the average annual reduction of grassland was 0.18%;and the average annual reduction of arable land was 0.48%in the study area from 2000 to 2018.
To be specific,precipitation sensitivity was studied in this paper based on the study on characteristics of vegetation index variations in northern China and the urban agglomeration in Central Shanxi Basin under the large-scale direction of climate change by(He et al.,2020)and the comparison investigation method conducted by (Cheng et al.,2020) in the research on NDVI variation characteristics and precipitation sensitivity in mountainous watersheds in southwestern China.NDVI in the study area was relevant.The precipitation trends of Spline and Kriging were basically the same,featuring more precipitation in the southwest and less in the east and southeast as a whole.There was a trend of decreasing from the west to the east.The precipitation in the central part remained at roughly 410mm.But the maximum range of Spline precipitation was greater than that of Kriging,and the minimum range of precipitation is less than that of Kriging.Spline has a favorable simulation effect on the NDVI precipitation sensitivity of the urban agglomeration in Central Shanxi Basin,while Kriging has a dissatisfactory simulation effect on the NDVI precipitation sensitivity.But the Spline and Kriging spatial simulation study areas have nearly the same precipitation sensitivity trends of declining from west to east.NDVI precipitation sensitivity is positive in the northwest,showing strong sensitivity,and negative in the east and central,presenting weak sensitivity.
To respond to the NDVI development and climate change,scientific ecological conservation is required in the western and eastern parts of the urban agglomeration in Central Shanxi Basin to guarantee the area of ecological land.Moreover,closure of hills for afforestation and trees and grasses planting according to local conditions should be performed at the country's annual rising rate of 3% afforestation to reduce wasteland.Ecological compensation should be provided to the residents who suffered losses due to the development of ecology and climate in counties,cities and villages of the study area.Ecological land should be reserved while planning production and living spaces in the Taiyuan Basin and Xinding Basin.And ecological corridors should be reserved for agricultural production to maintain water and soil as well as prevent land salinization.The quality of the living environment is improved through the arrangement of green space,landscape vegetation and gardens in urban development.
The defects of this paper are presented below.First,the space trend reflected by the average point through selecting the Geographically Weighted Regression model (Lu et al.,2020) in the study area to discuss the precipitation sensitivity has a significant impact on the overall spatial relationship and an insignificant impact on the local spatial relationship.Second,the precipitation factor was dominated in the analysis of precipitation sensitivity without considering other factors and analysis of comprehensive factors due to the limited technical level and data.To sum up,the investigation of local NDVI precipitation sensitivity and the analysis of comprehensive factors should be conducted under the time series variation trend in the future.
4.2 Conclusions
In this paper,the NDVI of the urban agglomeration in Central Shanxi Basin was first reclassified using ArcGIS 10.4.1.Then,the overall spatial-temporal evolution pattern and the development rule of climate sensitivity of the urban agglomeration in Central Shanxi Basin from 2000 to 2018 were explored taking advantage of the methods of NDVI land use evaluation and the Geographically Weighted Regression model.It concluded that the overall pattern of NDVI of the urban agglomeration in Central Shanxi Basin has been varied,and distributed along the topography in the shape of strip.And the NDVI spatial evolution in the study area is varied significantly with the trend of expansion as a whole with the presentation of a shrinking trend in a small part of areas.
NDVI in the study area is relevant.The precipitation is presented in a decreasing trend from the west to the east.Spline has a favorable simulation effect in the study of the influence of precipitation on NDVI,while Kriging has a dissatisfactory simulation effect.The precipitation sensitivity presents a declining trend from the west to the east.NDVI precipitation sensitivity is positive in the northwest,showing strong sensitivity,and negative in the east and central,presenting weak sensitivity.
Acknowledgment
This research is supported by the National Natural Science Foundation of China (Grant No.41701223).
杂志排行

Ecological Economy的其它文章
- Assessing the impact of manufacturing agglomeration on environmental pollution in Beijing-Tianjin-Hebei region using spatial panel data model
- Determinates of the competitiveness of provincial forest health care industry in China
- Structural characteristics and influencing factors of spatial correlation network for regional high-quality development in China
- Spatial and temporal heterogeneity of the impact of per capita income on household indirect carbon emissions in western China
- Carbon emission reduction effect and mechanism test of carbon emission trading pilot
- Regulatory mode selection and legal governance of China's response to climate change risk