Comprehensive analysis of disulfidptosis related genes and prognosis of gastric cancer
2023-12-15QianLiLongKuanYin
Qian Li,Long-Kuan Yin
Abstract BACKGROUND Gastric cancer (GC) is a common malignant tumor of the digestive system.Disulfidptosis is a new programmed cell death mechanism,although its specific mechanism in GC is incompletely understood.AIM In this study,we used bioinformatics analysis to explore a disulfidptosis-based predictive model related to GC prognosis and to identify potential therapeutic targets and sensitive drugs for GC.METHODS We extracted GC-related data from The Cancer Genome Atlas and Gene Expression Omnibus databases.R software (version 4.2.1) was used for correlation analysis.RESULTS Through the above analysis,we found that the disulfidptosis related gene may be related to the prognosis of GC.Six genes,namely,PLS3,GRP,APOD,SGCE,COL8A1,and VAMP7,were found to constitute a predictive model for GC prognosis.APOD is a potential therapeutic target for treating GC.Bosutinib and other drugs are sensitive for the treatment of GC.CONCLUSION The results of this study indicate that disulfidptosis is related to the prognosis and treatment of GC,while APOD represents a potential therapeutic target for GC.
Key Words: Gastric cancer;Disulfidptosis;Drugs;Prognosis;Targets
INTRODUCTION
Gastric cancer (GC) is a common cause of cancer-related death worldwide,with a particularly high incidence in East Asia,such as South Korea,China,and Japan[1-9].The early clinical symptoms of GC are not obvious and lack specificity[10-14],which leads to a low rate of early diagnosis[15-26].Most patients with GC are diagnosed late and have a poor prognosis[27-40].Although the diagnosis and treatment strategies for GC have gradually increased in recent decades,the prognosis of advanced GC remains poor[41-47].Therefore,there is an urgent need to find more biomarkers as novel therapeutic targets and to develop new drugs to improve diagnosis and treatment measures and,consequently,patient survival and prognosis.
GC is a heterogeneous disease[48],with previous studies suggesting that various cell programmed death mechanisms,including ferroptosis[49-54] and cuproptosis[55-58],represent novel research directions for GC.In recent years,it has been found that disulfidptosis[59],a novel and poorly studied mechanism of programmed cell death,represents a previously uncharacterized form of cell death induced by abnormal accumulation of disulfide in cells under glucose starvation,which is different from copper death and iron death.However,its role in GC and its related mechanisms are still unclear and need to be further explored.
In this study,we analyzed the sequencing data of tumor tissues from databases such as The Cancer Genome Atlas (TCGA)[60] and Gene Expression Omnibus (GEO) (Supplementary material)[61] and 14 disulfidptosis-related gene (DRGs)[59] (ACTN4,ACTB,CD2AP,CAPZB,DSTN,FLNA,FLNB,INF2,IQGAP1,MYH10,MYL6,MYH9,PDLIM1,andTLN1).We conducted differential analysis of DRGs,as well as analyses of the tumor mutation burden (TMB)[62,63],copy variations,gene ontology (GO)[64],and the kyoto encyclopedia of genes and genomes (KEGG)[65],among others.In this paper,the mechanism of DRGs involved in the occurrence and development of GC is discussed,and new therapeutic targets and drugs that may be related to the prognosis of GC are preliminarily analyzed and screened from a new perspective.
MATERIALS AND METHODS
Data downloading and processing
Expression data,clinical data,mutation data,and copy data related to GC were downloaded and organized from TCGA database.The GSE84433 and GSE26253 datasets and their platform annotation files were downloaded from the GEO database.Data were analyzed and processed using R software (version 4.2.1) and Perl software (version 5.30.0).
Differential and prognostic analyses
GC-related data were extracted from TCGA database and analyzed in combination with the disulfidptosis-related gene.Differential analysis,mutation load analysis,copy number variation frequency analysis,and survival analysis were performed using R software.
Disulfidptosis subtype analysis
R software was used to classify all samples related to the disulfidptosis-related gene in TCGA and GEO databases for survival analysis,heatmap clustering,gene set variation analysis (GSVA),immune cell differential analysis,subtype differential analysis,and GO and KEGG enrichment analyses.
Significant differential gene subtyping,prediction model construction,and analysis
We continued to perform survival analysis,heatmap clustering,and differential analysis of the DRGs on the samples classified by differential gene subtyping.Then,we randomly divided the significant differential samples into groups and performed least absolute shrinkage and selection operator (LASSO) regression analysis and univariate and multivariate Cox regression analyses and constructed a prognostic model.Using the prognostic model,we calculated the risk score for each patient sample using the following formula:.where Coefiis the coefficient,and Xiis the expression level of the gene.We constructed a prognostic evaluation model for overall survival based on the risk score.We then constructed a Sankey diagram and analyzed the differences in risk scores between subtypes and the differential risk of the DRGs.
Prognostic model validation
The reliability of the prognostic model was verified by survival analysis,receiver operating characteristic (ROC) curve mapping,risk curve mapping,survival state map,and clustering heatmap of model genes in each subgroup.
Nomogram construction and analysis of the correlation between risk score and immunity,as well as drug susceptibility
Next,the independent prognostic factors of GC and potential therapeutic targets were sought by constructing the column diagram,and survival analysis of potential prognostic genes was performed by Gene Expression Profiling Interactive Analysis (GEPIA).Subsequently,immune cell correlation analysis,tumor microenvironment (TME) difference analysis,waterfall map construction,tumor mutation load analysis,microsatellite instability (MSI),stem cell correlation analysis,and drug sensitivity analysis were performed for the risk score.
Immunohistochemical analysis
We conducted immunohistochemical analysis ofAPODusing the human protein atlas (HPA) network database,comparing the differences in protein expression between GC tissues and adjacent normal tissues.
Statistical analysis
All statistical analyses were performed using R software (version 4.2.1).AP-value <0.05 was considered statistically significant.
RESULTS
Difference analysis and prognosis analysis of DRGs
Difference analysis revealed that 10 DRGs,namely,ACTN4,ACTB,CD2AP,CAPZB,FLNB,INF2,IQGAP1,MYH10,MYH9andPDLIM1,were significantly different in GC samples and adjacent normal tissue samples (Figure 1A).Through mutation load analysis,copy number variation frequency analysis,and a genosphere map,we found thatCAPZBandMYL6were not mutated,whileMYH10had the most mutations.It was also found thatCAPZBhad the most deletion mutations,whileIQGAP1had the most insertion mutations.Cyclic analysis led to the identification of disulfidptosis mutations in 14 chromosomes (Figure 1B-D).Moreover,survival analysis showed that patients with high expression ofTLN1,MYL6,MYH10,MYH9,IQGAP1,INF2,FLNA,DSTN,andACTBhad a reduced survival time,while those with high expression ofPDLIM1had an increased survival time (Figure 2A–J).Prognostic network diagram analysis showed that disulfidptosis-related genes,includingPDLIM1,FLNA,MYH10,MYL6,andDSTN,were significantly correlated with the prognosis of GC (P<0.05),andDSTN,FLNA,MYH10,andMYL6were risk factors for the prognosis of GC,whilePDLIM1was a favorable factor for the prognosis of GC (Figure 2K).
Subtyping of the DRGs and analysis through GSVA,single-sample gene set enrichment analysis,GO,and KEGG analyses
Through clustering analysis of the DRG samples,we found that the best way to divide the samples was into two subtypes,A and B (Figure 3A-D).Through survival analysis of the two subtypes,we found significant differences between the groups,P<0.05 (Figure 3E),and through clustering heatmap analysis,we found that most DRGs were upregulated in cluster A and downregulated in cluster B (Figure 3F).Using the GSVA package in R software,we performed KEGG pathway enrichment analysis on the DRG subtyping samples and found that the significantly different pathways enriched in the two subtypes included glutamate and glutamine metabolism,extracellular matrix receptor interaction,the transforming growth factor-beta (TGF-β) signaling pathway,and the pentose phosphate pathway (Figure 4A).Through GO functional enrichment analysis of the DRG subtyping samples with the GSVA package in R,we found that the main enrichment was in the positive regulation of the transforming growth factor receptor and Wnt signaling pathways (Figure 4B).We also found significant differences in immune cells,such as activated CD4 T cells,and activated CD8 T cells,between subtypes A and B,according to the analysis of the differences in immune cells between the subtypes (Figure 5A).Subtype differential analysis led to the identification of 282 significantly different co-expressed genes between subtypes A and B (Figure 5B and C).Moreover,GO analysis of these differentially expressed genes revealed that the enriched functions of these differentially expressed genes were mainly in the extracellular matrix tissue and negative regulation of the typical Wnt signaling pathway (Figure 5D).KEGG analysis of these differentially expressed genes revealed that these genes were enriched in the TGF-β,Wnt,and MAPK signaling pathways,as well as in other pathways (Figure 5E).

Figure 1 The results of the differential expression analysis of disulfidptosis related genes in gastric cancer and adjacent normal tissues are presented.A: Shows the difference analysis of disulfidptosis related genes in gastric cancer tissue samples and adjacent normal tissue samples;B: Shows the waterfall plot of disulfidptosis related genes mutations;C: Presents the mutation frequency of disulfidptosis related genes;D: Shows the mutation sites of disulfidptosis related genes.CNV: Copy number variation.
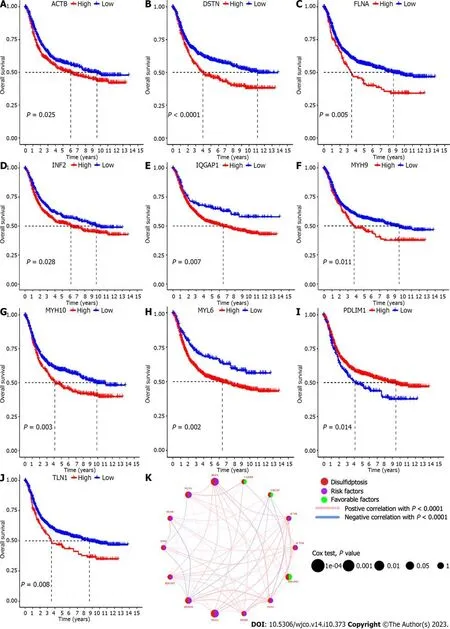
Figure 2 Screening disulfidptosis related genes related to the prognosis of gastric cancer. A-J: Show the Kaplan-Meier analysis of the survival curves of disulfidptosis related genes between high and low expression groups,and 10 disulfidptosis related genes related to gastric cancer prognosis were identified;K: Shows the COX analysis of the disulfidptosis related genes circle plot related to gastric cancer prognosis,and five significantly prognostic disulfidptosis related genes were identified.

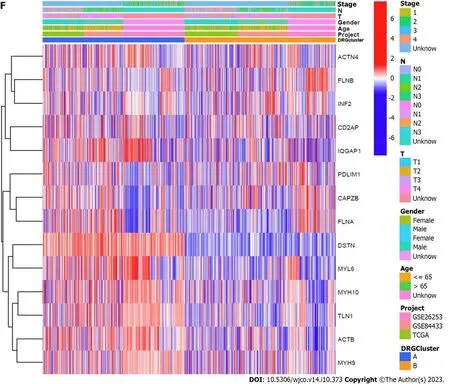
Figure 3 The sample classification,subgroup survival analysis,and differential gene heatmap related to disulfidptosis related genes are presented.A: Shows the clustering matrix plot of disulfidptosis related genes-related samples;B: Shows the clustering index plot of disulfidptosis related genesrelated samples;C: Presents the relative change area under the cumulative distribution function curve;D: Shows the tracking plot of disulfidptosis related genes subgroup samples;E: Presents the survival analysis curves of disulfidptosis related genes subgroups;F: Shows the differential gene clustering heatmap between disulfidptosis related genes subgroups.
Classification and correlation analysis of significant differentially expressed genes obtained from the disulfidptosis subtype samples
The related samples of differentially expressed genes were clustered into three subtypes (Figure 6A–D).Survival analysis showed that the prognosis of subtype C was different from that of subtypes A and B,with better prognosis for subtypes B and C (Figure 6E).Heatmap analysis showed that most samples in subtype C were upregulated,while most samples in subtype B were downregulated (Figure 6F).Differential expression analysis of the DRGs in the different gene subtypes showed that the expression of the DRGs was different in subtypes A,B,and C,withP<0.05 (Figure 6G).We used the create data partition package to randomly divide the samples into two groups of equal size,the training and testing groups.Then,using LASSO regression and Cox regression,we analyzed the training group samples and constructed a six-gene risk model based on the DRG subtype: Risk score=(0.164102181511909*PLS3expression)+(0.079055019007862*GRPexpression)+(0.0649967121599996*APODexpression)+(0.0920219139298833*SGCEexpression)+(0.107438278125729*COL8A1expression)+(–0.0723643090076661*VAMP7expression) (Figure 6H and I).The results of the risk model are shown in Supplementary Table 1.The Sankey diagram shows the distribution of samples among the different groups (Figure 7A).By evaluating the risk score for each group,we found significant differences in the risk between the groups (Figure 7B and C).By evaluating the risk score for the DRGs,we found that the expression levels of 13 DRGs differed significantly between the high and low risk groups,with nine genes showing higher expression in the high-risk group and four genes showing higher expression in the low-risk group (Figure 7D).
Validation results of the risk model
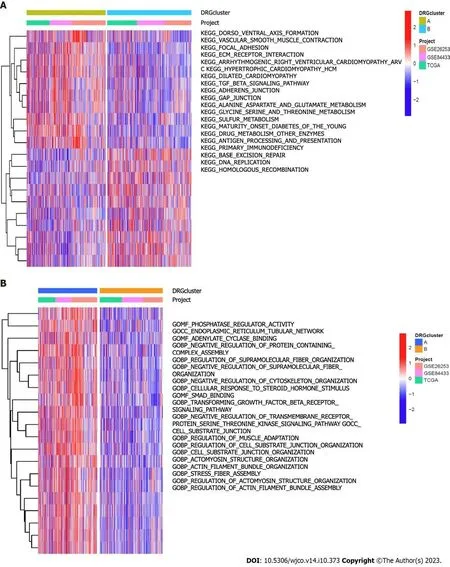
Figure 4 The significantly different kyoto encyclopedia of genes and genomes pathways and gene ontology functional analysis between disulfidptosis related genes subgroups are presented.A: Shows the significantly different kyoto encyclopedia of genes and genomes pathway enrichment analysis between disulfidptosis related genes subgroups;B: Shows the significantly different gene ontology pathway enrichment analysis between disulfidptosis related genes subgroups.

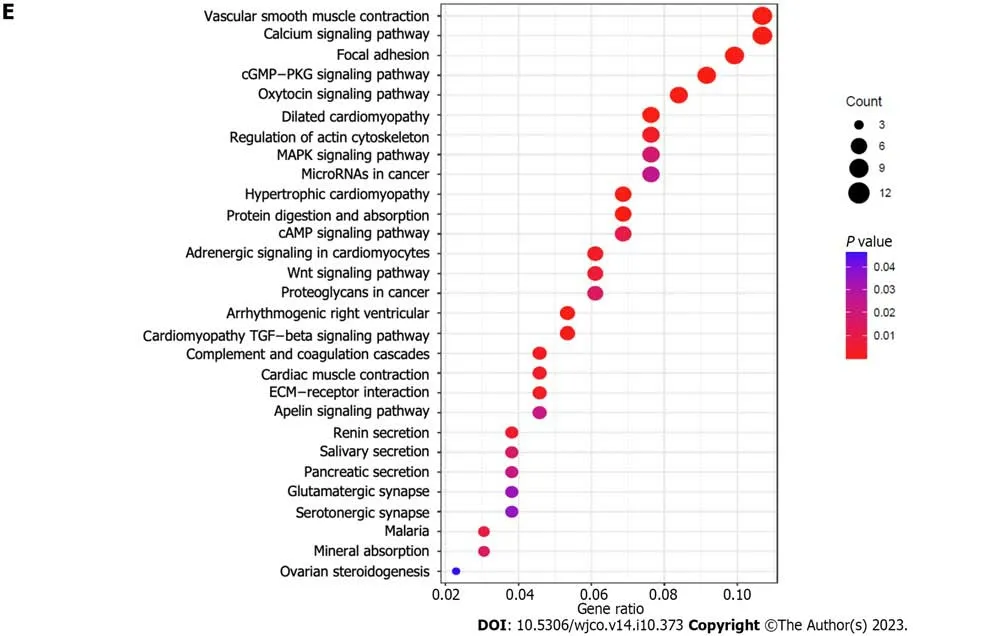
Figure 5 The immune cell differential analysis,principal component analysis analysis,significantly different genes,and gene ontology/kyoto encyclopedia of genes and genomes analysis between disulfidptosis related genes subgroups are presented.A: Shows the immune cell differential analysis between disulfidptosis related genes subgroups;B: Presents the principal component analysis analysis of disulfidptosis related genes subgroups;C: Shows the significantly different genes between disulfidptosis related genes subgroups;D: Presents the gene ontology analysis of significantly different genes between disulfidptosis related genes subgroups;E: Presents the kyoto encyclopedia of genes and genomes analysis of significantly different genes between disulfidptosis related genes subgroups.
We next used the risk model to score the differential gene-related samples mentioned above and then divided them into high-and low-risk groups for the overall,test set,and training set samples.We then performed survival,ROC,and risk analyses on each group.Survival analysis of each group revealed that the high-risk group had poorer prognosis than the low-risk group (Figure 8A-C).Through ROC curve analysis of each group,we found that the area under the curve values of the overall,training set,and test set samples for 1,3,and 5 years were all >0.05,indicating the accuracy of the model in predicting survival prognosis (Figure 8D-F).Risk curve analysis of the total,training set,and test set samples showed an increase in the number of deaths with an increase in the risk score.We also found thatVAMP7was a low-risk gene,whilePLS3,GRP,APOD,SGCE,andCOL8A1were high-risk genes through heatmap analysis (Figure 8G-O).Comparison of the results of survival,ROC,and risk analyses among various groups showed that the results were consistent,indicating the accuracy of this risk model in predicting the prognosis of patients with GC.
Identification of potential therapeutic targets by constructing column line graphs and immune and drug sensitivity analyses
We found thatAPOD,PLS3,age,sex,and N staging are independent factors that impact patient prognosis,all of which are risk factors for the prognosis of patients with GC.The odds of patients surviving for 1,3,and 5 years are 0.806,0.527,and 0.39,respectively (Figure 9A).The correction curve shows that the predicted value of the model is close to the actual value (Figure 9B).Through immune cell analysis,we found that resting mast cells andAPODwere significantly positively correlated.Moreover,PLS3was significantly positively correlated with resting mast cells (Figure 9C).We also conducted survival analysis onAPODandPLS3by GEPIA,which were found to have independent effects on the prognosis of GC through column line graph analysis,and found that the survival analysis ofAPODshowed significant differences (P<0.05) (Figure 9D),while the survival analysis ofPLS3did not indicate the presence of significant differences (P>0.05) (Figure 9E).In the relationship analysis between immune cells and risk scores,we found that 13 types of immune cells were significantly correlated with risk scores (Figure 10).Through TME scoring,we found differences between high and low risk groups in terms of the Stromal Score and ESTIMATE Score,both of which were upregulated in the high-risk group (Figure 11A).The waterfall chart shows that the genes that undergo mutations in the high-and low-risk groups were consistent,while the probability of mutations occurring in the low-risk group was higher than that in the high-risk group (Figure 11B and C).Through TMB analysis,we found significant differences between the high-and low-risk groups,as well as a negative correlation between TMB and risk scores (Figure 11D and E).Through microsatellite instability analysis,we found significant differences between the microsatellite stability and MSI-high (MSIH) groups,as well as between the MSI-H and MSI-low groups.The risk value of the MSI-H group is the lowest,and the proportion of stable samples in the high-risk group is as high as 71% (Figure 11F and G).Stem cell correlation analysis shows that RNA stemness scores (RNAss) is negatively correlated with risk scores (Figure 11H).Finally,drug analysis showed significant differences in the sensitivity of 89 drugs,including Bosutinib and Bryostatin (Figure 11I and J),between high-and low-risk groups.
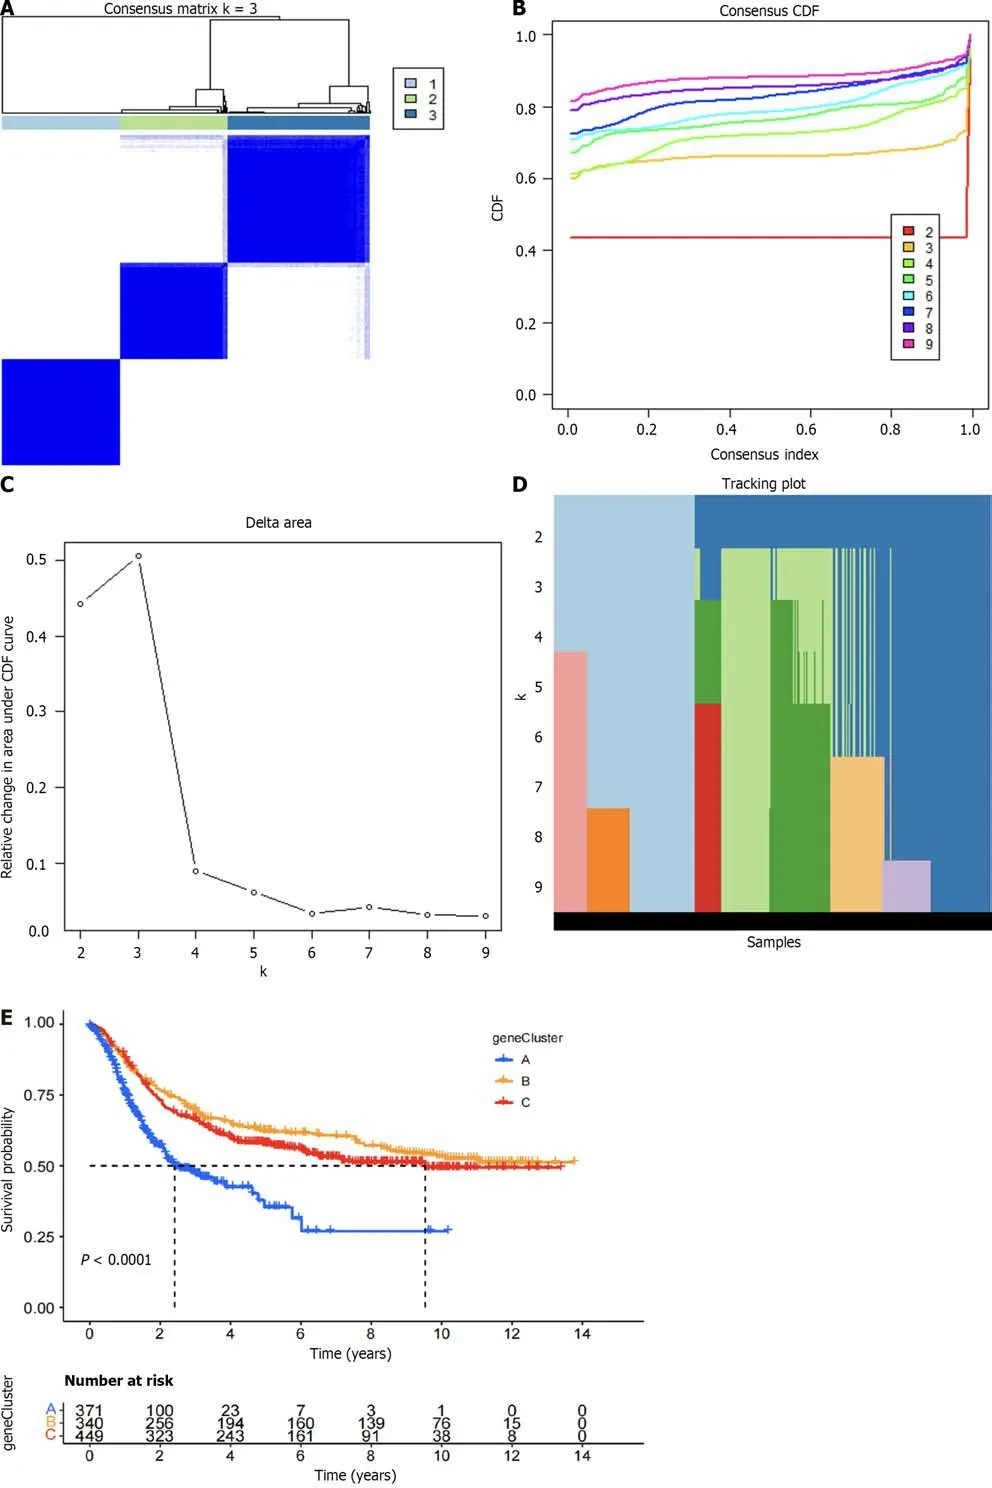
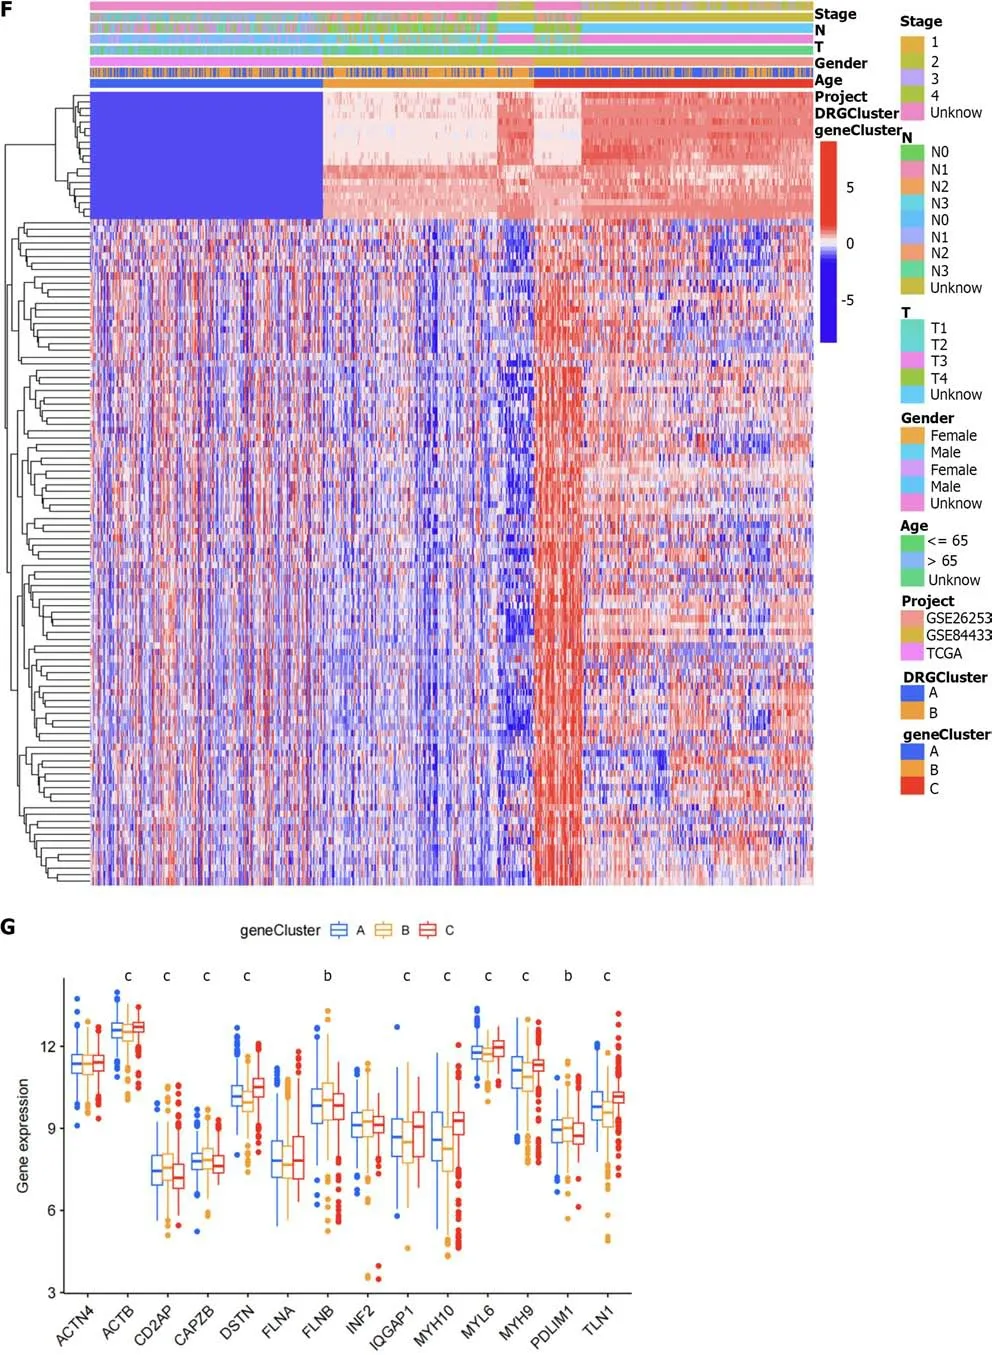
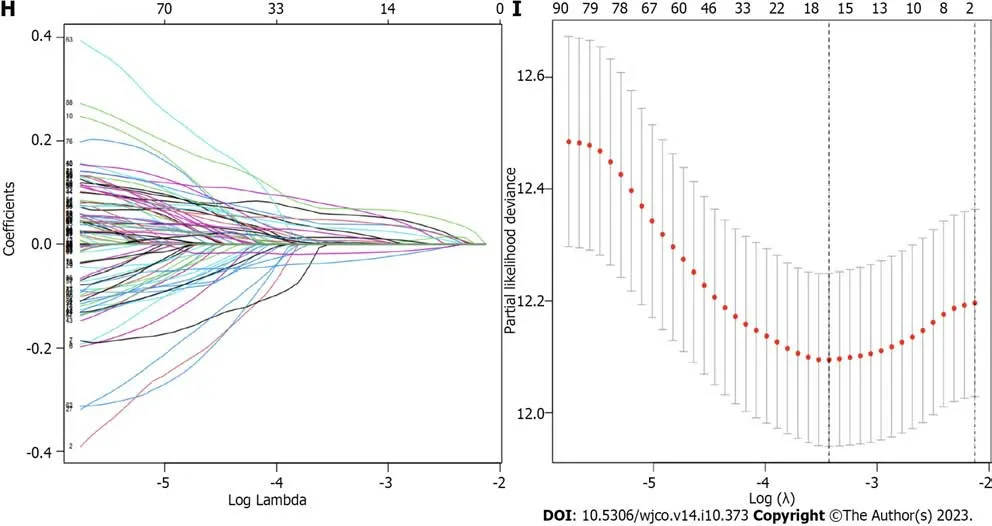
Figure 6 The differential gene-related sample clustering matrix,clustering index,cumulative distribution function curve,tracking plot,survival curve,heat map,differential analysis of disulfidptosis related genes,lasso regression plot,and cvfit plot are presented. A: Shows the clustering matrix of differential gene-related samples;B: Presents the clustering index of differential gene-related samples;C: Shows the relative change area of the cumulative distribution function curve of differential gene-related samples;D: Presents the tracking plot of differential gene subgroups;E: Shows the survival curve of differential gene-related samples;F: Presents the heat map of differential gene-related samples;G: Presents the differential analysis of disulfidptosis related genes between differential gene-related sample groups;H: Shows the lasso regression plot;I: Presents the cvfit plot of the lasso regression.
Immunohistochemical analysis
Through the HPA network database,immunohistochemical analysis ofAPODrevealed that the protein expression level ofAPODin GC tissues was significantly higher than that in normal tissues adjacent to GC (Figure 12).
DISCUSSION
The occurrence and development of GC are complex pathological processes involving the activation and alteration of multiple genes and signaling pathways[66].Previous studies have shown that the expression of certain genes in GC tissue and normal gastric tissue can vary[67].In this study,we analyzed the differential expression of 10 DRGs between GC tissue and adjacent normal tissue and found significant differences between the two.By analyzing the mutation waterfall plot and mutation frequency plot of DRGs,we observed that most DRGs were mutated in GC tissue,further indicating that DRGs are differentially expressed in cancer tissue.Previous studies have found that high expression of the disulfidptosis-related genePDLIM1may inhibit the proliferation,invasion,and migration of GC cells,promote apoptosis,and enhance their sensitivity to cisplatin[68].It has also been found that the high expression ofFLNAcan lead to low survival rate and migration and invasion energy of GC cells[69].Additionally,the disulfidptosis-related geneMYH10may be related to the occurrence,development,and drug resistance of ovarian cancer[70],but its role in GC requires further exploration.Moreover,previous studies have revealed thatDSTNincreases the colony formation and migration ability of tumor cells when highly expressed[71],although its relationship with GC prognosis requires further study.Study onMYL6revealed possible impacts on the migration of melanoma cells[72],but its relationship with GC needs further study.In this study,we found thatPDLIM1,FLNA,MYH10,MYL6,andDSTNare significantly associated with GC prognosis (P<0.05),among which,DSTN,FLNA,MYH10,andMYL6are risk factors for GC prognosis,whilePDLIM1is a protective factor for GC prognosis.Our study further demonstrates the impact of DRGs on GC prognosis.
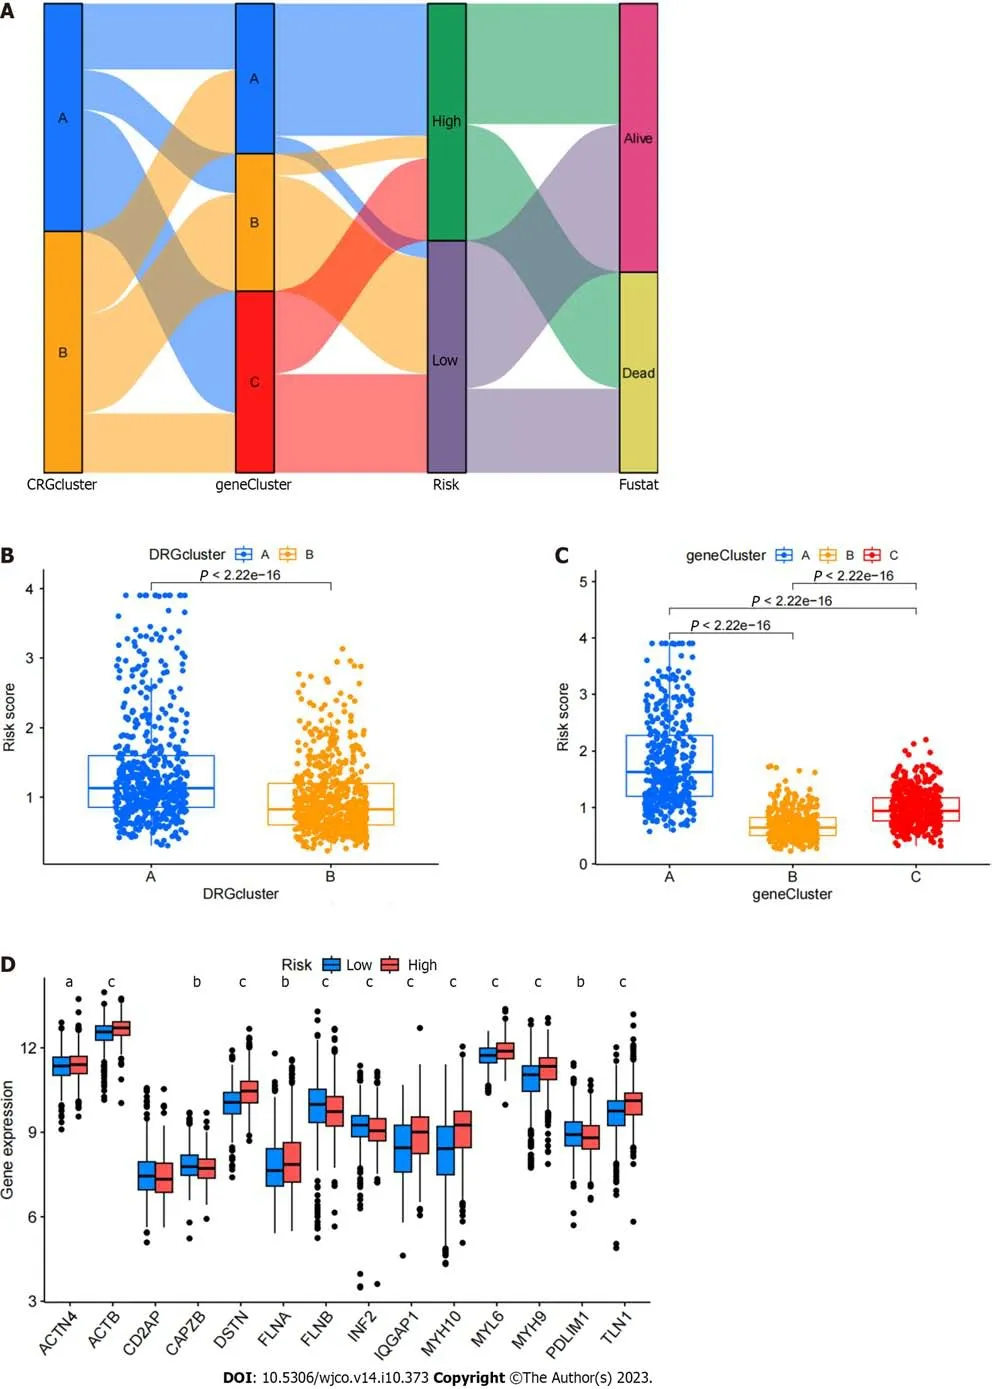
Figure 7 Testing the reliability of prognostic models.A: A Sankey diagram of the relationships between various data is presented;B: Shows a box plot of the disulfidptosis subtype;C: Presents a box plot of gene subtypes;D: Shows the differential analysis of disulfidptosis related genes between high and low-risk groups.
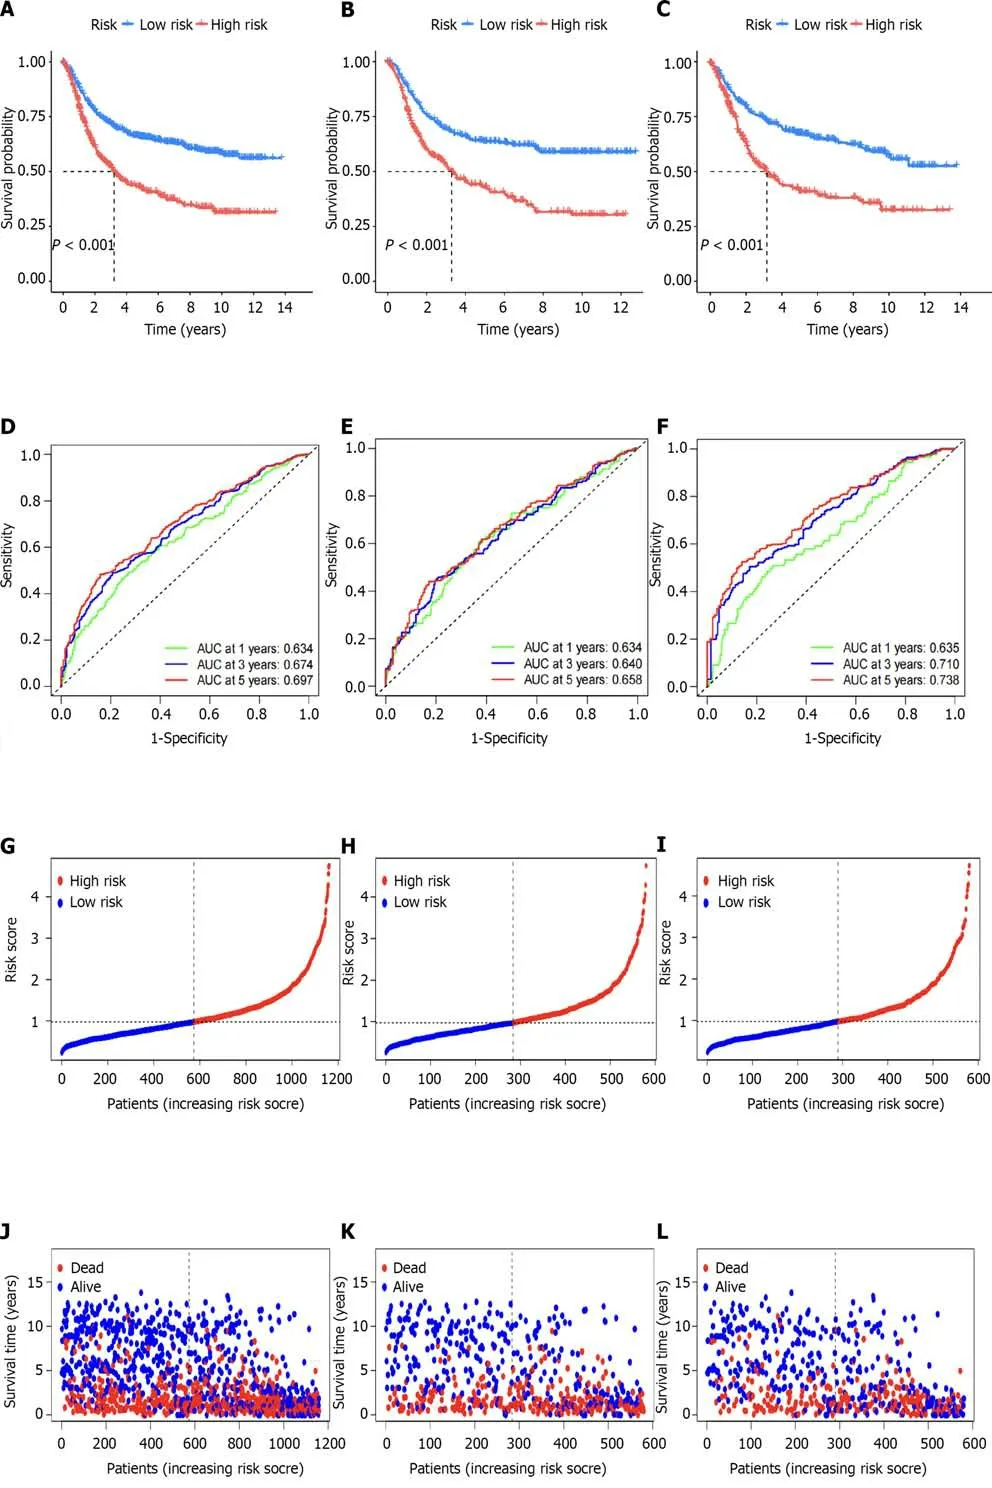
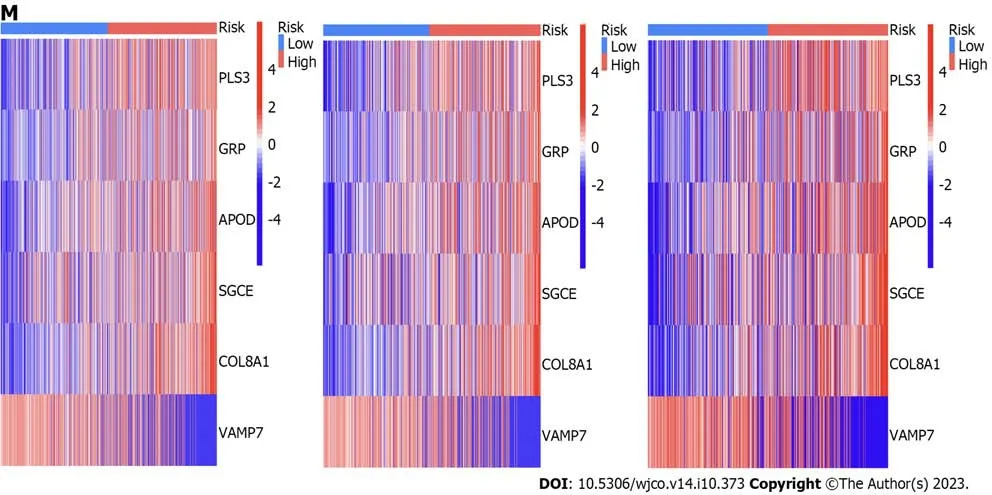
Figure 8 The accuracy of the prognostic model was verified by subgroup analysis. A-C: Survival curves between different groups are presented in panels;D-F: Show receiver operating characteristic curves between different groups;G-I: Risk curves for each group are presented;J-L: Show survival status plots for each group;M-O: Risk heat maps for each group are presented.
Our results revealed significant pathway and functional differences,as well as significantly different KEGG and GO pathways and functions between the two subtypes of disulfidptosis,mainly enriched in amino acid metabolism,TGF-β signaling pathway,pentose phosphate pathway,Wnt signaling pathway,and MAPK signaling pathway,among others.These functions and pathways may be related to the presence of GC.Indeed,previous studies have found that the TGF-β signaling pathway may be involved in the occurrence,invasion,proliferation,and metastasis of GC,affecting the prognosis of patients with GC[73-77].Furthermore,some studies have suggested that the pentose phosphate pathway may be related to the proliferation of GC cells[78].Previous studies have also found that the MAPK signaling pathway may also be involved in the occurrence,invasion,proliferation,and metastasis of GC,affecting the prognosis of GC[79-87].Additionally,some studies have found that the Wnt signaling pathway may be involved in the metastasis,migration,invasion,and progression of GC,affecting the prognosis of GC[88-94].In the current study,we also found differences in immune cell infiltration between the subgroups of disulfidptosis gene typing.Taken together,these findings and research suggest that DRGs affect various aspects of patients with GC,including amino acid metabolism,various signaling pathways,and immune cell infiltration,all of which may affect the survival or prognosis of patients with GC;however,the specific mechanisms and functions need to be further explored.
In this study,we used a risk model to score differentially expressed genes in overall,training set,and testing set samples,dividing them into high-and low-risk groups.Survival,ROC,and risk analyses were conducted for each group.The results showed that the high-risk group had a poorer prognosis than the low-risk group in all groups,and the result trend was consistent,further demonstrating the reliability of the model.
Through column line chart analysis,we revealed thatAPOD,PLS3,age,sex,and N stage represent independent risk factors affecting patient prognosis,all of which are risk factors for GC prognosis.Through column line chart analysis,we observed that the survival rates of patients at 1,3,and 5 years gradually decreased,with rates of 0.806,0.527,and 0.39,respectively;this is consistent with the trend of 1-,3-,and 5-year survival rates in previous studies on GC,further confirming the reliability of the prognostic model[95].Additionally,we found thatAPODrepresents an independent prognostic factor for GC in this model (P<0.001).Previous studies onAPODhave found that it may be involved in the construction of multiple GC prognostic and immune prediction models[96-103],which may be related to GC prognosis.In this study,we further analyzed the protein encoded byAPODin the HPA network database through immunohistochemical analysis and found that its protein expression level in GC tissues was significantly higher than that in adjacent normal tissues,further indicating significant differences inAPODbetween GC tissues and adjacent normal tissues.Overall,our results suggest thatAPODmay play an important role in the occurrence and development of GC,while its expression level may be related to the prognosis of patients with GC,further suggesting thatAPODrepresents a potential therapeutic target for GC.
We also found that the genes constituting the GC prognosis model were related to various immune cells,indicating that the DRGs may affect the immunity of patients with GC.The heatmap of the correlation between the model genes and immune cells in this study showed a significant positive correlation between disulfidptosisPLS3and resting mast cells (P<0.001).Indeed,previous studies have found a correlation between resting mast cells and GC[104,105],and it has been suggested thatPLS3[106] may also be related to GC.Through the analysis of TME differences in the prognosis model,we found differences in the Stromal Score and ESTIMATE Score in the high-and low-risk groups,with both scores found to be upregulated in the high-risk group,indicating that the risk score of the prognosis model is related to the TME of GC.Through the analysis of the relationship between the risk score of the prognosis model and TMB,MSI,and stem cell correlation,we found that the risk score of the prognosis model was correlated with TMB,MSI,and RNAss.These results further indicate that the DRGs may be related to the immunity or immune therapy targets of TMB,MSI,and RNAss in patients with GC,which may affect the immune therapy effect and prognosis of patients with GC.Among them,MSI,an immune therapy target,has been found to affect the treatment and prognosis of patients with GC in previous studies[107-111],while the significant correlation between the GC risk prediction model established in this study and MSI indicates that MSI-targeted treatment may be meaningful for the treatment and prognosis of patients with GC.This further indicates the correlation between disulfidptosis and the immunity or immune therapy targets of patients with GC.

Figure 9 Further analysis of prognostic models to screen potential therapeutic targets. A: Presents a column line chart;B: Shows a calibration curve;C: Presents a heat map of the correlation between model genes and immune cells;D:The survival curve of APOD in gastric cancer was significantly different between high and low risk groups (P <0.05);E: The survival curve of PLS3 in gastric cancer was shown between high and low risk groups,and the results suggested that the difference was not significant (P >0.05).
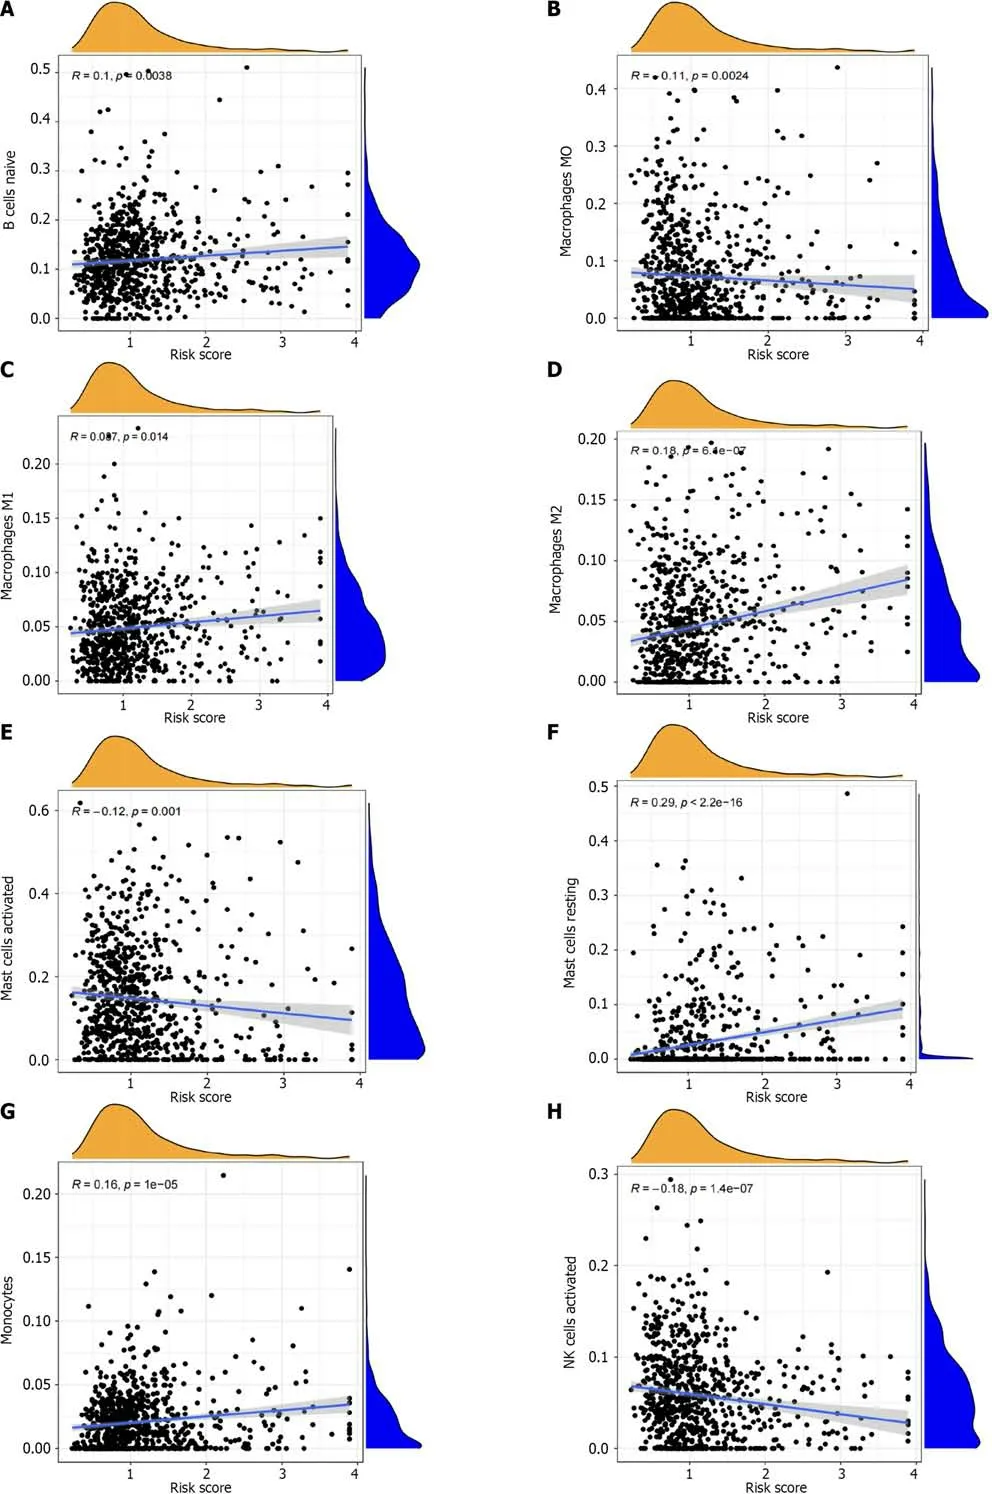

Figure 10 The correlation between immune cells and risk scores is analyzed. A: There was a positive correlation between B cells naive and risk score;B: The result shows that macrophages M0 is negatively correlated with risk score;C: The results showed that macrophages M1 was positively correlated with risk score;D: The results showed that macrophages M2 was positively correlated with risk score;E: There was a negative correlation between mast cells activated and risk score;F: The results showed that mast cells reting was positively correlated with risk score;G: There was a positive correlation between monocytes and risk score;H: There was a negative correlation between natural killer cells activated and risk score;I: There was a negative correlation between plasma cells and risk score;J: There was a positive correlation between T cells CD4 naive and risk score;K: It showed that T cells follicular helper was negatively correlated with risk score;L: There was a positive correlation between T cells gamma delta and risk score;M: There was a positive correlation between T cells regulation and risk score.


Figure 11 The correlation between the prognostic scoring model and tumor microenvironment,microsatellite instability,and RNAss,as well as drug sensitivity analysis,is presented. A: Shows the tumor microenvironment score for high and low-risk groups;B and C: Present waterfall plots of mutations for high and low-risk groups;D: Analyzes the differences in tumor mutation burden between high and low-risk groups;E: Shows the relationship between tumor mutation burden and risk score;F and G: Present microsatellite instability analysis for high and low-risk groups;H: Analyzes the correlation between stem cells and risk score;I and J: Present drug sensitivity analysis for drugs such as Bosutinib and Bryostatin.
The results of our drug sensitivity analysis revealed that 89 drugs,including Bosutinib and Bryostatin,were significantly correlated with the sensitivity of GC treatment.Previous studies have found that Bryostatin can enhance the effect of paclitaxel in the treatment of GC[112],while others have found that Bosutinib may inhibit the migration of GC cells[113].These results suggest that Bosutinib may have therapeutic effects on GC.The high sensitivity of Bosutinib and Bryostatin to GC found in this study suggests that they may be useful drugs for the treatment of GC.Therefore,the 89 drugs represented by Bosutinib in this study may be potential drugs for the treatment of GC.
CONCLUSION
In conclusion,our findings suggest that the DRGs and their submolecules may have an impact on immunity,immunotherapy targets,signaling pathways,and drug sensitivity in patients with GC.DRGs,includingPDLIM1,FLNA,MYH10,MYL6,andDSTN,may be related to the prognosis of GC.Six genes,namely,PLS3,GRP,APOD,SGCE,COL8A1,andVAMP7,constituted a prognostic model of GC associated with DRG.APODmay be a potential target for the treatment of GC,while 89 drugs,including Bosutinib and Bryostatin,may be potential drugs for the treatment of GC.

Figure 12 The immunohistochemical analysis of the APOD gene based on human protein atlas is presented. A: Tumor tissue;B: Normal tissue.T: Tumor tissue;B: Normal tissue.
ARTICLE HIGHLIGHTS
Research background
Gastric cancer (GC) is one of the most common malignant tumors,although its pathogenesis remains unclear.
Research motivation
For the first time,in the current study,we constructed a new GC prognostic model based on the sub-group analysis of disulfidptosis-related genes (DRGs) and explored treatment targets and sensitive drugs.
Research objectives
The aims of this study were to explore a new GC prognostic model based on the sub-group analysis of DRGs and explore treatment targets and sensitive drugs.
Research methods
In this study,a bioinformatics strategy was used to extract GC-related data from The Cancer Genome Atlas and Gene Expression Omnibus databases,while R software (version 4.2.1) was used for correlation analysis.
Research results
Through the above analysis,we found that the didisulfidptosis-related gene may be related to the prognosis of GC.Six genes,namely,PLS3,GRP,APOD,SGCE,COL8A1,and VAMP7,constitute a predictive model for GC prognosis.APOD is a potential therapeutic target.Bosutinib and other drugs are suitable for the treatment of GC.
Research conclusions
The results of this study indicate that didisulfidptosis is related to the prognosis and treatment of GC.Additionally,APOD can be used as a potential therapeutic target for GC.
Research perspectives
Six genes,namely,PLS3,GRP,APOD,SGCE,COL8A1,and VAMP7,constitute a predictive model for GC prognosis.
APOD is a potential therapeutic target for treating GC.Bosutinib and other drugs are suitable for the treatment of GC,although this requires further confirmation through molecular biology and clinical experiments.
FOOTNOTES
Author contributions:Li Q contributed to this work;Yin LK and Li Q prepared for the figures and tables;and all authors have approved the final manuscript.
Institutional review board statement:The data supporting the results of this study are available from Gene Expression Omnibus database (GSE84433andGSE26253) and the expression data,clinical data,mutation data,and copy data related to gastric cancer from The Cancer Genome Atlas database.
Conflict-of-interest statement:The authors deny any conflict of interest.
Data sharing statement:No additional data are available.
Open-Access:This article is an open-access article that was selected by an in-house editor and fully peer-reviewed by external reviewers.It is distributed in accordance with the Creative Commons Attribution NonCommercial (CC BY-NC 4.0) license,which permits others to distribute,remix,adapt,build upon this work non-commercially,and license their derivative works on different terms,provided the original work is properly cited and the use is non-commercial.See: https://creativecommons.org/Licenses/by-nc/4.0/
Country/Territory of origin:China
ORCID number:Qian Li 0009-0006-9250-0521;Long-Kuan Yin 0000-0001-5974-5443.
S-Editor:Qu XL
L-Editor:A
P-Editor:Zhang XD
杂志排行
World Journal of Clinical Oncology的其它文章
- What should be the future direction of development in the field of prostate cancer with lung metastasis?
- Splenic lymphangioma masquerading as splenic abscess managed by laparoscopic splenectomy: A case report
- Hub genes and their key effects on prognosis of Burkitt lymphoma
- Treatment of patients with multiple brain metastases by isolated radiosurgery: Toxicity and survival
- Classification of patients with metastatic colorectal cancer into consensus molecular subtypes into real-world: A pilot study
