Vector fiber Bragg gratings accelerometer based on silicone compliant cylinder for low frequency vibration monitoring
2023-12-02WenyuHu胡文玉ZhuoChen陈卓JiangshanYou尤江山RuohuiWang王若晖RuiZhou周锐andXueguangQiao乔学光
Wenyu Hu(胡文玉), Zhuo Chen(陈卓), Jiangshan You(尤江山), Ruohui Wang(王若晖),Rui Zhou(周锐),†, and Xueguang Qiao(乔学光),‡
1School of Physics,Northwest University,Xi’an 710127,China
2Engineering Research Center of Optical Fiber Well Logging Technology for Oil and Gas Resources,Universities of Shaanxi Province,Xi’an 710127,China
Keywords: fiber-optic sensor,vector accelerometer,silicone compliant cylinder,orientation recognition
1.Introduction
The acquisition of vibration acceleration signals has significant applications in multiple fields, such as oil and gas seismic exploration,[1–3]real-time identification of human activity,[4]structural health monitoring and damage detection,[5]on-line monitoring of airborne air duct leakage,[6]automotive, and aerospace applications.[7]However, with the development of science and technology,scalar information no longer meets the needs of real-time and accurate acceleration measurement.Therefore,vector sensing is receiving more and more widespread attention and favor in the era of big data and artificial intelligence due to its recognizability of vibration direction.
Vector sensing is an important technology in scientific measurement and engineering applications.Vector vibration sensing has emerged as a prevalent technique in the field of oil and gas exploration and development.The technique allows for rapid and precise detection of seismic waves,which in turn enables accurate delineation of geological formations.[8,9]This approach is extremely important for advancing the oil and gas industry.Therefore, it is important to complete vector sensing to improve the accuracy of exploration monitoring while ensuring the accelerometer has high sensitivity.
Fiber optic sensors are devices that integrate sensing and transmission capabilities, and are widely used due to their high temperature resistance,[10]small size,resistance to electromagnetic interference, and distributed detection.[11]Fiber optic sensing technology has experienced rapid development recently and has been used to acquire vibration acceleration vector signals.
In recent years,accelerometers based on fiber Bragg gratings(FBGs)have been extensively fabricated and researched.Generally, these accelerometers are constrained to measuring acceleration along a single axis, rendering it challenging to ascertain the directionality of the actual acceleration signal,particularly when the source of vibration is obscure.They demand at least two orthogonal FBG accelerometers for vector vibration measurements,adding to the complexity of the sensing system.To obtain two-dimensional (2D) acceleration information,Liet al.integrated two vibration sensors to detect the sensitivity of accelerometer.The cantilever, which was fabricated directly onto the SMF,was utilized to measure the deviation induced by vibration.[12]Although this accelerometer is small in size and high in accuracy, it cannot directly obtain the actual vibration angle during random vibration,and the issue of acceleration vector sensing remains to be explored.Zhanget al.used 2D FBG accelerometers made by flexible hinges, which can eliminate cross interference, but have low sensitivity on small size structures,13 pm/g and 40 pm/g,respectively, which cannot be directly applied in narrow space and the orientation recognition accuracy is limited.[13,14]To develop vector accelerometers with small dimensions, different types of fiber optic gratings have been used to make accelerometers, such as cladding fiber gratings,[15]tilted fiber gratings,[16]and eccentric fiber gratings.[17]These methods take advantage of the sensitivity of the cladding mode to the direction of vibration, where the refractive index is changed,to accomplish vector vibration sensing.These sensors are small in size and high in accuracy, unfortunately, they exhibit susceptibility to the refractive index of the surrounding medium and possess demanding packaging requirements.For this problem, vector vibration sensing can be achieved using just one multicore fiber (MCF) (especially a seven-core fiber),[18]and the intermediate core can also provide temperature compensation,[19]allowing multiplexed multipoint measurements to be accomplished in confined spaces.[20]However, each core of the MCF is very close together, resulting in low sensitivity and angular resolution, and the cost of fanin/out(FIFO)device required for sensing with seven-core fiber is expensive.In addition, fusion loss and inter-core crosstalk can occur during the fusion of multi-core fiber grating and FIFO.
In this paper, we propose and demonstrate a vector accelerometer using FBGs embedded in a unidirectional cylindrical shell.The sensor is fabricated with silicone rubber material in a single casting process, achieving size miniaturization.The sensitivity and natural frequency of the sensor is obtained by experiments, which shows that it is possible to acquire vector information of vibration acceleration directly through monitoring the wavelength shifts of FBGs.We have studied the orientation recognition capabilities of the 2D sensor by subjecting it to acceleration signals at different orientations within the range of 0◦–360◦.Furthermore, the natural frequency and sensitivity of the accelerometer can be optimized by adjusting the material and structural parameters of the sensor.The FBGs embedded in the compliant silicone cylinder possess the characteristics of wavelength division multiplexing, indicating the potential for cascading of the sensor.Therefore, the performance of the sensor can be greatly improved,and promoted its application in engineering,especially in narrow spaces.
2.Structure design and sensing principle
2.1.Fiber sensor structure design
Figure 1(a) shows a schematic diagram of the 2D accelerometer.The silicone compliant cylinder(SCC)is used as a cantilever beam,and the FBGs are embedded in the groove on the surface of the cylinder to sense the strain.One end of the cylinder is constrained and immobilized, while the other end is free to vibrate.When the sensor receives vibration excitation from random directions,the free end is swung in a 2D plane perpendicular to the axis of the cylinder,and the vibration signal is coupled to FBG.
In order to enhance the sensing performance, structural optimization techniques are used to increase the transfer coefficient through stress concentration.The research focuses on the improvement of the sensing area,by analyzing it using finite element simulation.The methods to increase the natural frequency of the sensor include decreasing the length(L)of the cylinder,increasing the radius(R)of the cylinder,reducing the cylindrical radius (r) of the fluted section and increasing the length (l) of the fluted section.By optimizing the size of the accelerometer,we have determined the sensor parameters for the natural frequency.As shown in Fig.1(b),when a sine wave vibration signal is applied to the sensor perpendicularly,near the fixed end is where the maximum strain values are observed.To enhance the sensing performance, three FBGs are embedded at the location close to the fixed end as the sensing element.The specific structural parameters used in the experiment are recorded in Table 1.

Table 1.Parameters of the FBG accelerometer.
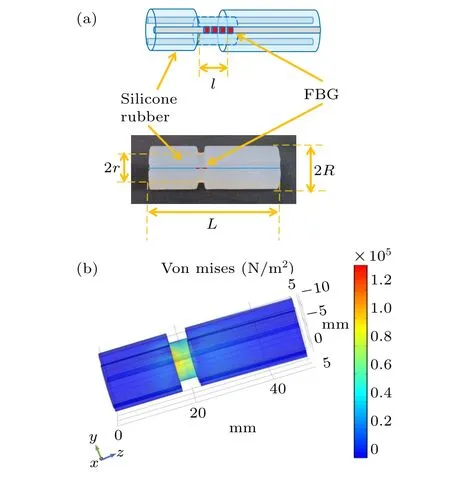
Fig.1.(a) Schematic diagram of the accelerometer.(b) Stress–strain simulation of the vibration response.
2.2.Principle of orientation recognition
During the static bending,the Bragg wavelength will occur a red shift when one side of the fiber is stretched.The Bragg wavelength shift(∆λ)can be mathematically expressed as
whereneffandΛare the effective refractive index and period of the fiber Bragg grating,respectively,andpeis the effective photoelastic coefficient, relative to the effective refractive index of fiber and the Poisson’s ratio of fiber.kis a constant describing the strain coefficient.εiis the strain variable of thei-th fiber,which can be expressed by the following formula:[20]
whereεmis the bending strain due to the vibration(εm=d/R).As shown in the Fig.2,dis the distance between the fiber and the neutral plane,Ris the curvature radius of the fiber bending,ηis the strain transfer coefficient from the silicone compliant cylinder to the fiber,αiis the included angle between thei-th fiber and the bending strain direction(i=1,2,3),andεtis the thermal strain caused by temperature.[19]The strain of three FBGs uniformly embedded in the cylinder can be expressed as
Therefore,the total strain caused by bending driven fiber of the silicone compliant cylinder is
since the optical fibers are embedded at regular intervals, the temperature strain independent ofεtcan be calculated as follows:
By combining the above formulas,the static bending orientation can be obtained as
Actually, fiber acceleration variation is dynamic bending, the sensor should have a directional response trend similar to static bending.During the process of vibration detecting,the fiber is continuously bent in two opposite directions within a period of acceleration variation.[21]Therefore, the response period of acceleration direction includes the response period of two static bending orientations, and the vibration orientation can be represented as
According to Eq.(7), once the initial position information is determined,the direction of the unknown vibration can be calculated as soon as the wavelength shifts of the three FBGs are obtained simultaneously.Besides, combining the precalibrated sensitivity with the wavelength shift of the respective fiber, the magnitude of the vibration acceleration can be expressed as
whereaθrepresents the value of acceleration, ∆λirepresents the Bragg wavelength shift of the FBG ini-th fiber,Sirepresents the sensitivity calibrated for thei-th fiber, andθrepresents the azimuth of the vibration acceleration.Therefore, in practical applications,real-time monitoring of the FBG wavelength shift can obtain vector information of vibration acceleration on the two-dimensional plane, including the orientation and amplitude of acceleration.
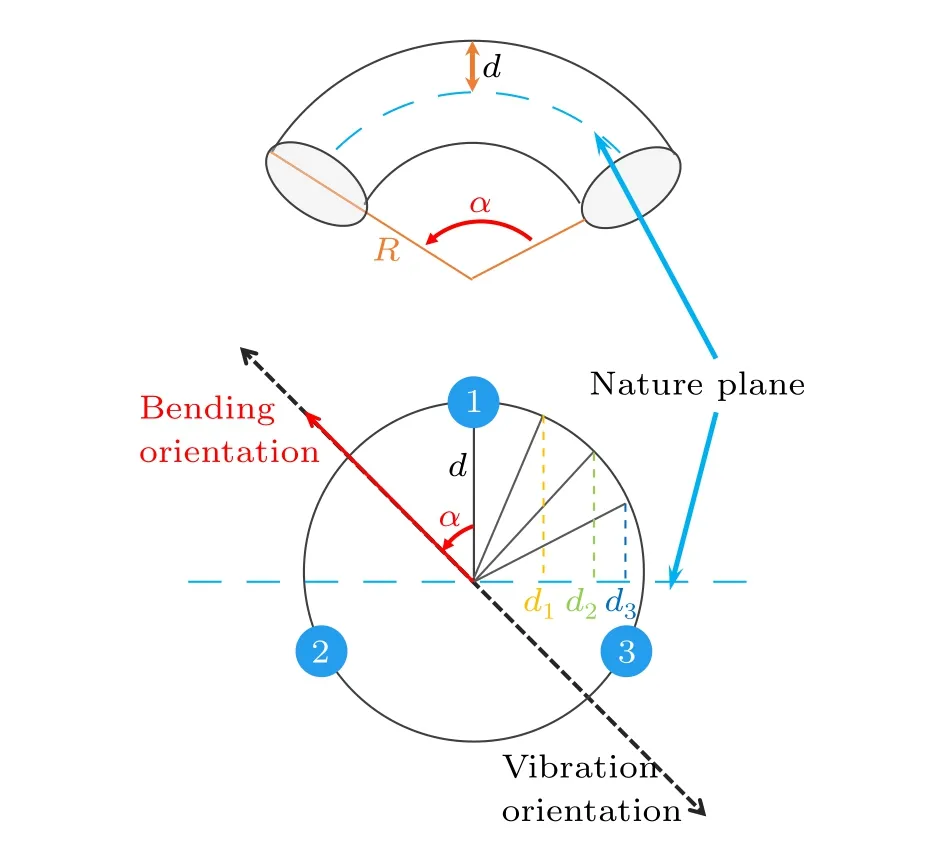
Fig.2.Orientation recognition principle with defined parameters.
2.3.Fabrication methods
The main structure of the sensor is composed of SCC.As shown in Fig.3,firstly,the two-component room temperature sulfide silicone rubber is mixed in the proportion of 1:1.Then,put it into a vacuum box to discharge the bubbles.Finally,pour it into the mold coated with mold release agent (silicone oil)in advance.After 24 h curing at indoor temperature,the mold is released and the SCC shown in step 4 in Fig.3 is obtained.There are three grooves with a diameter of 1.5 mm evenly distributed on the surface of the SCC,and their cross sections are shown in Fig.3.To better transfer the strain from the SCC to the FBGs,the FBGs coated with silicone drop-glue primer(KJ-770D) are placed in the groove of the SCC.The appropriate prestress is applied,and the optical fiber inscribed with FBG is glued to the SCC with silicone glue(KJ-998-3T),and the main component of the sensor is completely fabricated by standing for 24 h at room temperature.
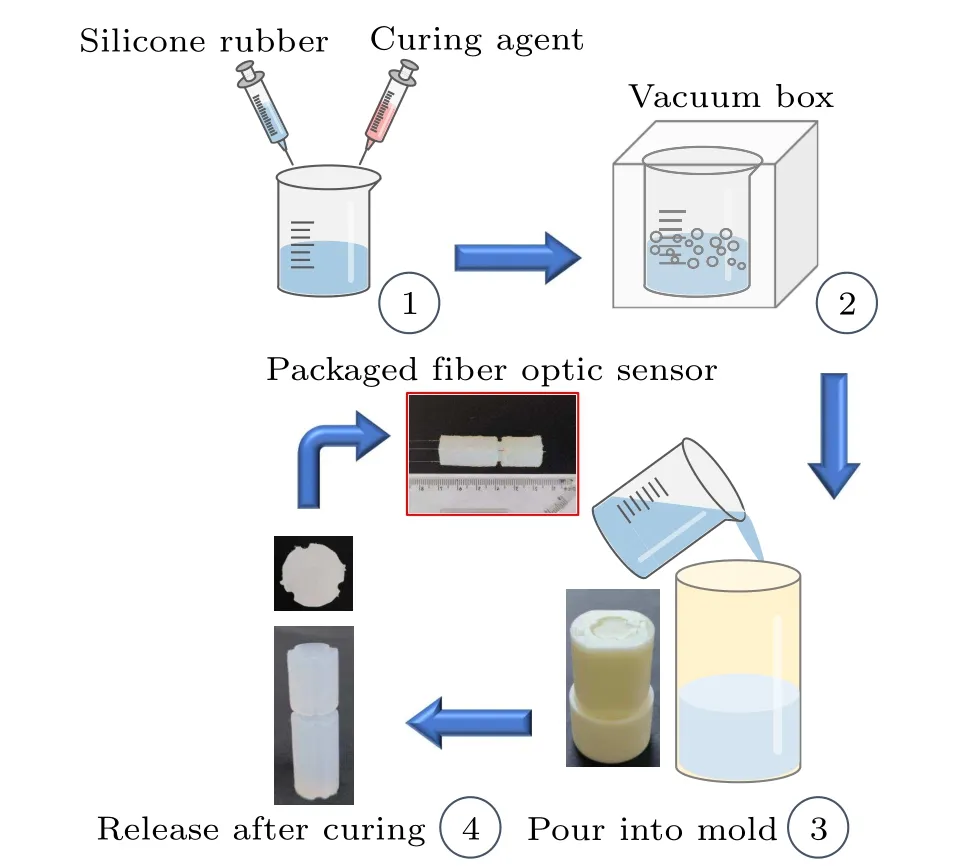
Fig.3.Fabrication process of the sensor.
3.Experimental setup and discussion
Figure 4 shows the experimental configuration of the 2D axial fiber-optic accelerometer.To reduce the gravity effect,a dedicated clamp affixes the sensor to the shaker with horizontal excitation imparted by an exciter.A signal generator produces a signal that is amplified by a power amplifier before being transmitted to the excitation machine.By means of computer-controlled regulation, both the amplitude of the vibration stimulus acceleration and the frequency can be set.FBGs are inscribed by a femtosecond laser,and their reflection spectra are shown in Fig.5.The FBG interrogator (LUNA,SM130, USA) can measure the wavelength shift of the FBG accelerometer resulting from mechanical vibrations.
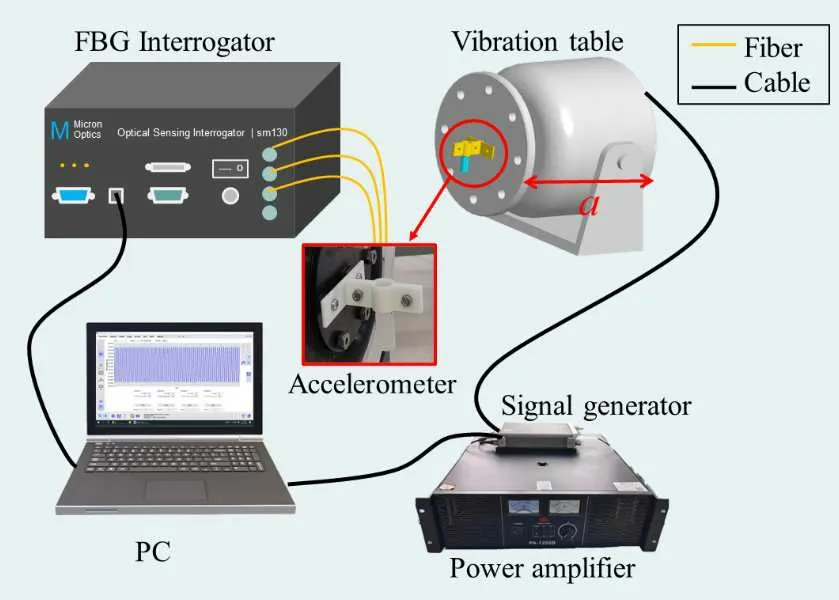
Fig.4.Vibration test and signal acquisition system.
3.1.Performance of silicone rubber
As the main material for manufacturing accelerometers,the inherent properties of the sensor research have significant implications on its performance, particularly key indicators such as the working frequency range and sensitivity of the accelerometer.The relationship between Shore hardness and Young’s modulus is a second order polynomial.[22]Increasing the Shore hardness of a material correspondingly increases its Young’s modulus.Therefore,as the Shore hardness increases,the natural frequency of the accelerometer increases and the sensitivity decreases.In the experiment, we use the same mold to manufacture three sensors with constant dimensions ofR=7.5 mm,H=25 mm,andL=35 mm.These sensors are made of silicone rubber materials with Shore hardness of 30, 50, and 60 respectively.With the condition of maintaining the vibration acceleration excitation at 2 m/s2, frequency scanning tests are performed on the sensors.The experimental results show that the inherent frequencies of these three sensors are 42 Hz, 64 Hz, and 84 Hz, respectively.As shown in Fig.6, the working frequency range of the sensors gradually increases with the increase of the hardness of the silicone rubber.In addition,with the vibration excitation of the frequency of 22 Hz,the linear sensitivity responses of these three sensors are 34.6 pm/g, 100.2 pm/g, and 108.3 pm/g, respectively.As expected,compared with the consistent structural column,silicone rubber materials with lower hardness can provide higher sensitivity.Therefore,in practical applications,we can adjust the hardness of the sensor material (i.e., silicone rubber) to match the required operating bandwidth and sensitivity.
3.2.Frequency response analysis
Within the experimental system shown in Fig.4, the accelerometer is at an azimuth angle of 0◦.The signal generator is adjusted to sustain the exciter acceleration at 5 m/s2.To obtain the natural frequency and flat range of the accelerometer, we conduct a frequency sweep test on the sensor ranging from 20 Hz to 110 Hz with in step of 2.5 Hz.To ensure accuracy, it is advisable to increase the step size appropriately when the frequency approaches the natural frequency.Meanwhile, the wavelength shifts of three FBGs are recorded, and the amplitude–frequency response curve of the accelerometer can be obtained as shown in Fig.7.The natural frequency of the sensor is around 85 Hz, and the working flat range is between 20 Hz to 60 Hz.Since the three FBGs are embedded in a silicone rubber compliant cylinder at 120◦distributed uniformly,FBG1 is the farthest away from the neutral axis(radius distance),while FBG2 and FBG3 are relatively closer.Therefore,FBG1 has the largest wavelength shift,while FBG2 and FBG3 have smaller and equal amplitude(due to the symmetry of position).
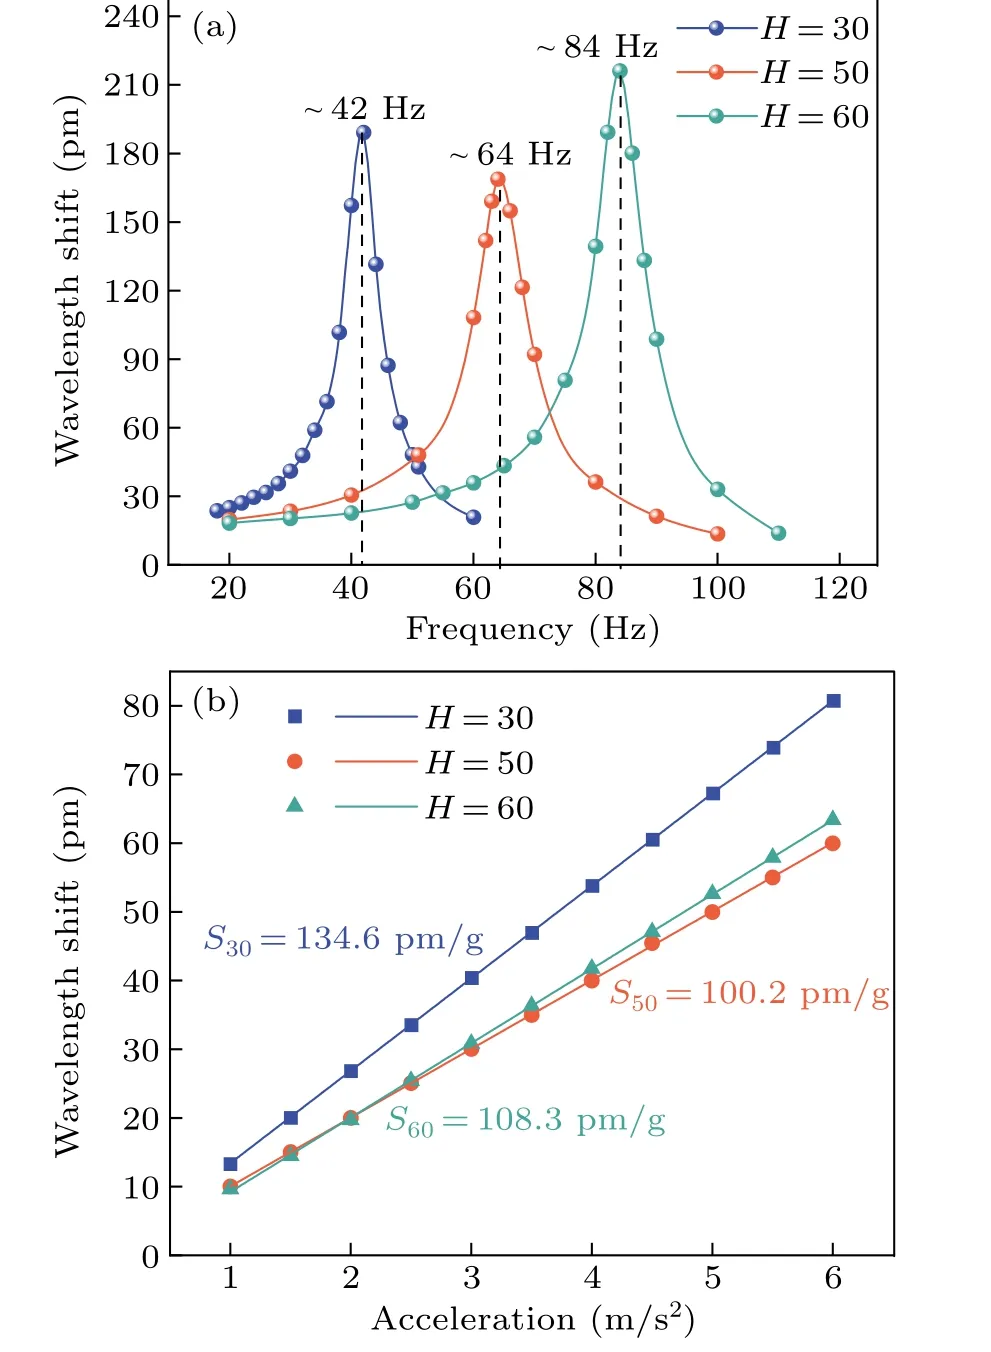
Fig.6.(a)Natural frequency response and(b)linear sensitivity response of the accelerometer under different Shore hardness scales.

Fig.7.Test curve of amplitude frequency response of accelerometer at 5 m/s2.
3.3.Linear sensitivity response test
The installation of the accelerometer remains constant throughout the experiment.As shown in the amplitude–frequency characteristics figure, the curve tends to be flat at frequencies lower than 50 Hz, which indicates this range is the normal operating range of the accelerometer.The vibration excitation signal frequency is set to remain at 30 Hz.And the acceleration is varied in step of 0.5 m/s2from 1 m/s2to 5 m/s2.As shown in Fig.8, the linear sensitivity of the sensor is obtained by linear fitting.FBG1, which is the furthest from the neutral plane,has a sensitivity of 84.21 pm/g, while FBG2 and FBG3 at symmetric positions have sensitivities of 43.46 pm/g and 42.19 pm/g respectively, which is consistent with the previous analysis.
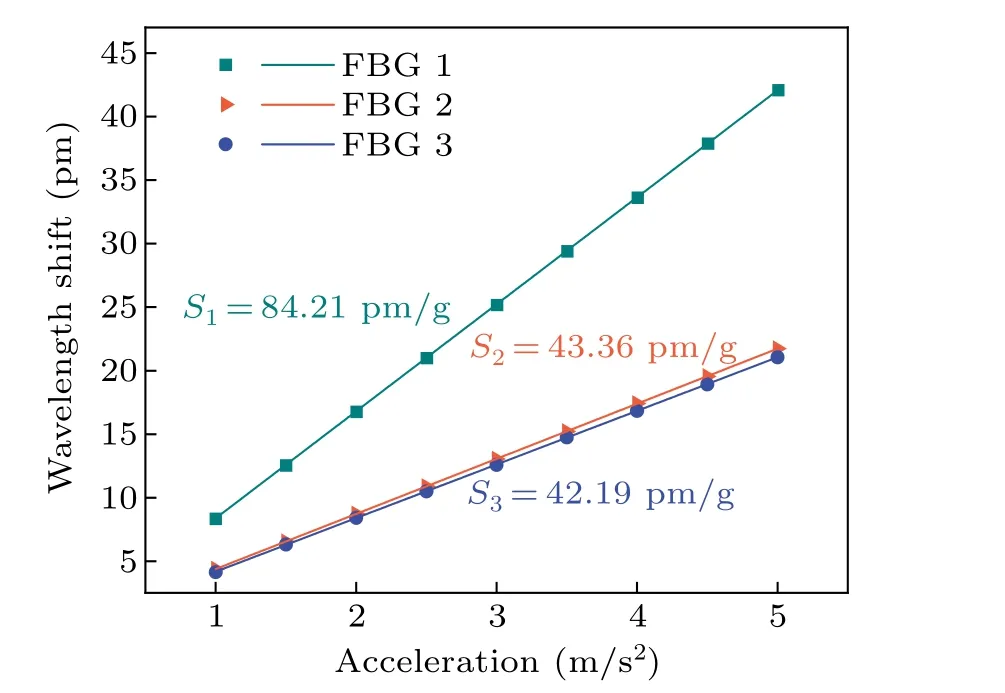
Fig.8.Linear response of the accelerometer at 30 Hz.
3.4.Orientation recognition
The sensor accurately recognizes the vector information of acceleration, including the amplitude and, especially, the orientation of the acceleration.In the experiment, sinusoidal vibration signals are generated at 30 Hz and 5 m/s2, and the silicone compliant cylinder is rotated from 0◦to 360◦in increments of 10◦.As shown in Fig.9,the relationship between orientation and FBG wavelength shift is obtained.Given that the wavelength shift is a function of the strain experienced by an individual FBG as a result of vibration,it is dependent on the distance between the fiber and the neutral plane.The results show that as the orientation of vibration changed,the distance between the fiber and the neutral plane changed, resulting in periodic changes in wavelength shift.As shown in Fig.9(a),the orientation recognition characteristic shows a sine curve in Cartesian coordinates, and the phase difference between adjacent fibers is 60◦.This is because the acceleration undergoes continuous bending toward two opposite directions during each changing cycle,resulting in a curved phase difference of 60◦and a vibration phase difference of 120◦in the output of wavelength demodulation, which corresponds to the geometric angle of the three fibers embedded in the SCC.As shown in Fig.9(b),in polar coordinates,the orientation recognition feature presents an 8 shape,which is a well-known vector recognition feature.
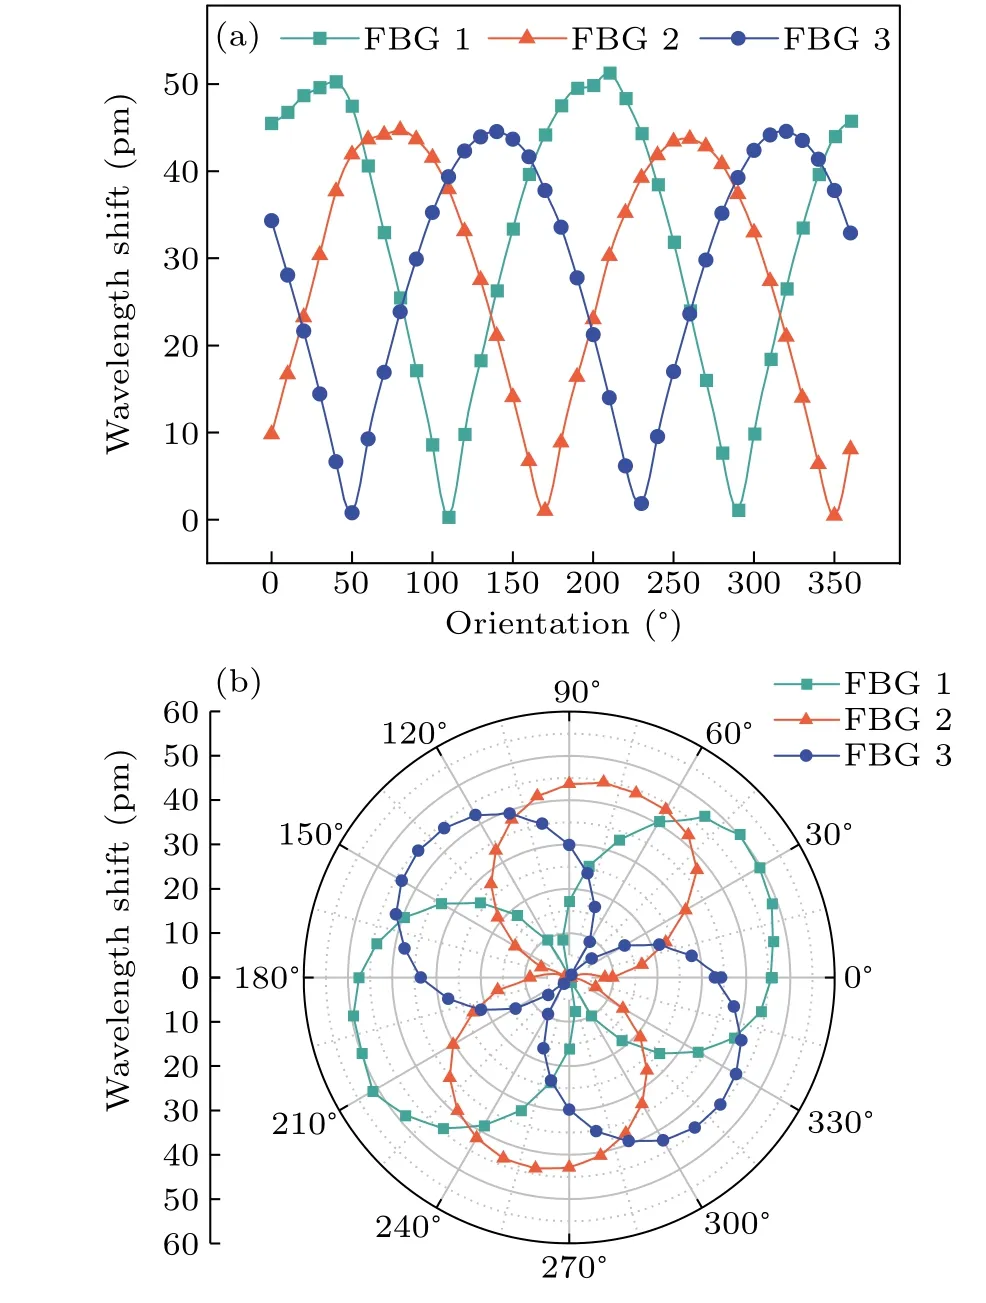
Fig.9.Orientation dependence of the sensitivities of the three FBGs:(a)Cartesian coordinates and(b)polar coordinates.
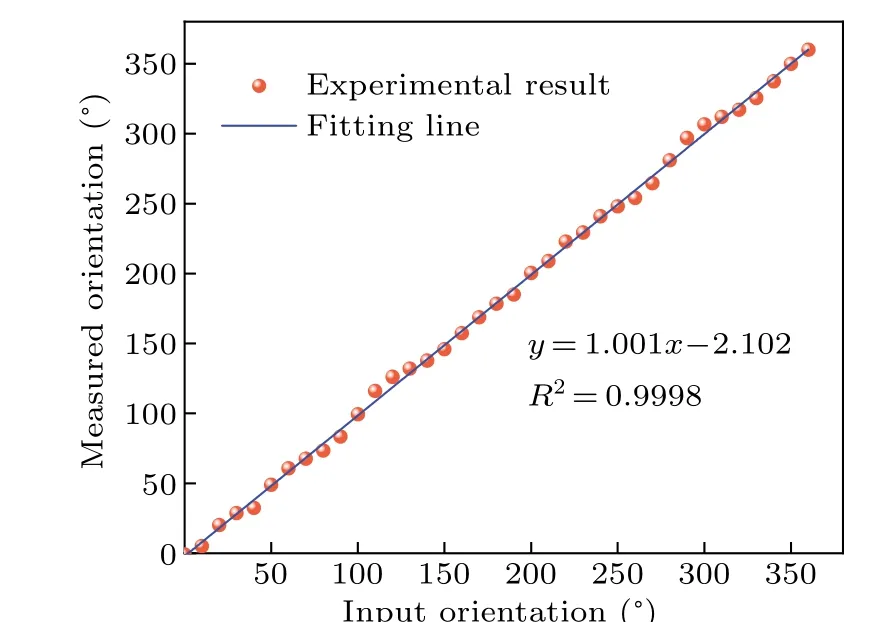
Fig.10.The input and measured orientation values obtained by orientation angle reconstruction.
According to Eq.(7),the orientation of the vibration signal can be directly identified by concurrently monitoring the wavelength shift of the FBGs.As shown in Fig.10, the orientation identification result under sinusoidal vibration excitation signals at 30 Hz and 5 m/s2is displayed.The results show that the measured orientation values have a good linear relationship with the set values, with a correlationR2of 0.9998.Experimental deviations may have occurred due to errors caused by uneven fiber embedding during the packaging process of the sensor.The quasi-periodic deviation of the measurement orientation over the input, which is mainly due to errors in the position of the fiber embedded.If this experimental process is more precisely controlled,the deviation between the measured and input values could be reduced and the quasi-periodic deviation would be reduced.
3.5.Cross interference characteristics
In addition to recognizing vector information of acceleration, the anti-interference capability is a crucial metric for assessing the performance of accelerometers.During testing,place the SCC vertically on the vibration excitation, and the direction of excitation is in the vertical direction (z-axis).A sinusoidal excitation signal is applied to the sensor,and the response of thez-axis and thex–yplane is compared,as shown in the Fig.11.The inserted figure shows the acceleration response curves of the sensor in the orthogonal direction at 30 Hz.It can be observed that the sensitivity of the sensor in the flat area of thex–yplane is 84.2 pm/g and is less than 1.2 pm/g in thez-axis direction.Consequently,the anti-lateral interference level of the sensor is below 3%, indicating excellent anti-interference capability, which is better applied to obtain vector vibration information.
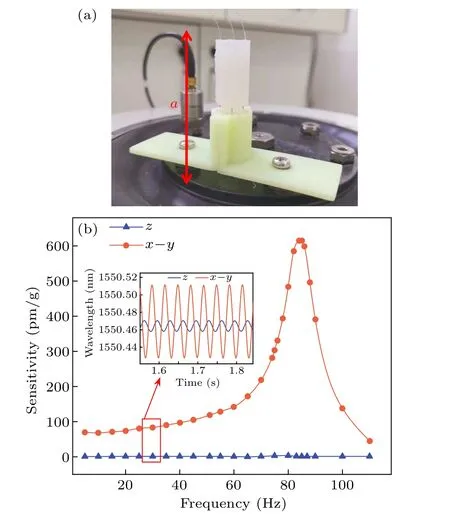
Fig.11.Cross interference test (a) physical picture and (b) amplitude–frequency response results.
3.6.Long term stability
In seismic wave detection applications, the stability of sensors is crucial, which requires that the output data of sensors have a stable response relative to changes in their input parameters or environmental conditions.High-quality accelerometers can maintain the same sensitivity over long-term application, and the range of frequency errors for measuring vibration signals will not change significantly over time.To test the stability of accelerometers, the amplitude–frequency response and linear sensitivity are tested on the first day, the 30th day, and the 60th day, respectively.As shown in the Fig.12, the flat area of FBG1 has been maintained at 20 Hz to 50 Hz,and the sensitivity of multiple sensor measurements has been maintained near 85 pm/g, except a slight deviation occurs in the natural frequency.The deviations in the experimental data may be attributed to two factors: the changes in performance caused by the aging of the silicone rubber material, and the variations in the position of the sensors during testing.The results show that the performance of the sensor did not change obviously during the two-month period,proving its good stability and reliability.
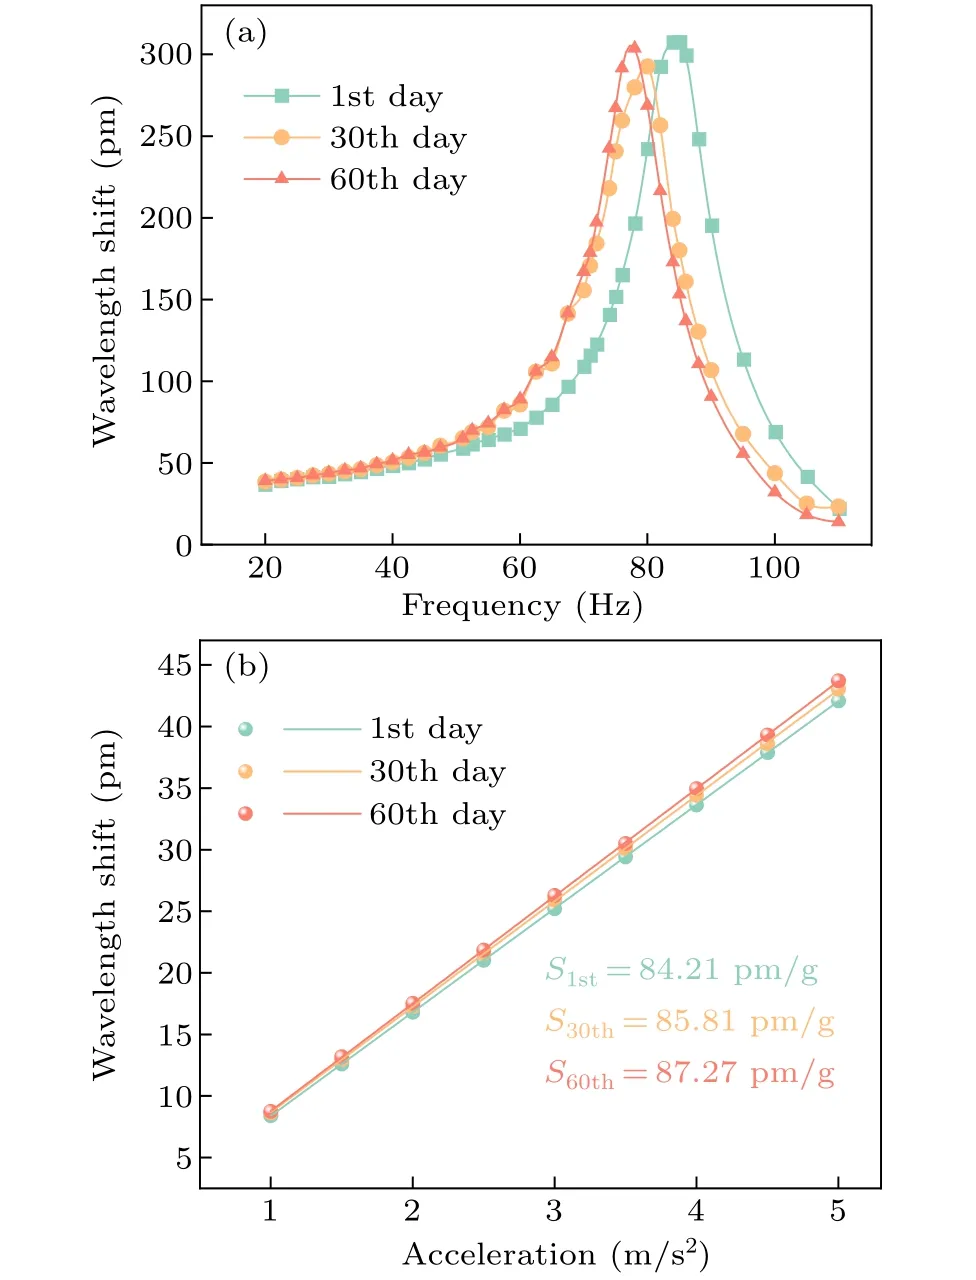
Fig.12.Stability of time variation: (a)test curve of amplitude frequency response of accelerometer at 5 m/s2;(b)linear response of the accelerometer output versus applied acceleration at 30 Hz on the first day,the 30th day and the 60th day.
4.Conclusion
This paper presents a fiber-optic vector accelerometer based on a SCC for low-frequency monitoring.The study conducts experiments to explore the material properties, frequency response, linear sensitivity, orientation recognition ability, anti-interference characteristics, and long-term stability of the sensor.Experimental results show that the working frequency range of the sensor gradually increases with the increase in the hardness of the silicon rubber, and the silicon rubber material with lower hardness provides higher sensitivity.The natural frequency of the sensor is around 85 Hz,and the working flat zone is from 20 Hz to 60 Hz.Within the working range,the FBG1 situated at the greatest distance from the neutral surface exhibits a sensitivity of 84.21 pm/g.In addition, the accelerometer is capable of detecting the orientation of random vibration within a range of 0◦–360◦,thereby obtaining vector vibration information directly.The anti-interference degree is less than 3%.Additionally, it exhibits favorable long-term stability.Therefore, the accelerometer uses FBGs sensing embedded in an SCC, has a simple structure, easy packaging and can accurately obtain the vector information of low-frequency acceleration.This research provides a new approach for monitoring of narrow space low-frequency vector vibration.With its excellent performance,fiber optic vector accelerometers have broadened application prospects in the field of seismic wave detection.
Acknowledgment
Project supported by the National Natural Science Foundation of China (Grant Nos.61927812, 61735014, and 62105261).
杂志排行

Chinese Physics B的其它文章
- The application of quantum coherence as a resource
- Special breathing structures induced by bright solitons collision in a binary dipolar Bose–Einstein condensates
- Effect of short-term plasticity on working memory
- Directional-to-random transition of cell cluster migration
- Effect of mono-/divalent metal ions on the conductivity characteristics of DNA solutions transferring through a microfluidic channel
- Off-diagonal approach to the exact solution of quantum integrable systems