Predicting recurrence in osteosarcoma via a quantitative histological image classifier derived from tumour nuclear morphological features
2023-12-01ZhanWangHaodaLuYanWuShihongRenDiarramohamedDiatyYanbiaoFuYiZouLinglingZhangZenanWangFangqianWangShuLiXinmiHuoWeimiaoYuJunXuZhaomingYe
Zhan Wang | Haoda Lu | Yan Wu | Shihong Ren |Diarra mohamed Diaty | Yanbiao Fu | Yi Zou | Lingling Zhang |Zenan Wang | Fangqian Wang | Shu Li | Xinmi Huo | Weimiao Yu |Jun Xu | Zhaoming Ye
1Department of Orthopedic Surgery,The Second Affiliated Hospital, Zhejiang University School of Medicine,Hangzhou, China
2Orthopedics Research Institute of Zhejiang University,Hangzhou,China
3Key Laboratory of Motor System Disease Research and Precision Therapy of Zhejiang Province,Hangzhou,China
4Clinical Research Center of Motor System Disease of Zhejiang Province, Hangzhou, China
5Institute for AI in Medicine,School of Artificial Intelligence,Nanjing University of Information Science &Technology,Nanjing,China
6Department of Pathology,The Second Affiliated Hospital, Zhejiang University School of Medicine,Hangzhou, China
7Department of Hematology,Shanghai General Hospital, Shanghai Jiao Tong University School of Medicine, Shanghai,China
8Bioinformatics Institute(BII),Agency for Science,Technology and Research(A*STAR), Singapore, Singapore
Abstract Recurrence is the key factor affecting the prognosis of osteosarcoma.Currently,there is a lack of clinically useful tools to predict osteosarcoma recurrence.The application of pathological images for artificial intelligence-assisted accurate prediction of tumour outcomes is increasing.Thus,the present study constructed a quantitative histological image classifier with tumour nuclear features to predict osteosarcoma outcomes using haematoxylin and eosin (H&E)-stained whole-slide images (WSIs) from 150 osteosarcoma patients.We first segmented eight distinct tissues in osteosarcoma H&E-stained WSIs,with an average accuracy of 90.63% on the testing set.The tumour areas were automatically and accurately acquired, facilitating the tumour cell nuclear feature extraction process.Based on six selected tumour nuclear features, we developed an osteosarcoma histological image classifier (OSHIC) to predict the recurrence and survival of osteosarcoma following standard treatment.The quantitative OSHIC derived from tumour nuclear features independently predicted the recurrence and survival of osteosarcoma patients, thereby contributing to precision oncology.Moreover, we developed a fully automated workflow to extract quantitative image features,evaluate the diagnostic values of feature sets and build classifiers to predict osteosarcoma outcomes.Thus, the present study provides a novel tool for predicting osteosarcoma outcomes, which has a broad application prospect in clinical practice.
K E Y W O R D S diseases, learning (artificial intelligence), surgery, tumours
1 | INTRODUCTION
Osteosarcoma is a classical primary bone sarcoma that predominantly occurs in children and adolescents [1].Immature bone or osteoid tissue produced by malignant osteoblasts are one of the typical features of osteosarcoma[2].Osteosarcoma patients are prone to relapse, and pulmonary metastasis is the most common site [3].Despite aggressive treatment,approximately one third of osteosarcoma patients initially diagnosed without metastasis have a recurrence during follow-up [4].After the introduction of neoadjuvant chemotherapy, the 5-year survival rate for localised osteosarcoma has improved to approximately 65% [3], whereas it remains less than 20% for recurrent patients [5, 6].Currently,there is a lack of clinically useful tools to predict the recurrence of osteosarcoma.Thus, early accurate prediction of recurrence and survival in osteosarcoma patients following standard treatment is of great importance to optimise treatment methods and monitoring.
With the advances in digital pathology and deep learning techniques, the application of quantitative histopathology image analysis methods in cancer diagnosis and outcome prediction has attracted the attention of many clinicians and biomedical engineering researchers [7].Although outcome prediction increasingly relies on the genomic, transcriptome and proteomic characteristics[8,9],histology remains a valued tool in predicting the outcome of cancer patients [7, 10, 11],and it also reflects the underlying molecular properties and tumour progression [12].Due to paucity of osteosarcoma,research has not been performed to predict the recurrence and prognosis of osteosarcoma by applying computational pathology.Additionally,the texture of osteosarcoma is hard, and haematoxylin and eosin (H&E)-stained whole-slide images(WSIs) of osteosarcoma differ from other solid tumours,limiting its digital application to some extent.
In the present study, we developed a fully automated workflow to extract quantitative histopathology image features,evaluated the diagnostic values of the feature sets and built classifiers to predict osteosarcoma outcomes.Moreover, we discovered unique image features that predict recurrence and validated these findings in an independent cohort.The use of the osteosarcoma histological image classifier (OSHIC) allows identification of patients who may benefit from standard treatment.Thus, the present study provides prognostic information for osteosarcoma patients.
2 | METHODS
2.1 | Patient selection
We retrospectively collected 182 chemonaive H&E-stained WSIs corresponding to 182 osteosarcoma patients who received neoadjuvant chemotherapy, surgery and chemotherapy in our hospital from 2008 to 2014.The 5-year survival rate was relatively high in the osteosarcoma patients.We selected cases that were followed for at least 5 years to improve the reliability of the results.All of the osteosarcoma H&E slides were made from paraffin blocks.The overall workflow of the present study is shown in Figure 1.In total, 32 patients were excluded due to metastasis at the initial diagnosis(n=3),low grade(n=4),lack of follow-up information(n=17)and tissue-processing artefacts (n= 8).Finally, the dataset used in this study consisted of 150 H&E-stained WSIs corresponding to 150 histologically confirmed chemonaive osteosarcoma cases.During the osteosarcoma tissue segmentation phases,15,5 and 5 slides served as the training set, validation set and testing set, respectively.During the feature extraction and selection phases, 65 slides served as the model set (Cohort 1),and 60 slides serve as the validation set (Cohort 2) (Figure 2).Recurrence of osteosarcoma was defined in this study as local recurrence or distant metastasis.All H&E slides were uniformly digitally scanned on a Leica Aperio AT2 digital scanner at 40× magnification with a pixel size of 0.25 μm.This study was approved by the Ethical Board of the Second Affiliated Hospital, Zhejiang University School of Medicine (No.I2018001273).
2.2 | Segmenting H&E images using deep learning methods
2.2.1 | Tissue segmentation

F I G U R E 1 The flowchart of the whole study.(a) Osteosarcoma H&E-stained WSIs acquisition process.(b) Classifier construction and validation.H&E,haematoxylin and eosin; WSI, whole-slide image.
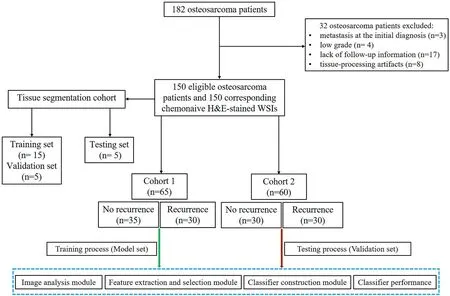
F I G U R E 2 The flow chart of selecting osteosarcoma patients for analysis.
Osteosarcoma H&E-stained WSIs from the training set(n= 15), validation set (n= 5) and independent testing set(n= 5) were reviewed and eight different tissue regions were manually delineated by pathologists.We adopted the Deep-Tissue Net method for the tissue segmentation task,which is a highly efficient method for segmenting various tissues in WSIs of various diseases [13] (Supplementary Figure 1).Figure 3 shows the flowchart of multi-tissue segmentation, including background, muscle, blood vessel/red cells, tumour necrosis,neoplastic bone mineralised tissue, neoplastic osteoid matrix,neoplastic cartilage tissue and tumour tissue.During the training phases, we repeatedly trained the Deep Tissue Net model with the training set for 100 iterations.We then used the validation set to evaluate the performance of the Deep Tissue Net model for each iteration, and we selected the best performed Deep Tissue Net model.To avoid over-fitting,we used the independent testing set to demonstrate the generalisation of the best performed Deep Tissue Net model.
The construction of the training set was crucial in the present study.The 150 × 150 size square patches were extracted from the original images.To achieve the goal of patch-wise segmentation, the training set constructed in this study included eight types of patches as indicated in the training phase (Figure 3a).Many different types of patches representing distinct tissues were extracted, serving as the training set,validation set,and independent testing set and the number of image patches applied in each set is shown in Supplementary Table 1.During the training phases, different data argument approaches, such as centre cropping, corner cropping and rotations every 60° were used for the training and validation sets.During the testing phases, the best performed DeepTissue Net was applied for classifying each patch in the independent testing set (Figure 3d).To evaluate the performance of DeepTissue Net models, we applied a confusion matrix of classification accuracy to the eight tissues(Figure 3e).
2.2.2 | Nuclear segmentation in viable tumour tissues
Segmenting eight distinct tissues in the osteosarcoma WSIs(red) allowed identification of viable tumour regions.Nuclear segmentation was then performed in the viable tumour regions.We adopted a Unet model [14] for tumour cell nuclear segmentation, and the flowchart for the Unet model is shown in Figure 4.Many studies have demonstrated the accuracy of the Unet model in performing semantic segmentation on medical images.We first downloaded a database containing nuclei annotations on pathological images of different diseases,which served as the training set (Figure 4a,b).We then randomly extracted 150 image patches with a size of 512×512 from the viable tumour regions in the validation set (n= 5)and independent testing set(n=5).We annotated the nuclear boundaries in each image patch and used them to evaluate the performance of the nuclear segmentation model.The number of image patches applied in the training set, validation set and testing set is shown in Supplementary Table 2.During the training phases,we repeatedly trained the Unet model with the training set for 100 iterations,and we used the validation set to evaluate the performance of the Unet model for each iteration.Finally, we selected the best performed Unet model.To avoid over-fitting,we used an independent testing set to demonstrate the generalisation of the best performed Unet model.

F I G U R E 3 The illustration of the Deep Tissue Net for tissues classification on osteosarcoma H&E-stained WSIs,including training(a-c),testing(d)and evaluation(e)phases.Eight tissues were marked with eight different colours(a).Eight tissues were annotated on WSIs(b),and image patches were generated for training the Deep Tissue Net(c).The original WSI is sub-divided into non-overlapping patches and is then classified into eight tissues by the trained Deep Tissue Net(d).The performance is evaluated via confusion matrices by comparing with manual annotations(e).H&E,haematoxylin and eosin;WSI,whole-slide image.

F I G U R E 4 The illustration of the Unet for nuclei segmentation in the viable tumour areas,including training(a-c)and testing(d-e)phases.512×512 size image patches and their nuclei annotations (a, b) were downloaded from TCGA and served as the training set.Viable tumour areas were sub-divided into512 × 512 size non-overlapping patches and then delivered into the trained Unet for nuclei segmentation (d, e).
During the training phases, different data argument approaches,such as centre cropping,corner cropping and rotations every 60°were used for the training setand validation set.During the testing phases, the best performed Unet was used for segmenting nuclei of each patch in the testing set(Figure 4d,e).We employed the average pixelaccuracyof eachpatch to evaluate the performance of the Unet model[14].The average pixel accuracy of the testing set was 97.54%.Thus,the use of the Unet model for nuclear segmentation in the tumour region provided a strong foundation for the subsequent feature extraction and feature selection phases.
2.3 | Feature extraction
In total, 456 quantitative histomorphometric image features were extracted from the viable tumour regions, and these image features were categorised into region-level features and cell-level features.
2.3.1 | Region-level features
Region-level features mainly contained texture features in the viable tumour region, including Grayscale (15 descriptors),Gabor(24 descriptors),Laws(25 descriptors)and Local Binary Pattern (LBP; 16 descriptors), with a total of 80 descriptors.After extracting the texture features, the corresponding mean,median and standard deviation(SD)values were measured for each image patch,resulting in a set of 240-dimensional features for an image patch.The details of the 240 texture feature descriptors have been previously described [15].
2.3.2 | Cell-level features
Cell-level features mainly contained global graph features (51 descriptors), local nuclear cluster graph (26 descriptors), nuclear shape features (100 descriptors) and nuclear orientation entropy(39 descriptors).The details of these 216 features have been previously reported [16].
2.4 | Feature selection
To select the image features most associated with recurrence within the model set(Cohort 1),we implemented two different feature selection schemes, namely minimum redundancy maximum relevance (mRMR) and Wilcoxon rank-sum test(WRST).Each method was employed in conjunction with a five-fold cross-validation scheme and run over 100 iterations within the model set to identify the top six features that maximally distinguished the two groups(recurrence group,R+and non-recurrence group, R-) [7, 17].During each iteration,we selected the top six features and obtained 600 features after 100 iterations.We then selected the six most frequent features among the 600 features to obtain stable selected features.We limited the number of features to six to avoid model overfitting and dimensionality,an issue relating to too many features with respect to the number of training exemplars [7].The selected feature dimension was set up as 10% of the number of the model set.Box and whisker plots were generated to visualise the differences of feature expressions between R+ and Rgroups [7].
2.5 | OSHIC construction
To construct OSHIC (Figure 5), we combined two feature selection schemes with five different machine learning classifiers, namely, K-Nearest Neighbour (KNN), Linear Discriminant Analysis(LDA),Quadratic Discriminant Analysis(QDA),Random Forest(RF)and Support Vector Machine(SVM).The machine learning classifiers were evaluated by applying a fivefold cross-validation scheme along with 100 iterations within the model set (Cohort 1) [7].We strictly followed the rules of stratified k-fold cross-validation.The fixed proportion of the R+ and R-examples was maintained at approximately 1:1 in each fold when the classifier was trained.According to the receiver operating characteristic(ROC)curves of the model set(Cohort 1), the best performing feature selection classification combination (OSHIC) was determined.The validation set(Cohort 2) then served as an independent testing set for validating the reliability and generalisation ability of the OSHIC.Moreover, univariate and multivariate Cox regression analyses as well as Kaplan-Meier analyses were performed to correlate the OSHIC with survival outcomes.
To improve the performance of the OSHIC model, we designed a sampling technique to determine intratumoral heterogeneity and the limited availability of training samples(Figure 5a) [12].During the training phases, 11 regions of interests (ROIs) with an image patch size of 5000 × 5000 were randomly sampled from the viable tumour regions, which provided the OSHIC model with a fresh look at each patient's histology and captured heterogeneity within the viable tumour regions [12].In addition, we trained the OSHIC using the median value of the top six features from 11 random ROIs for each patient to further account for intratumoral heterogeneity.
2.6 | Experiment parameters and computational experiment equipment
mRMR was performed using the ‘MID’ MATLAB function with default parameters.WRST was performed using the‘ranksum’ MATLAB function with default parameters.KNN was performed using the ‘ClassificationKNN.fit’ MATLAB function with NumNeighbors = 5.The RF classifier was performed using the‘TreeBagge’ MATLAB function with 100 trees.LDA was performed using the ‘ClassificationDiscriminant’ MATLAB function with diagLinear.QDA was performed using the ‘ClassificationDiscriminant’ MATLAB function with diagQuadratic.SVM was performed using the‘fitsvm’ MATLAB function with default parameters.

F I G U R E 5 The illustration of the OSHIC construction.ROIs selection phase (a), feature extraction phase (b), feature selection phase (c, d), classifier construction phase (e), and performance evaluation phase (f).OSHIC, osteosarcoma histological image classifier; ROI, regions of interest.
The following operating systems and hardware devices were used in the present study: Linux system, Ubuntu 16.04;processor, Intel(R) Core (TM) i7-6800k CPU @3.40 GHz;memory (RAM), 64.0 GB; graphics Processor Unit, RTX 2080ti 12G X4; and development tools, MATLAB R2018a,Pycharm, Pytorch and Caffe framework.
2.7 | Statistical analysis
The ROC curve was plotted to interpret the ability of the OSHIC in discriminating recurrent patients from nonrecurrent ones.The area under the curve (AUC) and accuracy at the optimal cut-off were calculated to evaluate the performance of the OSHIC as a biomarker of osteosarcoma recurrence.Overall survival (OS) was defined as the time from diagnosis to death due to any cause or last follow-up and recurrence-free survival (RFS) was defined as the time from diagnosis to local recurrence, distant metastases, or last follow-up.The Kaplan-Meier method was used to examine survival differences based on the OSHIC by the log-rank test.We performed both univariable and multivariable Cox regression analyses to identify independent survival predictors.Variables with bilateralp< 0.05 were considered statistically significant.
3 | RESULTS
3.1 | Clinical characteristics
The present study included 150 eligible patients, which were separated into three cohorts, and the detailed clinical characteristics of each cohort are presented in Table 1.Overall,there were slightly more male patients than females, with a ratio of 1.4:1.The mean age at diagnosis was 18.6 years(ranging from 5 to 61 years),and over half of the patients(n=93,62.0%)were under 18 years old.More than half of the patients(54.0%)had tumours ≥10 cm in size.Based on the cut-off time for followup in June 2019,a total of 53(35.3%)patients had died and 76(50.7%) patients relapsed (local recurrence,n= 5 and lung metastasis,n=71).The 5-year OS and RFS rates were 71.2%and 51.3%, respectively.
3.2 | Segmentation and performance evaluation
A total of 15 patients in the training set and five patients in the validation set were included for establishing osteosarcoma tissue and tumour cell nuclear segmentation models.In addition, the independent testing set (five patients) was used to evaluate the performance of these models.Representative image samplings for each of the eight tissue classes are presented in Figure 3a,b.The average classification accuracy of the DeepTissue Net for the testing set was 90.63%,and the viable tumour regions (tumour tissue) were recognised with an accuracy of 0.95 (Figure 6a).Additionally, compared with the classic deep learning neural networks, including AlexNet,VGG, and GoogleNet the DeepTissue Net was better for tissue segmentation of osteosarcoma (Figure 6).
3.3 | Tumour cell nuclear features
The box and whisker plots indicated that the top six discriminative features in the R+ and R- cases had different distributions (Supplementary Figure 2), which indicated the effectiveness of the feature extraction and selection process.The top six discriminative morphologic features identified within Cohort 1 are shown in Supplementary Table 3,including nuclear shape,nuclear orientation entropy and global nuclear graph features.The visualised differences are shown in Figure 7.The R- cases had small and similar tumour cell nuclear shapes (Figure 7c), while the R+ cases had different tumour cell nuclear shapes (Figure 7h).The direction of tumour cell nuclei in the R- cases was relatively consistent(Figure 7d),while the direction of the tumour cell nuclei in the R+ cases differed (Figure 7i).Regarding the global nuclear graph, the distribution of tumour cell nuclei in the R- cases(Figure 7e) was denser than that in the R+ cases (Figure 7j).
3.4 | Performance of machine learning combination modes
Table 2 summarises the performance results of the 10 different machine learning combination modes in the model set(Cohort 1).In the model set (Cohort 1), the SVM + mRMR combination mode, namely, OSHIC, achieved the best AUC value(0.7648)and accuracy(0.7538)in distinguishing recurrent osteosarcomas from non-recurrent osteosarcomas (Figure 8a).Furthermore,the OSHIC predicted tumour recurrence with an AUC value of 0.7289 and an accuracy of 0.7167 (Figure 8b)within the validation set (Cohort 2).

T A B L E 1 Clinical characteristics of 150 high grade osteosarcoma patients

F I G U R E 6 The quantitative evaluation of eight tissues segmentation in confusion matrix by comparing with manual annotations.Deep Tissue Net(a),Alex Net (b), VGG (c) and Google Net (d).
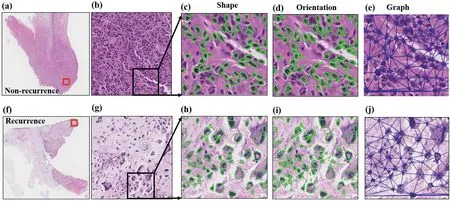
F I G U R E 7 Representative discriminative morphologic features in non-recurrent(a-e)and recurrent(f-j)osteosarcoma H&E-stained WSIs.Osteosarcoma H&E-stained images of non-recurrent(a)and recurrent(f)cases(4×).Partially enlarged images from non-recurrent(b)and recurrent(g)cases(10×).Nuclear shape difference in non-recurrent (c) and recurrent (h) cases (20×).Nuclear orientation difference in non-recurrent (d) and recurrent (i) cases (20×).Global nuclear graph difference in non-recurrent (e) and recurrent (h) cases (20×).H&E, haematoxylin and eosin; WSI, whole-slide image.
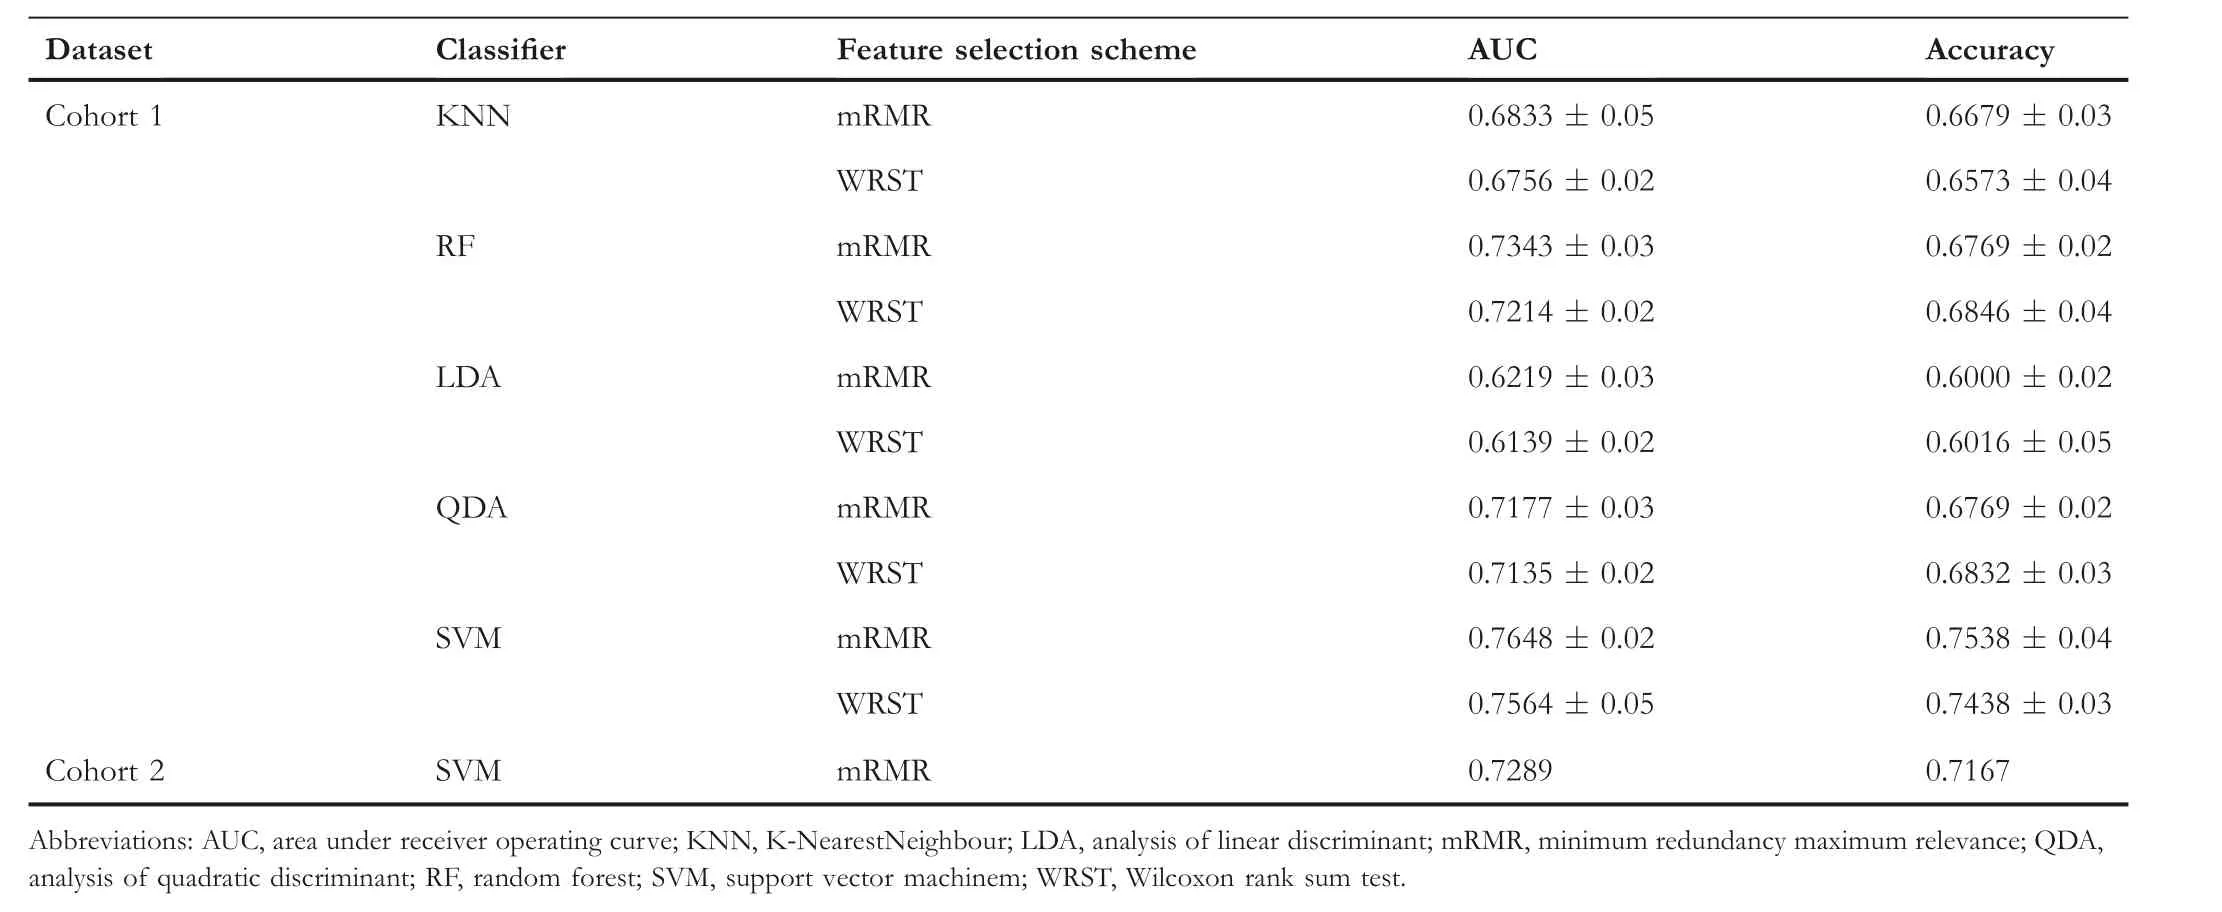
T A B L E 2 Performance of 10 machine learning combination modes for predicting osteosarcoma recurrence
3.5 | Predicting OS and RFS by the OSHIC
As shown in Figure 9, patients with OSHIC-predicted Rdemonstrated statistically improved OS and RFS in both Cohort 1 and Cohort 2.Univariate analysis revealed that the OSHIC was the only significant factor associated with OS and RFS in Cohort 1 and Cohort 2 (Table 3).Multivariate Cox regression analysis indicated that OSHIC-predicted R+ was a significant predictor for worse OS and RFS in both Cohort 1 and Cohort 2 (Table 4).
4 | DISCUSSION
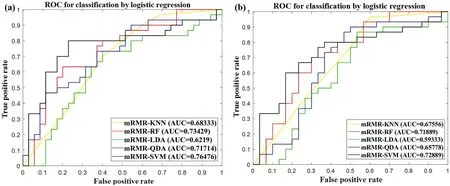
F I G U R E 8 ROC analysis of classifiers predicting recurrence in the model set(Cohort 1)(a)and the validation set(Cohort 2)(b).ROC,receiver operating characteristic.
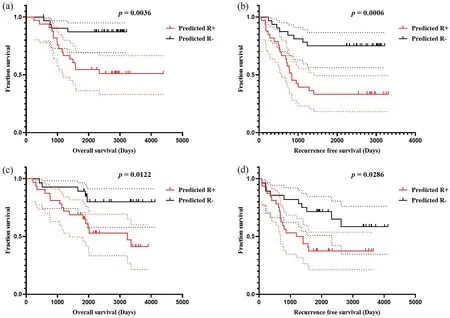
F I G U R E 9 Kaplan-Meier method estimated OS (a) and RFS (b) in Cohort 1 stratified by the OSHIC.Kaplan-Meier method estimated OS (c) and RFS(d) in Cohort 2 stratified by the OSHIC.OS, overall survival; OSHIC, osteosarcoma histological image classifier; RFS, recurrence-free survival.
Recurrence of osteosarcoma is an essential factor leading to poor prognosis of patients [18, 19].Multivariate analysis has demonstrated that recurrence is an independent survival predictor of osteosarcoma [3, 19].The standard treatment protocol for osteosarcoma, including neoadjuvant chemotherapy, surgical resection and postoperative chemotherapy,has remained unchanged for decades [2].With the significant advances in immunotherapy such as adoptive T cell transfer or checkpoint inhibitors [20–22], osteosarcoma patients, especially those with recurrent diseases, have more modern treatment options.At present, there is a lack of clinically useful tools to predict the recurrence of osteosarcoma.Therefore,there is an urgent need to accurately predict which osteosarcoma patients will have recurrent diseases following standard treatment, especially before neoadjuvant chemotherapy.It is crucial to efficiently and precisely predict subsequent therapeutic strategies for osteosarcoma patients.
AI-assisted accurate prediction of outcomes based on histological images has been increasingly utilised.With the advances in automatic analysis of histopathological WSIs,survival prediction of cancer patients based on automated image features extracted from them has received significant interest in the field of clinical medicine [23, 24].Thus far,computer-aided outcome prediction of osteosarcoma has been explored in radiomics but not in the pathological field[25,26].To our knowledge, this study is the first to explore the application of quantitative osteosarcoma pathological images for outcome prediction.Based on the tumour nuclear features,we developed a quantitative histological image classifier (OSHIC)to predict recurrence and survival of osteosarcoma following standard treatment.Moreover,we developed a fully automated pipeline to extract quantitative image features, evaluate the diagnostic utility of the feature sets and build classifiers for predicting outcomes of osteosarcoma.Thus, this study provides a novel tool for predicting osteosarcoma outcomes,which has a wide application prospect in clinical practice.
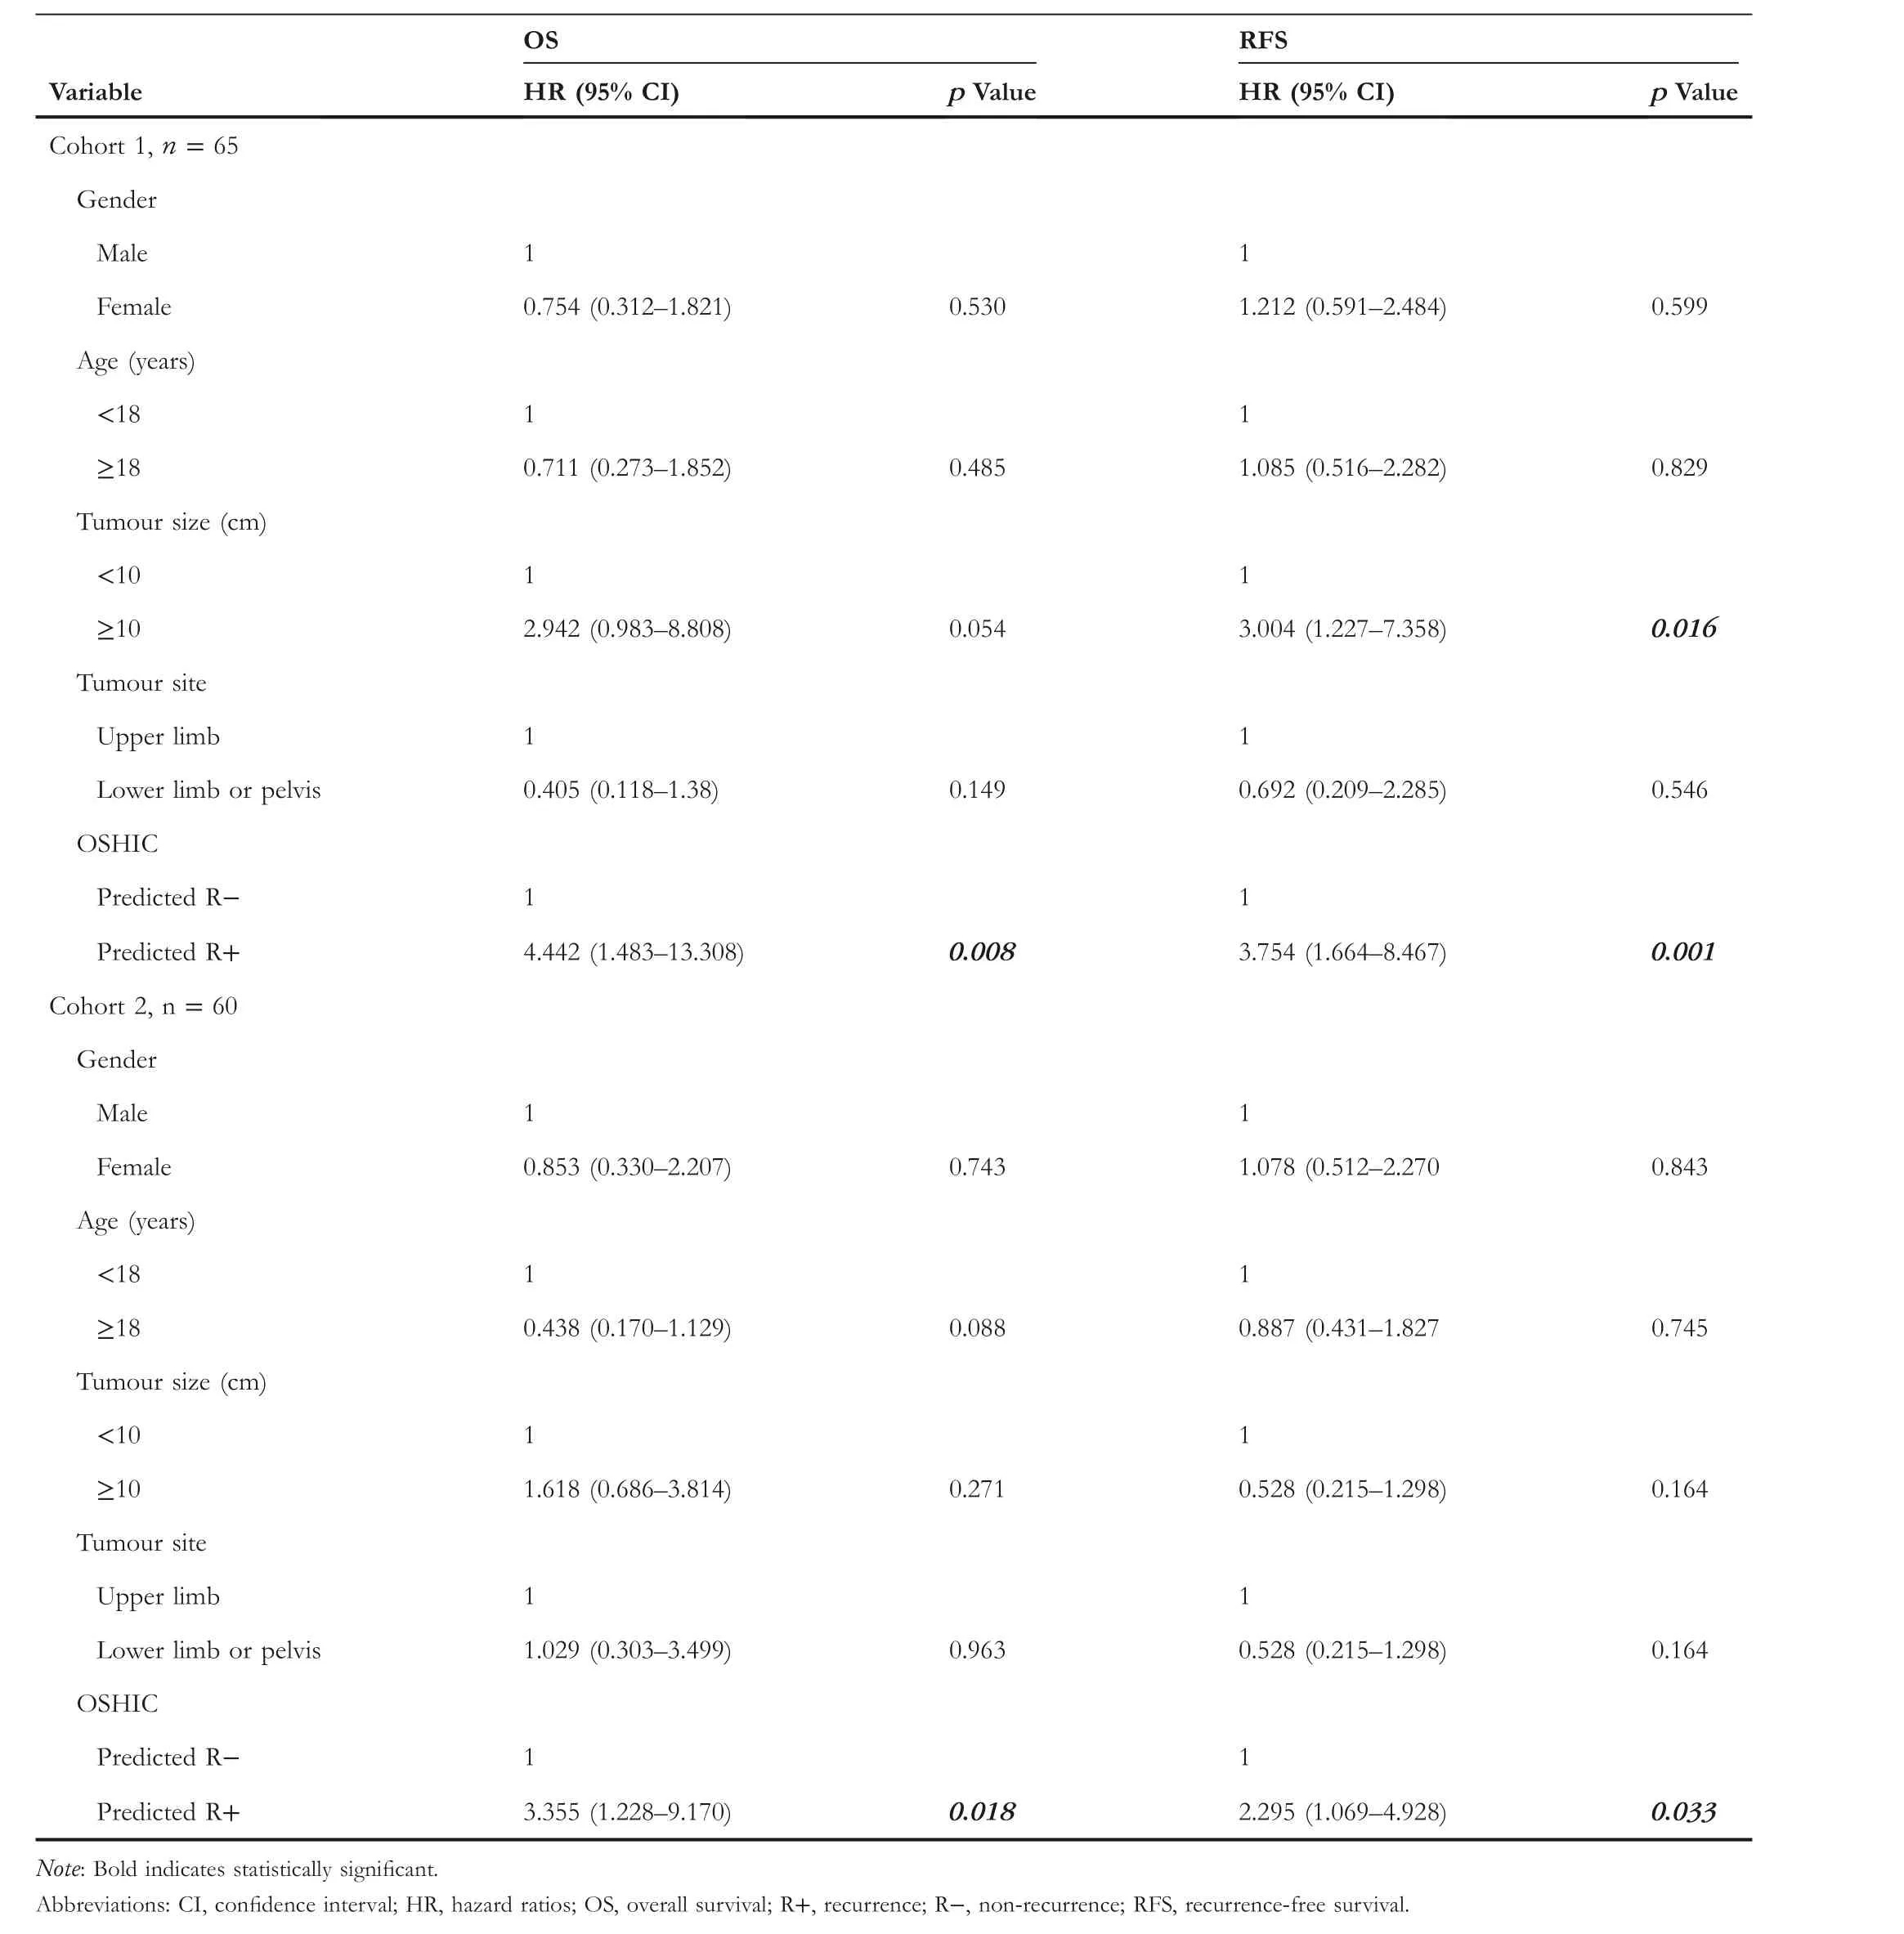
T A B L E 3 Univariate Cox analysis for OS and RFS in osteosarcoma patients
Recently, there has been significant interest in applying convolutional networks to predict recurrence or survival of cancer patients from histopathology [10, 12, 16, 27].Katheret al.[27] used a deep convolution neutral network (DCNN)to segment histopathological WSIs of colorectal cancer and extract prognosticators, and they developed a ‘deep stroma score’ to precisely predict prognosis.Ji et al.[17] developed a morphometric-based image classifier (NGAHIC) with an AUC value of 0.76 for recurrence prediction of intestinal node-negative gastric adenocarcinoma (INGA) patients, and they also confirmed the significant role of NGAHIC in survival prediction among INGA patients.Overall, predicting cancer recurrence and prognosis through pathomics is a feasible and effective method that will promote precision oncology.Recently, Zhang et al.[28] constructed a prognostic model of osteosarcoma using important immune-associated genes with AUC values of 0.634, 0.781 and 0.809 for the prognostic model in predicting 1-, 3- and 5-year survival,respectively, and they suggested that their prognostic model has a good capability for predicting survival in osteosarcoma patients.Huang et al.[29] developed a nomogram for predicting the efficacy of preoperative chemotherapy in osteosarcoma with AUC values of 0.793 and 0.791 in training and validation cohorts, respectively, and they also suggested that their model has good clinical application value.The present study indicated that the AUC values were 0.76 and 0.73 in Cohort 1 and Cohort 2, respectively, which indicated that the OSHIC has good applicability.

T A B L E 4 Multivariate Cox analysis for OS and RFS in osteosarcoma patients
Our study first established an automated pipeline to perform automated multi-tissue partitioning of osteosarcoma H&E-stained WSIs by using the DeepTissue Net method.The DeepTissue Net model presented a remarkable effect of tissue segmentation, facilitating the rapid automatic extraction of features within the representative and significant tumour tissue areas.We then used the Unet method to directly perform nuclear segmentation from the tumour tissue areas and extracted 456 features.We screened the top six meaningful features as potential predictors for recurrence prediction and further constructed the OSHIC.ROC curve analysis indicated that the OSHIC (SVM + mRMR) may serve as a promising tool for recurrence prediction.Both univariate and multivariate Cox analyses showed that the OSHIC was a significant variable of RFS and OS, and they also indicated that the OSHIC had good clinical application ability.
Interestingly, the tumour cell nuclei of recurrent osteosarcoma presented with different morphologies, disordered directions and fewer local clusters, which suggested that these tumour cells had more aggressive characteristics.The present study made several contributions to precision medicine of bone cancers.First,to the best of our knowledge,this is the first report to use computational pathology methods to predict the risk of recurrence in osteosarcoma,representing a new field of research for outcome prediction of bone tumours.Second,compared to previous studies that have only focussed on the dichotomous problem of segmenting viable tumours and other tissues[30,31],the present study applied a multi-tissue segmentation model(DeepTissue Net) to identify eight types of tissue regions in osteosarcoma H&E-stained WSIs.Further,to better understand the microscopic level of pathological information,we developed another nuclei segmentation model(Unet)for identifying large numbers of nuclei in the viable tumour regions.Finally, we constructed a quantitative histological image classifier(OSHIC)using the tumour nuclear features to predict outcomes of osteosarcoma patients following standard treatment.Therefore,clinicians may use the OSHIC to screen high-risk osteosarcoma patients for personalised treatment.
The present preliminary study had several limitations.First,the DCNN has an inevitable opaque black-box nature.Further,an external independent validation set was not created due to the rarity of osteosarcoma.In the future, we will conduct a multicentre study and include more osteosarcoma cases to further verify these findings and improve the OSHIC.Although this study had certain shortcomings,it contributed to the precision research on osteosarcoma.
5 | CONCLUSIONS
Based on routine H&E-stained slides, we first developed and demonstrated a fast and reliable segmentation model for automatically classifying osteosarcoma tumour tissues.We then developed the OSHIC by integrating six nuclear features extracted from the segmented tumour regions to predict recurrence in osteosarcoma patients.This model obtains good performance and provides rapid and objective survival predictions of osteosarcoma patients.However, further improvement and validation are required in the future.
ACKNOWLEDGEMENTS
This study was supported by the China Postdoctoral Science Foundation (2021M692792), National Natural Science Foundation of China (82103499, 81872173, 82072959, U1809205,61771249, 91959207, 81871352), Natural Science Foundation of Jiangsu Province of China (BK20181411), Natural Science Foundation of Zhejiang Province (LD21H160002), and Medical and Health Science and Technology Plan of Department of Health of Zhejiang Province (WKJ-ZJ-1821).
CONFLICT OF INTEREST
The authors declare no potential conflicts of interest.
DATA AVAILABILITY STATEMENT
Requests for access to study data should be directed to the corresponding authors for consideration, and can be provided pending appropriate institutional review board approvals.
ORCID
Zhaoming Yehttps://orcid.org/0000-0001-5951-5840
杂志排行
CAAI Transactions on Intelligence Technology的其它文章
- Fault diagnosis of rolling bearings with noise signal based on modified kernel principal component analysis and DC-ResNet
- Short‐time wind speed prediction based on Legendre multi‐wavelet neural network
- Iteration dependent interval based open‐closed‐loop iterative learning control for time varying systems with vector relative degree
- Thermoelectric energy harvesting for internet of things devices using machine learning: A review
- An embedded vertical‐federated feature selection algorithm based on particle swarm optimisation
- An activated variable parameter gradient-based neural network for time-variant constrained quadratic programming and its applications
