Geotechnical and GIS-based environmental factors and vulnerability studies of the Okemesi landslide, Nigeria
2023-10-24OluwkemiBolnleAKINTANJohnsonAdedejiOLUSOLAOlniyiPtrickIMOLEMoyosoluwOdunyoADEYEMI
Oluwkemi Bolnle AKINTAN, Johnson Adedeji OLUSOLA, ,Olniyi Ptrick IMOLE, Moyosoluw Odunyo ADEYEMI
a Department of Geography and Planning Science, Ekiti State University, Ado Ekiti, Nigeria
b Department of Geology and Mineral Sciences, Crawford University, Igbesa, Ogun State, Nigeria
Keywords:Rainfall-induced landslide Landslide hazards Slope materials Rainfall Geomorphology Vulnerability zone Okemesi-Ekiti(Okemesi)
A B S T R A C T
1.Introduction
Landslide is a geological hazard typically associated with extreme events such as earthquakes, heavy rainfall,volcanic eruptions, changes in groundwater level, etc.Whether these events occur alone or in combination, they can potentially damage the slope environment (Lee et al., 2019).According to Bujang et al.(2008) and Gbadebo et al.(2021), rainfall-induced landslide has resulted in deaths, destroyed infrastructure worth billions of dollars, and hampered economic development in many countries around the world.However, over 80.00% of landslide is at least partially caused by human intervention such as poor slope management practices.
Rainfall-induced landslide is one of Nigeria’s most recent natural disasters (Ige et al., 2016).Many studies have shown that rainfall intensity or duration, slope material nature, weathering, and permeability are central to rainfallinduced landslide in Nigeria (e.g., Msilimba and Homes, 2005; Igwe, 2015; Gbadebo et al., 2021).According to Coe (2017), the adequate assessment of climate change activities, particularly rainfall, is critical in the management and mitigation of rainfall-induced landslide.Brand et al.(1984) showed that deeply weathered rocks that form slope materials are prone to down-slope displacement, particularly after prolonged rainfall.
Though landslide can occur anywhere in the world, regional geology, hydrogeology, and geomorphology often determine their mechanisms, impacts, and management measures.Landslide hazards are often localized, implying why mitigation techniques must also take into account the peculiarity (geology, geomorphology, and rainfall) of the landslide; this, however, does not mean there are no universal management measures (Igwe and Una, 2019).
Remote sensing and GIS tools play critical roles in the investigation and zonation of landslide hazards.These tools are useful for the characterization and mapping of landslide.Remote sensing images are not only helpful with acquiring information about past and present local landslide, but also important in identifying landslide hazard zones (Chauhan et al., 2010).Studies such as Ayalew and Yamagishi (2005), Ohlmacher (2007), and Chauhan et al.(2010) have employed landslide mapping zones to assess the influencing factors and sensitive areas of landslide.Quantitative and qualitative approaches are common methods used for evaluating and delineating landslide hazards.In the qualitative method, the experts may assess the landslide susceptibility zones based on their experience.Experts can also predict the vulnerability of the area based on the similar geological and geomorphological characteristics that the area shares with existing landslide (Ayalew and Yamagishi, 2005).Multi-criteria decision is another approach, which uses proper database to accurately identify and determine the potential landslide areas.
Currently, Nigeria has no map or guideline to assess and predict landslide hazards because there is little information about the impact of rainfall on local landslide and slope stability.Equally, predicting the landslide occurrence is difficult without a systematic database of past landslide occurrences, because such predictions require a large amount of data and complex analysis.Ayodele and Odeyemi (2010) and Bamisaiye (2019) have analyzed the Okemesi landslide (Southwest Nigeria) to determine its geotechnical properties.However, this study, in addition to investigating the geotechnical properties of the Okemesi landslide, also applied the tools of remote sensing and GIS to identify the causes of the Okemesi landslide.Moreover, this study differs from the previous studies mentioned above by employing remote sensing and GIS tools to investigate how rainfall and other intrinsic and extrinsic factors can trigger landslide.Therefore, the objectives of this study are to identify the geological and geotechnical factors that may trigger the landslide in Okemesi, assess the impacts of landslide on people and communities, and estimate the possibility of future landslide occurrence in the study area.The results of study can provide information to develop guidelines and maps for assessing landslide hazards in Nigeria, develop effective landslide mitigation and prevention strategies, and prepare disaster management plans for subsequent landslide occurrence.This study will fill the knowledge gap regarding the impact of rainfall on landslide and slope instability in Nigeria.
2.Materials and methods
2.1.Study area
Okemesi-Ekiti (also known as Okemesi; 07°50′24′-07°51′00′N, 05°07′12′-05°07′48′E) is a town located in Ijero Local Government Area of Ekiti State, Southwest Nigeria (Fig.1).According to the 2006 Nigerian Census(National Population Commission of Nigeria, 2016), Okemesi has a population of approximately 16,700.The town is predominantly inhabited by the Yoruba ethnic group.The town has a tropical rainforest climate characterized by high humidity and heavy rainfall, and experiences rainy season from April to October and dry season from November to March of the next year.The topography of the town plays a significant role in the local climate and weather patterns, as well as the occurrence of landslide.The region is also home to a variety of vegetation,including rainforests, grasslands, and agricultural lands.
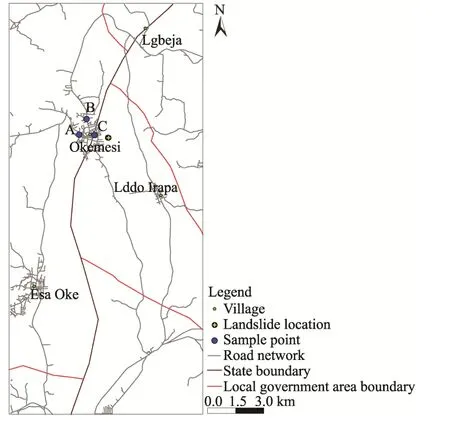
Fig.1.Overview of the study area and locations of sample points.
2.2.Geological setting
The Okemesi fold belt is part of the Ife-Ilesha schist belt, which is the geology of the study area (Fig.2).The rocks are Southwester part of Nigeria’s Pre-Cambrian to Late Proterozoic basement rocks, which are also part of the larger West African Shield (Rahaman, 1976; Okunlola and Okoroafor, 2009; Fagbohun et al., 2017; Ayodele,2020).The Ife-Ilesha schist belt is highly deformed, with visible folding, refolding, fractures, and shear zones.The shear belt that comprises meta-sedimentary, metavolcanite, gneiss, and older granite rocks with shear zones (N-S to NNE-SSW trend), is congruent with the Trans-Saharan Belt’s Neoproterozoic Hoggar shear zones (Klemm et al.,1984; Fagbohun et al., 2017).
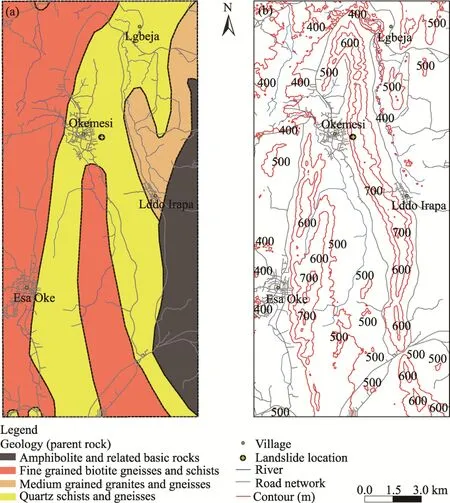
Fig.2.Distribution of geology (a) and contours (b) of the Okemesi landslide area.
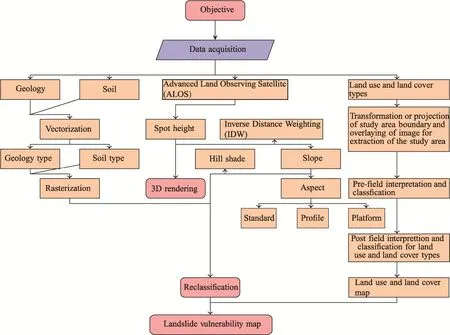
Fig.3.Flowchart showing the procedure of drawing landslide vulnerability map in Okemesi using remote sensing and GIS technologies.
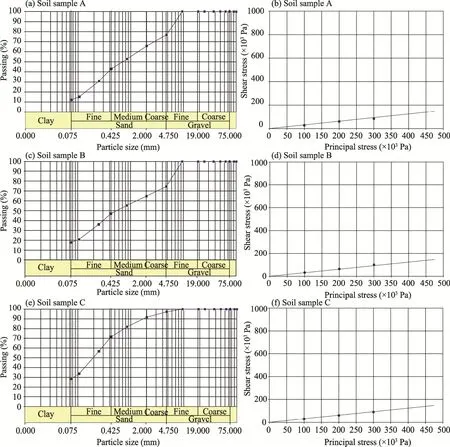
Fig.4.Grain size distribution of soil samples A (a), B (c), and C (e) and direct shear plot of soil samples A (b), B(d), and C (f).
2.3.Field investigation
Okemesi landslide occurred on 24 September 2017.The landslide has a release area length of 500.0 m and an average length of 200.0 m.While the landslide has an average width of 50.0 m (the horizontal extent of soil and rock movement that occurs downhill during the landslide event), the landslide site has an average depth of 3.0 m and the materials were released during the landslide disaster.This attribute is very critical in determining the volume of materials displaced during the landslide.The horizontal distance of soil and rock movement from the top of the slope to the bottom of the slope is 700.0 m, and the total surface area of the landslide is 8.5 km2, which is the product of the total length and the average width of the landslide.In addition, the release area (the portion of the slope that actually failed) is 2.5 km2.The average volume of the landslide is 0.75×10³m3, being the product of the release area and the depth of the slip surface.The volume of materials displaced by the landslide is estimated to be 1144.51 m3.The slope angles of these displaced residual materials are between 45.00° and 75.00°.The velocity of the landslide was is quick but caused no fatalities (Ayodele, 2020).Three soil samples were randomly collected at depths of 0.5 m from three sample points (A, B, and C; Fig.1) within the Okemesi landslide area.Representative samples of rocks and disturbed soil samples were then retrieved, stored, and appropriately labelled in polyethene bags.
2.4.Data sources and research methods
2.4.1.Data sources
We used both the primary and secondary data in this study.The primary data came from measurements and observations during field investigation, and the secondary data were sourced from the Advanced Land Observing Satellite (ALOS) dataset and a clipped-out Landsat scene of Okemesi and environs.The Okemesi landslide mapping was primarily based on ALOS dataset on 20 August 2007 (provided by the Alaska Facility) and Landsat 8“Operational Land Imager_Thermal Infrared Sensor (OLI_TIRS)” data on 10 January 2019 (provided by the United States Geological Survey and Earth Science Data Interface).Table 2 presents the various data types and sources.

Table 2Data types and sources.
2.4.2.Grain size analysis
The soil samples from the Okemesi landslide area were sent to Trevi Foundations, a geotechnical company in Nigeria, to classify and determine their engineering properties.For grain size analysis, about 200 g of sub-samples were introduced into a set of stacked sieves, which are fixed to the vibrator.The size of each sieve was measured about 20 min after vibration of the sieve stack.The results were thereafter plotted in order to classify and determine the engineering properties of the displaced slope materials.
2.4.3.Direct shear test
We conducted direct shear test of soil samples in order to determine their shear strength parameters.Specifically,each soil sample was placed in a shear box assemblage of the direct shear machine before normal (vertical) and shear (horizontal) load were applied.The shear, load, and normal displacements were then recorded.The cohesion and angle of the friction were derived from the plot of shear strength and normal stress, respectively.The calculation formula is as follows:
where,qfis the quantity of sand;fis the normal stress applied to the soil sample;Nsis the normal displacement(mm);sis the shear strength of the soil sample; andAis the cross-sectional area of the shear box (mm²).The angle of the friction of slope materials was determined by plotting a graph ofNsagainstqf.For sand materials, the angle of the friction usually ranged from 26.00° to 45.00°, increasing with the relative density of compaction.
2.4.4.Collapsibility test
We conducted collapsibility test to find out the possibility of soil collapse in response to different changes in soil water content.The criterion for the evaluation of soil collapsibility proposed by Abelev (1948) was used to conduct the collapsibility test:
where,δzis the collapsibility coefficient;zis the void ratio during soil saturation; Δeis the void ratio before soil saturation;eLis the void ratio during saturation; andLrefers to the condition of saturation.The value of Δegreater than 2.00% suggests that the material is susceptible to collapse.
Soil collapsibility coefficient is a measure of the susceptibility of soil to significant volume reduction or deformation when subjected to an increase in applied stress.Soil void ratio is the ratio of volume of voids to the volume of solids by the change in applied stress, which represents change in void ratio per unit increase in stress.
2.5.Rainfall analysis
Monthly rainfall data (2001-2017) and daily rainfall data (2017) of the closest synoptic station to the study area were provided by the Nigeria Metrological Agency (NiMET) in Ado-Ekiti, Nigeria.Some of rainfall data were recorded during the first annual peak, which was accompanied by thunderstorms in July, while the others were recorded in September, after a short dry season, often known as the August break.The data were used to analyze rainfall pattern and the influence of daily cumulative rainfall on the triggering of landslide.The study area has a bimodal rainfall pattern that is characterized by high rainfall intensity, frequency, and amount, belonging to the Guinea climatic zone.
2.6.Development of landslide inventory
Previous research usually used landslide inventory to analyze landslide susceptibility, landslide hazard zones, and the various factors that contribute to the occurrence of landslide (Guzzetti et al., 1999).Figure 3 shows the the procedure of drawing landslide vulnerability map.This study used ArcGIS 10.5 software (Environmental Systems Research Institute, Inc., California, the United States) to analyze how environmental factors (such as soil characteristics, geology, land use and land cover type, aspects, curvature, slope, and rainfall distribution) influence landslide.Based on the relationship between landslide and environmental factors, we evaluated these factors by calculating their weights, and then verified the results and further reclassified them to determine landslide vulnerability.Whatever environmental factors were used, such factors should be operational and measurable(Ayalew and Yamagishi, 2005).
During field investigation, GPS was used to determine and label the location of land use and land cover type,drainage networks and streams locations, in order to develop the landslide susceptibility map.All maps of environmental factors were converted into raster figures with the same coordinate system (Universal Transverse Mercartor Grid System (UTM) zone 31°N).
Figure 3 shows the assessment flowchart and data inventories used for this study, which included aspect, geology,curvatures, soil characteristics, and metadata.The inventories were also used to analyze landslide susceptibility areas for slope, aspect, altitude, geology, soil texture, distance from lineament, distance from road, and land use and land cover type.
To generate the hazard susceptible map of the study area, we firstly conducted a vulnerability analysis by constructing a surface representation of the terrain.The 3D grid-based digital model can provide an instant view and nature of the terrain, which was created at 12.5 m intervals and interpolated using ArcScene.Subsequently, using the weighted overlay tool in ArcGIS 10.5 at an influence of 25.00%, we employed an equal percentage influence algorithm (Sun et al., 2023) to weigh and combine each of soil, geology, slope, and land use and land cover type in order to generate the landslide vulnerability map (see Table 3).The terrain map used for the hazard vulnerability analysis was created using the grid-based Digital Elevation Model (DEM).Based on the basic geographical principle that things are closer and more similar, we used inverse distance weighting (IDW) method to interpolate grid-based DEM (Kannan and Singh, 2020).
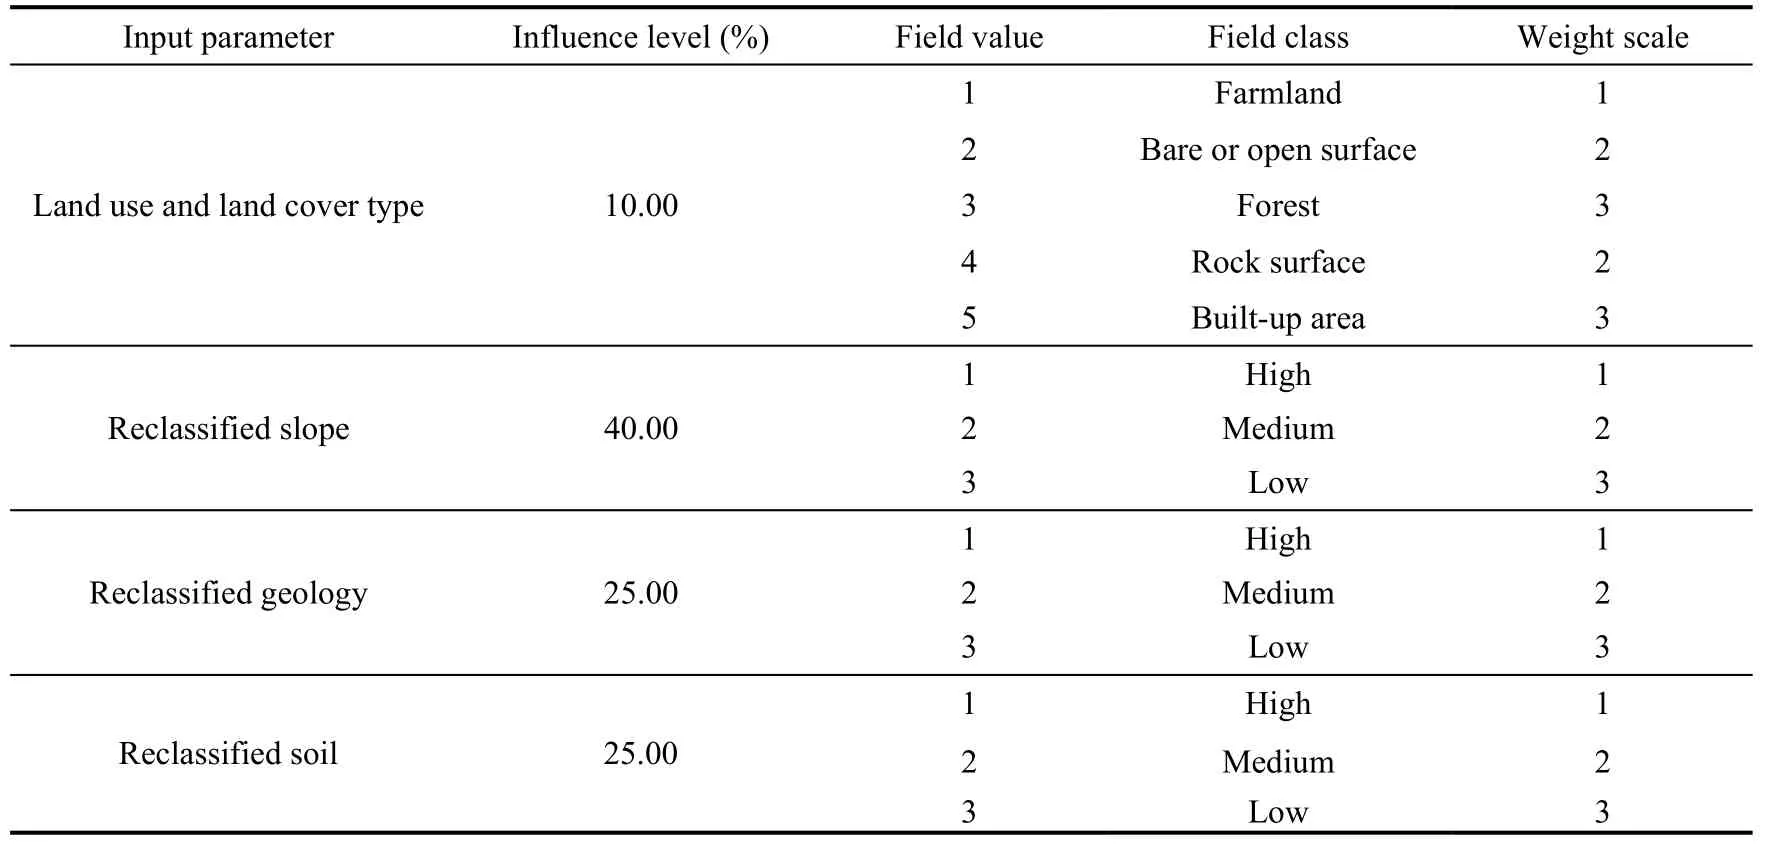
Table 3Landslide vulnerability map.
3.Results and discussion
3.1.Geotechnical analysis
Results of the geotechnical analysis in the Okemesi landslide area are summarized in Table 4.The grain size analysis of the soil in the landslide area showed that the slope materials comprised 17.14% gravel, 59.31% sand,and 19.48% fines.Figure 4 showed that sand dominated the slope materials and the area can thus be classified as poorly graded gravely sand, which has strong implication for landslide occurrence.The wet density of the soil varied between 2.01 and 2.11 mg/m3.Stress diagrams of direct shear test of soil samples (A, B, and C) to normal stress at 0.10×10⁶, 0.20×10⁶, and 0.30×10⁶Pa are also presented in Figure 4.The poorly graded gravely sand and the reduced low shear strength indicated that the soil in the study area are susceptible to landslide.The high percentage of sand and collapsibility potential in soil sample C indicated a higher risk for slope instability compared to soil samples A and B.Average angles of shearing resistance and cohesion index of the soil were observed to be 17.00° and 0.20×10³Pa, respectively.The collapsibility potential of slope materials ranged from 6.65% to 12.62%,showing that the study area has a high to very high potential to occur landslide again.
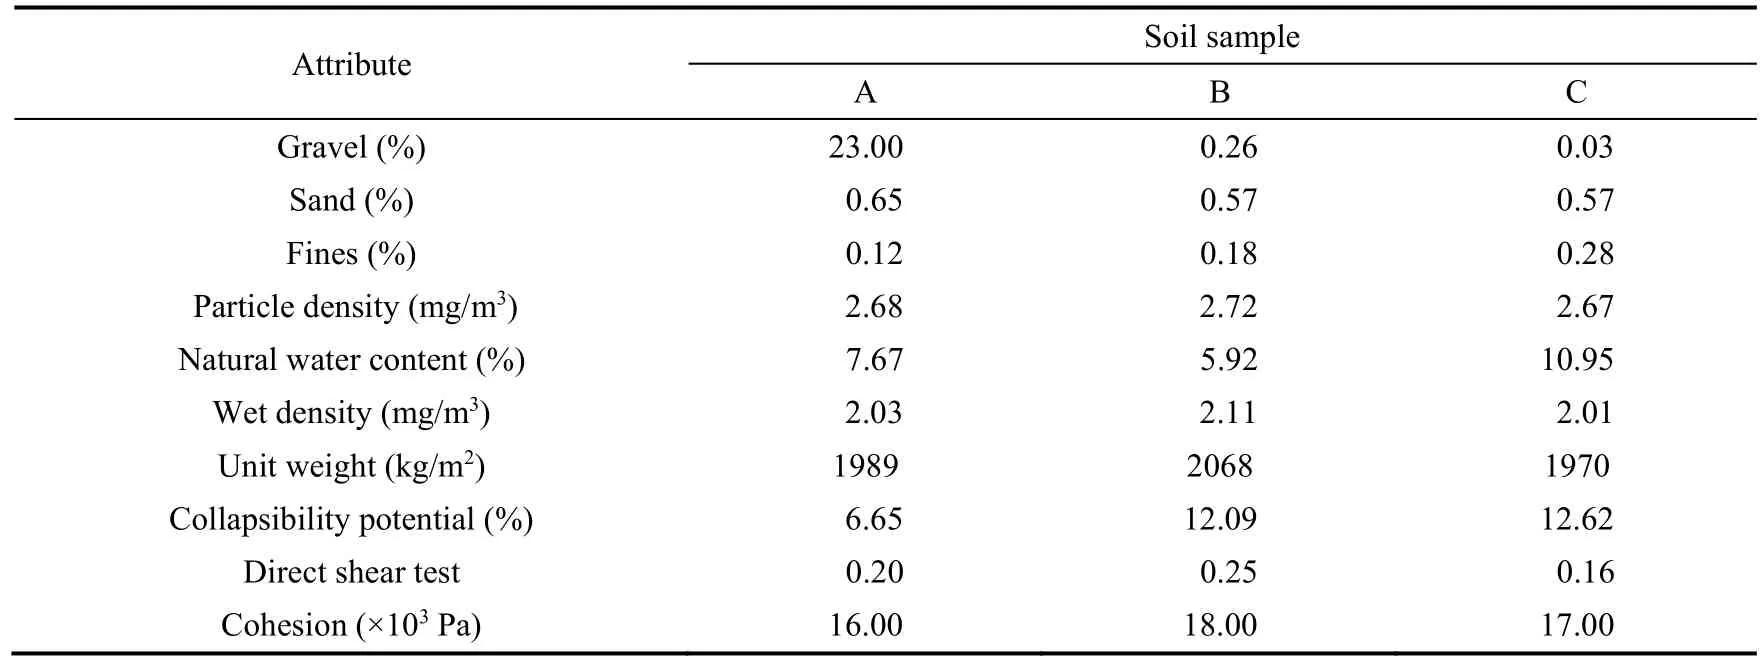
Table 4Geotechnical analysis of slope materials.
3.2.Rainfall distribution
Rainfall records in the study area are as presented in Table 5 and Figure 5.From Figure 5a we can see that rainfall distribution was unimodal, which is the characteristic of the Guinea climatic zone.The first rainfall peak,with an intensity of 405.7 mm, was recorded in July 2017 (Fig.5b), which could be due to the destruction of the physical structure of slope materials.Cessation of rainfall in August 2017 was followed by the second peak in September, which initiated the landslide event in this year (2017).Landslide data from Nigerian Meteorological Agency showed that the minimum and maximum rainfall during the landslide occurrence in September were 14.0 and 26.3 mm, respectively.Heavy rainfall in the study area may have saturated soil and rocks while pore water increased in pressure, which might affect the shear strength of soils and initiate the displacement of slope materials.This result aligned with the studies conducted on rainfall-induced landslide by Tran et al.(2018), Dikshit et al.(2019), and Huang et al.(2022).

Table 5Statistical description of rainfall in Okemesi landslide area from 2010 to 2017.
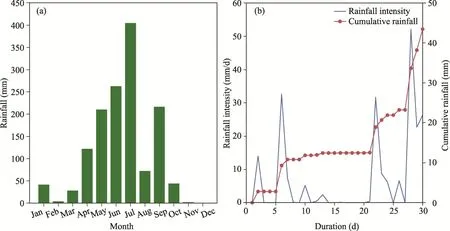
Fig.5.Monthly rainfall in 2017 (a) and daily rainfall intensity and cumulative rainfall in September 2017 (b) in the Okemesi landslide area.
3.3.Topographic characteristics
The slope of the study area was from 0.00° to 49.00° (Fig.6a), which was in line with the research of Nseka et al.(2019) and Wang et al.(2020).The map of slope aspect in the study area is presented in Figure 6b.Regions around the study area registered slope directions of approximately south (157.51°-202.50°), southwest (202.51°-207.50°),west (247.51°-292.50°), and north (0.00°-22.50° and 337.51°-360.00°), while the highlands were mainly bounded by slope directions of north (0.00°-22.50° and 337.51°-360.00°), northeast (22.51°-67.50°), east (67.51°-112.50°),and southeast (112.51°-157.50°), indicating that the movement of slope materials would follow these directions.Slope aspect showed that majority of flow movement is along the south, southwest, and west directions, accounting for over 80.00% of the total slope aspect.
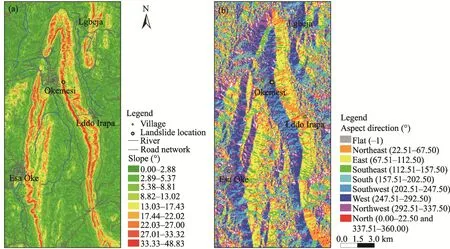
Fig.6.Spatial distribution of slope (a) and slope aspect (b) in the Okemesi landslide area.
The slope is indicated by the profile curvature which runs parallel to the slope.This study used IDW to interpolate grid-based DEM in the Okemesi landslide area, which ranged from 374.87 to 726.12 m a.s.l.(Fig.7a).Figure 7b showed that the highest profile curvature class was 2.14, while the lowest was -1.30.The positive profile curvature value indicated that the surface was upwardly concave and material flowed and accelerated along such gradient area.Hence, the higher the positive profile curvature value of the area, the higher the probability of a landslide occurrence, while the lower negative profile curvature value of the area, the lower the probability of a landslide occurrence (Mersha and Meten, 2020; Wubalem, 2021).

Fig.7.Spatial distribution of elevation derived from the Inverse Distant Weighting (IDW) (a) and profile curvature(b) in the Okemesi landslide area.
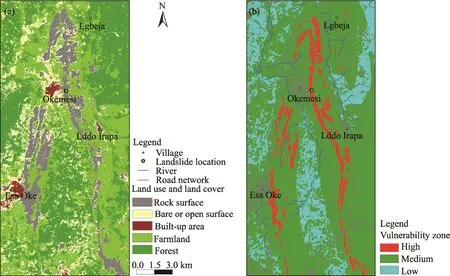
Fig.8.Distribution of land use and land cover type (a) and landslide vulnerability zone (b) in the Okemesi landslide area.
3.4.Land use and land cover type
The total area of the Okemesi landslide area is 22,441.84 hm2.The land use and land cover type in 2018 is presented in Table 6 and Figure 8a.Table 6 showed the area of land use and land cover type.The widespread distribution of farmland within the study area indicated that there are significant human factors in the study area,which increases the likelihood of landslides occurring.This association arises from the positive relationship between more human activities in land exploitation and land cover changes and the increased likelihood of landslip accident (Efiong et al., 2021).The increase in vegetation caused by human activities enhanced the likelihood and probability of slope damage (Efiong et al., 2021; Singh, 2023).

Table 6Land use and land cover type in 2018 in the Okemesi landslide area.
3.5.Landslide vulnerability zones
As shown in Figure 8b and Table 7, we classified the Okemesi landslide area into high, medium, and low vulnerability zones, with areas of 1345.35, 17,396.33, and 3700.16 hm2, respectively.From Table 7 we can see that the area percentage of low vulnerability zone was about 29.20% of the total Okemesi landslide area, while the medium vulnerability zone occupied 61.80% and the high vulnerability zone accounted for 9.00%.These medium and high vulnerability zones indicated that there is a high probability of landslide occurrence in the future, and the result are helpful in effectively predicting future landslide in the study area (Huang et al., 2015).

Table 7Area and percentage of landslide vulnerability zones in the Okemesi landslide area.
The spatial distribution of landslide vulnerability zones of the study area has implications in understanding future landslide occurrence.As shown in Table 7, the top of ridges (including rock surface) and hills (an area of 2016.25 hm2, accounting for 8.98% of the steep slope area) in the study area have higher vulnerability.The bare or open surface locating at about 500 m and above, and between 17.00° to 48.00° slope was the high vulnerability zone for landslide occurrence.If landslide occurs in the future, it will affect human activity located downhill.About 17,396.33 hm2of land within the study area falls within the medium vulnerability zone for landslide.In this zone,rock materials from high vulnerability zone typically tilt downwards, accelerating their speed and damaging obstacles during the process of tilting downwards.The western part of the Okemesi Town is close to the foot of the ridge, and if a landslide occurs in the area, it will pose a threat to residents there.As observed in Table 7, the low vulnerability zone was 3700.16 hm2(29.20%) and distributed in the northern part of the study area and in the valley between Esa Oke and Iddo Irapada.These regions are essential plains that with no hills or ridges and forestland with the slope of less than 5.00°, free from the threat of landslip or rock fall.
4.Conclusions
Studying landslide prone area is the first step in proffering solutions and averting landslide occurrence.In this study, we analyzed various environmental factors to determine the causative factors of the Okemesi landslide.Geotechnical analysis of grain size in the soil showed that the Okemesi landslide area comprised 17.14% gravel,59.31% sand, and 19.48% fines, with soil wet density varying between 2.01 and 2.11 mg/m3, thus, the soil type in the Okemesi landslide area can be classified as poorly graded gravely sand.Average angle of shearing resistance and cohesion index of the soil was 17.00° and 0.20×10³Pa, respectively.The Okemesi landslide was caused by excessive rainfall infiltration into the soil subsurface, which increased pore pressure, thereby leading to a reduction in the effective shear strength of the soil.Slope of the Okemesi landslide area was low, with most of the area recording the slope less than 8.00°.Regions around the study area registered slope directions of approximately south (157.51°-202.5°), southwest (202.51°-247.50°), west (247.51°-292.50°), and north (0.00°-22.50° and 337.51°-360.00°), while the highlands were mainly bounded by slope of north (0.00°-22.50° and 337.51°-360.00°),north east (22.51°-67.50°), east (67.51°-112.50°), and south east (112.51°-157.50°).Spatial distribution of land use and land cover types showed that built-up area, bare or open surface, forest, farmland, and rock surface occupied 1.15%12.01%, 35.41%, 39.65%, and 12.00% of the total study area, respectively.With the vulnerability analysis of landslide, the study area can be classified into high, medium, and low vulnerability zones, with the area percentages of 9.00%, 61.80% and 29.20%, respectively.
The results of this research will provide reference information for the studies of past, present, and future landslide occurrence in the study area.This study will also help decision-makers prioritize sustainable land use and planning,early warning systems, infrastructure investment, and protection of natural resources when formulating measures and regulations to reduce the risk of landslide.
Authorship contribution statement
Oluwakemi Bolanle AKINTAN: data curation, writing, and editing.Johnson Adedeji OLUSOLA:conceptualization, methodology, editing, and writing review.Olaniyi Patrick IMOLE: data analysis and writing review.Moyosoluwa Odunayo ADEYEMI: data analysis, reviewing, and editing.
Declaration of competing interests
The authors affirm that they have no known financial or interpersonal conflicts that would have appeared to have an impact on the research presented in this study.
Acknowledgements
The authors appreciate the Tertiary Education Fund (TETFUND), Nigeria, for funding this project.
杂志排行
区域可持续发展(英文)的其它文章
- Urban flood risk assessment under rapid urbanization in Zhengzhou City, China
- Research on the implementation of the Convention on Biological Diversity among the Shanghai Cooperation Organisation countries
- Human-wildlife conflict: A bibliometric analysis during 1991-2023
- Examination of the poverty-environmental degradation nexus in Sub-Saharan Africa
- Expert elicitations of smallholder agroforestry practices in Seychelles: A SWOT-AHP analysis
- Environmental complaint insights through text mining based on the driver, pressure, state, impact, and response (DPSIR)framework: Evidence from an Italian environmental agency
