An artificial neural network potential for uranium metal at low pressures
2023-10-11MaoshengHao郝茂生andPengfeiGuan管鹏飞
Maosheng Hao(郝茂生) and Pengfei Guan(管鹏飞)
Beijing Computational Science Research Center,Beijing 100193,China
Keywords: machine learning potential,uranium metal,first-principles calculation
1.Introduction
Uranium,being the heaviest element found in nature,possesses distinctive nuclear characteristics and unusual physical properties as a result of its f electron.[1]Its significance in the nuclear industry cannot be overlooked.At room temperature,uranium exists in a low symmetric orthogonal structure in its ground state.As the temperature increases, uranium undergoes two phase transitions in the solid state, the first occurring at 935 K,from the orthogonalαphase toβphase with a tetragonal structure,consisting of 30 atoms in a supercell.The second transition results in the formation of theγphase with a bcc structure at 1045 K, remaining stable until the melting point(Tm=1405 K)is attained.[2]
For computational simulations of bulk uranium,molecular dynamics(MD)is an indispensable and important tool.The interatomic force required in MD simulations can be determined by indirectly solving the electronic Schr¨odinger equation.However, this first-principles method, although capable of considering fine electronic interactions,is computationally expensive.[3]Therefore, for large-scale molecular dynamics simulations,traditional empirical potential is a better choice.It can be said without exaggeration that the choice of interatomic potential used in the simulation directly determines the accuracy and reliability of the computational results.Several empirical or semi-empirical potentials have been developed for uranium,including the COMB(charge optimized many body)potential[4]by Liet al., the EAM (embedded atom method)potential[5]by Pascuetet al., and the MEAM (modified embedded atom method)potential[6]by Fern´andezet al.
These traditional interatomic potentials only have a small number of fitting parameters, which are optimized on a data set composed of experimental data and energies and forces obtained through electronic structure calculations.Once the optimization is completed,the potential parameters will be fixed and used for all atomic environments that may be encountered in subsequent MD simulations.The setting of these traditional empirical potential fitting parameters often includes a physical understanding of the interatomic bonds in the material.Therefore,these potentials usually exhibit reasonable transferability to atomic configurations not included in the fitting database.However,because of the characteristics of these fitting parameters,the approximate functional form may introduce systematic errors in the simulation, especially in complex chemical environments or in the dynamic formation and breaking of covalent bonds that are difficult to model within this framework.
In recent years,machine learning potentials have become a promising new tool to bridge the gap between precise,flexible but computationally expensive electronic structure calculation methods and empirical force fields that are prone to errors but computationally convenient.Various machine learning potential methods have been developed, including artificial neural network potentials,[7,8]Gaussian approximation potentials,[9]Coulomb-matrix-based methods,[10]and spectral neighbor analysis potentials,[11]among others.Building interatomic potentials using ML methods has many advantages.The nonlinear functional form of these models is highly versatile and adaptable, enabling them to provide remarkably precise representations of reference data obtained through electronic structure calculations.Additionally, they exhibit exceptional efficiency, with computation speeds several orders of magnitude faster than electronic structure techniques.Furthermore, they can describe all forms of atomic interactions without bias,as they do not necessitate prior knowledge of the potential,while preserving the same degree of precision.
For small training sets, kernel-based ML potentials like GAP are favored for their excellent accuracy and lower computational cost compared to neural network approaches(NNP).However, for larger training sets, neural network potentials are preferred due to their superior computational scaling and lower memory requirements for training and prediction.[12]NNPs have a rich history of successful applications in the fields of chemistry,physics,and materials science.The Behler–Parrinello neural network, a classical example in NNPs,will be employed in this study,utilizing the spherical-Chebyshev basis[13]as the descriptor.
In this paper, a high-dimensional neural network potential of uranium is constructed based on DFT data.We utilize this NN potential to calculate the lattice constants of three uranium-related structures and three structures with common symmetries, and elastic constants ofαuranium,demonstrating strong consistency with DFT results.The vacancy formation energy ofαandγphases are computed,with a good agreement with DFT and experimental results.The anisotropic thermal expansion is successfully reproduced by our NN potential.And the calculated most stable selfinterstitial site and formation energy agree well with DFT results.
2.Method
2.1.Descriptors and neural network architecture
We have chosen the spherical–Chebyshev basis[13]as the representation method for the atomic local environment.The local environment is expanded in spherical coordinates as
wherew(tj)refers to the weight constant related to the chemical element.Since this paper only discusses pure uranium,the weightw(tj)is set to a constant value of 1.fc(ri j)is the radial cutoff function,which is expressed as
Here, the cutoff radiusrcis set to 6 ˚A in this paper.Rn(rij)is the first kind of Chebyshev functions after linear transformation,which is used to describe the radial information of the atomic environment,and it is expressed as
Ylm(θ,φ)is the spherical harmonic function used to describe the angular information of the atomic environment.However,sincecnlmdoes not have rotational invariance, a local environment real-valued descriptor satisfying rotational invariance with respect tocnlmwas used,expressed as
The Chebyshev polynomials have the property of rapid convergence and the convergence rate is particularly fast near the boundaries of the interval, making Chebyshev polynomials suitable for approximating functions with sharp changes.This feature is more conducive to the construction of a potential model under high pressure in the future.Furthermore,the orthogonality of Chebyshev polynomials provides access to a wide range of convenient mathematical tools and the combination of Chebyshev polynomials and spherical harmonic functions makes the math form simple for efficient numerical implementations.
In this paper,the values ofnof the Chebyshev polynomials are taken from 0 to 5,while the values oflof the spherical harmonic function are taken from 0 to 6.That is to say,the description vector of the atomic environment is 42-dimensional(6×7),and this vector,along with a bias,will serve as the input layer of the neural network.The bias term helps to shift the activation function of each neuron, effectively changing the decision boundary and allowing the network to make better predictions.
The construction of the potential is based on the highdimensional artificial neural network potential method[14]proposed by Behler and Parrinello,which expresses the total energy of the material as the sum of the energies corresponding to the local environments of each of theNatoms
The network architecture is shown in Fig.1.

Fig.1.High-dimensional artificial neural network architecture. C represents the cartesian coordinates of atoms; B represents spherical–Chebyshev basis functions;NN represents hidden layers;EN represents the energy corresponding to the environment of an atom numbered N;Etotal is the total energy of the system.
In this paper,the neural network hidden layer is chosen as a three-layer structure with dimensions of 30×30×30.Considering that the input vector has a dimension of 42, the total number of parameters in the neural network can be calculated as 3181.For each neuron in the neural network hidden layer,the activation function is in the form of the sigmoid linear unit(SiLU)function
The weight optimization of the neural network adopts the LBFGS-B algorithm[15]and the loss functionLis expressed as
where the variableenrepresents the energy difference between the neural network’s predicted energy and the reference energy for each reference samplen, whilewliterates through all the weights of the neural network.The coefficient of penalty term in this study is set asλ=0.01.
2.2.DFT data collection and potential training
The process of collecting the dataset is mainly divided into three parts,similar to the work of Volker L.Deringer.[16]All first-principles calculations related to the VASP program package[17]use the projector augmented wave (PAW)method,[18]and the Perdew–Burke–Ernzerhof (PBE) functional under the generalized gradient approximation (GGA)is selected.[19]All molecular dynamics simulations based on the machine learning potential use the LAMMPS (largescale atomic/molecular massively parallel simulator)software package.[20]
The purpose of the first part of the collection process is to conduct a rough scan of the first-principles potential energy surface of uranium.We used the structural search software AIRSS[21]to generate random structures with 8 to 12 atoms,and input these structures into the VASP program package for several steps of rough structural optimization under random pressures ranging from 0 GPa to 100 GPa.The structures obtained from this process were then subjected to high-precision first-principles calculations.For rough structural optimization,we chose an energy cutoff of 260 eV and set the parameter kspacing to 0.8 ˚A-1.For high-precision calculations, we chose an energy cutoff of 500 eV and set the parameterkspacing to 0.2 ˚A-1.
The purpose of the second part of the collection process is to accelerate the generation of unknown datasets by adding more information about important potential energy valleys of uranium on the basis of the rough potential energy surface obtained in the first part.Similar to the first part,we established random structures with 8 to 32 atoms,but instead of relying on VASP optimization,we used a neural network potential trained on the dataset obtained from the first part to conduct structural optimization of random structures under different pressures,and extracted some structures from the latter half of the optimization process.Many of these extracted structures are very similar, so to improve sampling efficiency, we used the CUR matrix approximation method[22]to select a subset of structures with low similarity and subjected them to high-precision first-principles calculations.Additionally,we stretched,compressed, or sheared the orthorhombic and body-centered cubic structures of uranium to a certain extent, conducted highprecision DFT calculations,and added them to the dataset.
The purpose of the third part of the collection process is to attempt a more detailed exploration of the parts of the potential energy surface that we are concerned about but have not been sampled.We performed MD simulation for several deformed structures, and after selecting a subset of structures with low similarity,we further screened them at a higher level.We input these structures into multiple potentials trained on the same dataset,and evaluated the potentials’predictive ability for the structures based on the root-mean-square error (RMSE) of the predicted values,called the ensemble error.[16,23]We used VASP to conduct high-precision calculations on the structures with high ensemble error as newly added data to the dataset.
The final size of the dataset is 15648, corresponding to 291676 atom environments.And the proportion of structures generated by different structure collection methods out of the total number of structures is shown in the Fig.2.The section labeled as“Initial”refers to the structures collected based on AIRSS package in the first stage of our strategy,while the label “Opt”, “Deform”, and “MD” correspond to structures generated from structure optimization, deformation, and MD simulation, respectively, in the second and third stages of the collection process.

Fig.2.The pie chart illustrating the composition of the DFT dataset,exhibiting the proportion(as a percentage)and number(in parentheses)of structures generated by different methods.
During each neural network training, 10% of the data is selected as the test set and 90% of the data is selected as the training set.The predictive ability of the neural network potential can be demonstrated by the RMSE of the test set.According to our calculations, as the collection process progresses and the dataset size increases,the predictive error of the neural network potential decreases continuously, eventually achieving an RMSE of 8.47 meV/atom.The prediction results of energy and force components on the test set are shown in Fig.3.

Fig.3.Calculated energies (a) and force components (b) fitting errors on the testing set.The line of y=x is shown as dashed lines.Data points in panel(b)are colored by their local number densities.
3.NN potential performance analysis
3.1.Equation of state(EOS)
Structure optimizations are firstly performed under 0 K employing VASP for theα-U andγ-U, and the two equilibrium structures are then scaled to different atomic volume.The corresponding atomic energies of the scaled structures are calculated based on both VASP and our NN potential.The comparison is illustrated in Fig.4.It can be seen that the NN potential performs comparably to DFT near equilibrium structure, although the deviations are somewhat large for big volumes.
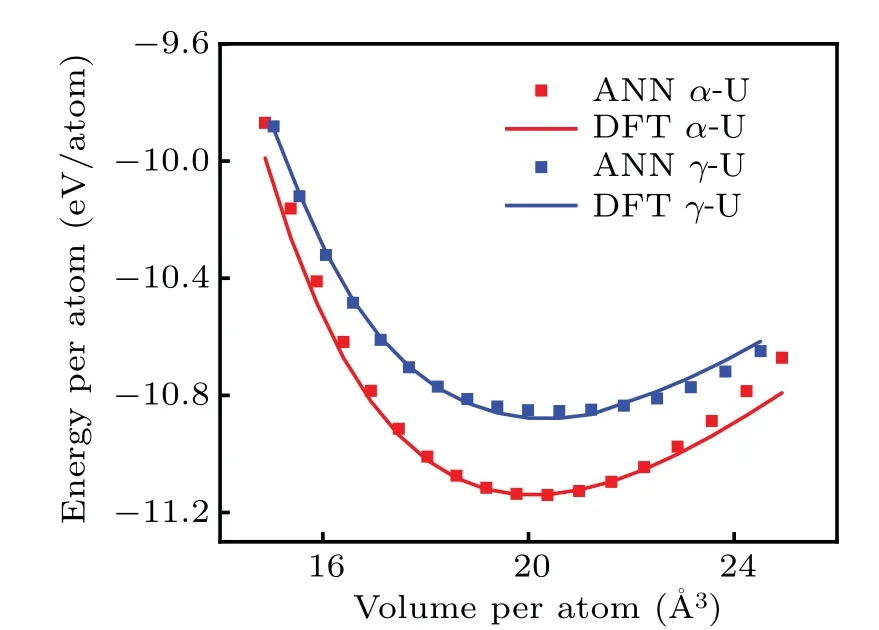
Fig.4.Energy per atom as a function of the atomic volume for the α-U (red) and γ-U (blue).Symbols correspond to the ANN potential energies and lines interpolate the DFT reference energies.
3.2.Lattice constants
To verify the reliability of the neural network (NN) potential for structural calculations,we calculated the lattice parameters of uranium with different structures(Fig.5).The two most common phases of elemental uranium are the orthorhombic and body-centered cubic (bcc) phases.Additionally,S¨oderlind has suggested a close relationship between the bcc phase of uranium, which is only stable at high temperatures,and theβNp structure.[24]Therefore, we used LAMMPS to call the NN potential to perform geometry optimization on these three structures and listed the optimized lattice parameters in Table 1.On the other hand,we also tested the NN potential for structures with common symmetries, such as facecentered cubic (fcc), hexagonal close-packed (hcp), and simple cubic(sc)structures.Due to the mechanical instability of uranium for these three structures,we did not directly perform geometry optimization using LAMMPS, but instead selected different lattice parameter values in batches and directly calculated the corresponding energy to obtain the lattice parameters corresponding to the lowest energy.The calculation results of the NN potential and the comparison with reference values from other literatures are listed in Table 1.It can be found that the NN potential can approximate the values of DFT with high accuracy.
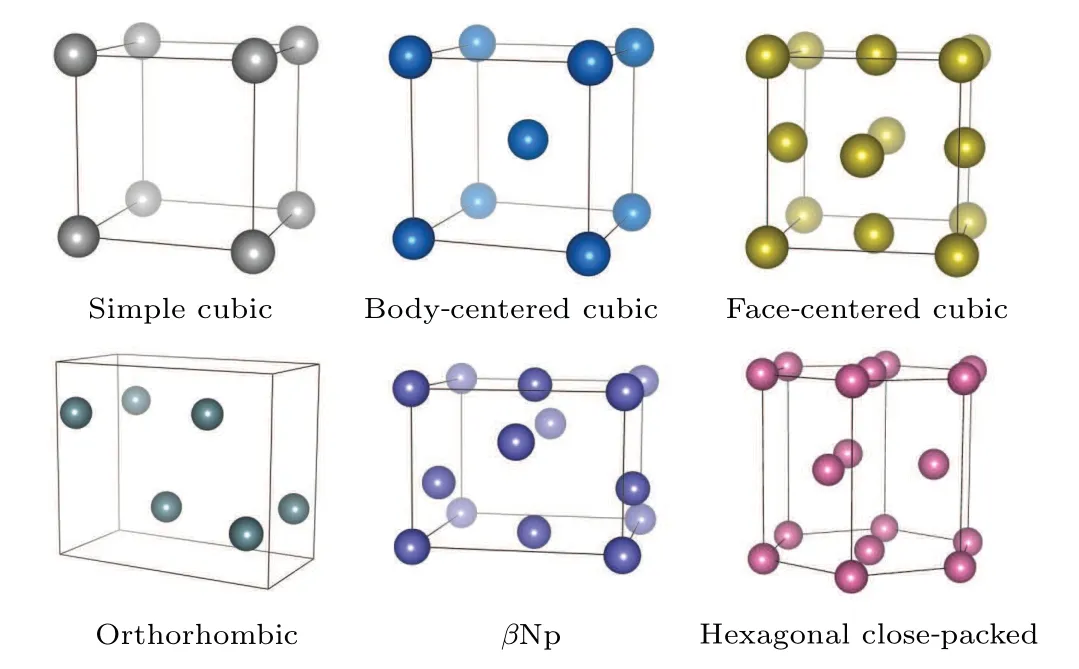
Fig.5.The six structures used in the calculation of lattice parameters.

Table 1.The calculated lattice parameters from NN potential (ANN) and the reference values of first-principles method (FP), experiments(Exp),traditional MEAM,and EAM potentials.
3.3.Elastic constants of α-uranium
As a validation,the elastic constants ofαphase could also be determined based on energy–strain method[25]that computes energy variations by applying small strains to the equilibrium lattice,and thus the elastic energy of distorted configuration in the harmonic approximation is expressed as
whereEandE0are the total energies of the distorted and undistorted lattice cells.V0is equilibrium volume andεrepresents a strain vector with 6 independent components.The elastic stiffness tensorCijthen could be obtained by solving a system of linear equations.The comparison of computational results above is summarized in Table 2.It can be seen that the results of NN potential are highly consistent with DFT values.

Table 2.Stiffness tensor Cij (in unit GPa) and bulk modulus B (in unit GPa) of α-uranium calculated from neural network (NN) potential compared with previous results of experiments,DFT,and two empirical potentials.
3.4.Thermal expansion of α-uranium
In addition to static physical properties ofαuranium,temperature effects have to be taken into account.We performed molecular dynamics on a simulation box of 720 atoms for theαphase.After a period of equilibration of 0.5 ns at 100 K,the temperature is increased by 10 K every 30 ps up to 1000 K at NPT.The volume coefficient of thermal expansion can be expressed as
whereΩ,T,andPare atomic volume,temperature,and pressure, respectively.In practice, the atomic volume is approximated as a polynomial function of temperature, andαVthus can be solved readily.The volume coefficient obtained for theαphase around room temperature is 34×10-6K-1while the experimental value[26]is 39×10-6K-1.As shown in Fig.6,our NN potential captures the dimensional anomalies of theα-U lattice,i.e.,theaandclattice parameters expand whilebcontracts with increasing temperature which is consistent with the experimental results.[27,28]It implies that our potential may be suitable for studying the structural evolution of U-alloys under thermal cycling.
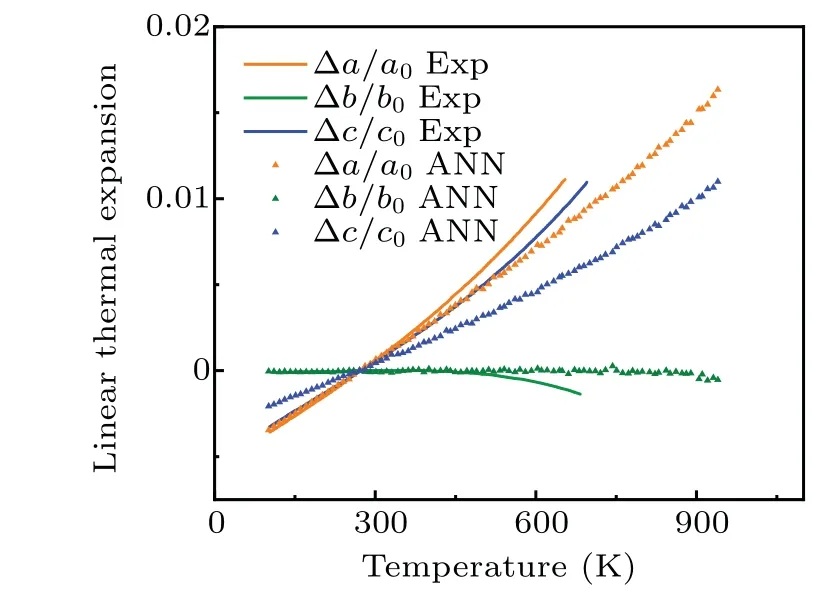
Fig.6.Linear thermal expansion for the α-U.The filled triangles correspond to values calculated from NN potential.The lines correspond to experimental values.[28]
3.5.Vacancy formation energy of α-U
To further test the generalization ability of the NN potential, we calculated the defect formation energies of theαandγphases of uranium.The defect formation energy can be determined by the following formula:
whereNrefers to the number of atoms in the perfect lattice,ENrefers to the energy of the perfect lattice, andEN-1corresponds to the energy of the stable structure formed after the removal of an atom from the perfect lattice.We first established a crystal system of theαphase containing 720 atoms and used LAMMPS for geometric structure optimization.Then,we removed one atom from the crystal system and optimized it again to extract the energy data during the process.Finally,the defect formation energy of theαphase was calculated to be 1.82 eV,and the calculation results were listed in Table 3 in accordance with other literature reference values.It should be noted that our NN potential did not intentionally add a dataset designed for point defects in theαphase,but the calculated result is very close to the values obtained by Beeleret al.(1.86 eV)in first-principles calculations,demonstrating the high prediction accuracy and good generalization performance of the NN potential.

Table 3.Defect formation energy(in unit eV)of α uranium.ANN represents the value of NN potential;DFT1 represents the first-principles result obtained by Beeler et al.;[40] DFT2 represents the first-principles result obtained by Taylor;[33] EAM and MEAM represent the calculated result obtained by EAM potential[32] and MEAM potential,[6] respectively.
3.6.Self-interstitial formation energies of α-U
Fern´andez and Pascuet summarized the approximate selfinterstitial site coordinates,[6]which are redrawn and presented here in Fig.7.The interstitial formation energies are calculated based on the formula
whereNrefers to the number of atoms in the perfect lattice,ENrefers to the energy of the perfect lattice, andEN+1corresponds to the energy of the stable structure formed after adding an atom to the perfect lattice.The calculated values are listed in Table 4,with comparison to previous results.The formation energy for theEsite agrees well with previous DFT values[4,29]and consistent with the statement that the lowest energy configuration found corresponds to theEsite,made by Huang and Wirth[29,30]in their first-principles study.

Fig.7.Some of the interstitial configurations of α-U.The approximate positions in units of lattice parameters are A = (1/2,-1/6,0),B = (1/2,1/2-y,1/4), C = (1/2,1/6,0), D = (1/2,0,0), and E =(1/2,-1/6,1/4).The rest of the sites are dumbbells along different crystallographic directions while the dumbbells not parallel to z plane are not shown here.
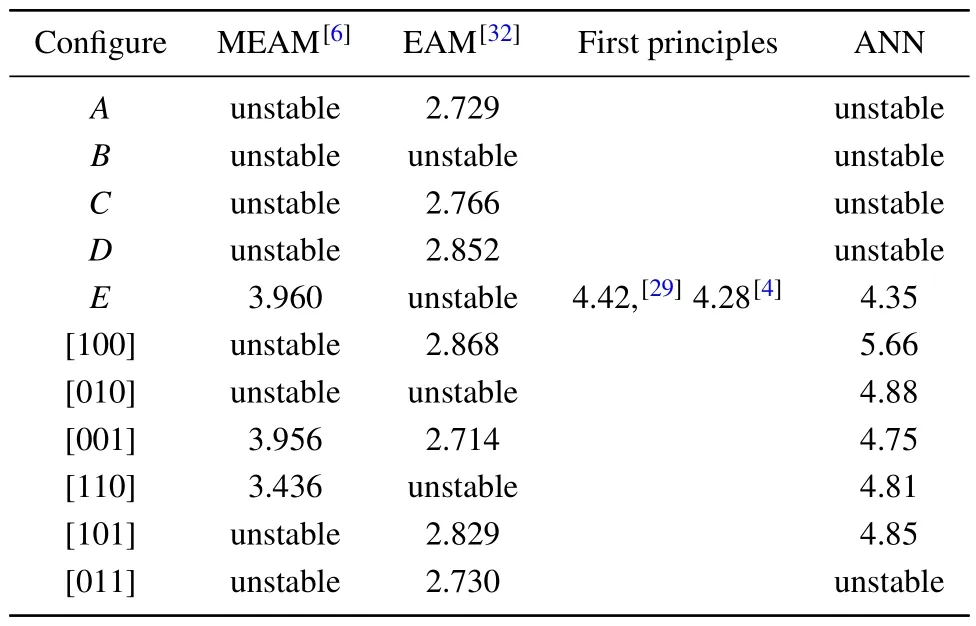
Table 4.Self-interstitial formation energy (in unit eV) of α-uranium.All structures marked as“unstable”decay to structures with energy values.
3.7.Vacancy formation energy of γ-U
According to the first-principles results of S¨oderlind,[24]when an atom is removed from the perfect bcc lattice,the lattice will undergo distortion in the optimization process that spreads throughout the entire crystal cell, eventually forming a structure similar toβNp.Therefore, it is not feasible to directly optimize to obtain the defect formation energy of theγphase,and such phenomena were also observed in the results of the NN potential.Considering that high temperature has an important influence on maintaining the stability of the bcc phase of uranium,we conducted molecular dynamics simulations of perfect bcc lattices and bcc lattices with a single defect at interval of 100 K from 1100 K to 1300 K under a constant NPT ensemble.A crystal supercell of 8×8×8 unit cells is used for the perfect bcc lattice containingN=1024 atoms,and the defect lattice was formed by removing one atom.Each simulation lasted 1 ns with a time step of 1 fs.
Taking 1100 K as an example, we continuously monitored the energy,temperature and pressure fluctuations of the MD system at this temperature, as shown in Fig.8.It can be seen that the state of the simulation system undergoes a brief but intense change in the initial stage, and then entered a relatively stable state, where the atomic positions of the crystal cell were subject to regular vibrations around their equilibrium positions.

Fig.8.The temperature,pressure,and atomic energy of the system over time(from left to right).For visual clarity,only the frist 40 ps of the simulation are selected to be shown in the diagram.
We selected the energy fluctuation data of the last 0.5 ns of each MD simulation reaching a stable state and calculated the statistical average as the average potential energy of the simulation system.In this way, we can use Eq.(10) to calculate the defect formation energy of theγphase at a specific temperature.In this case,ENrefers to the MD average potential energy of the perfect bcc lattice, whileEN-1corresponds to the average potential energy of the lattice with a single defect after reaching a stable state in MD simulation.
Due to the influence of thermal fluctuations on energy averaging,the defect formation energy obtained at different temperatures will fluctuate accordingly,and the final energy range is 1.49 eV<Efvac<1.80 eV.This range is very close to the experimental value of Lundet al.(1.6 eV±0.16 eV).The defect formation energy ofγuranium obtained using the NN potential and the reference values from other literature are listed in Table 5.

Table 5.Defect formation energy(in unit eV)of γ-uranium.ANN represents the NN potential,Exp1 represents the experimental results[41] of Lund et al.,Exp2 represents the experimental results[42] of Matter et al.,and DFT represents the two results[40] obtained by Beeler et al., using two different forms of generalized gradient approximatio.
3.8.Enthalpy versus pressure
To give an assessment of relative stability ofα-U andγ-U, the geometry optimization is first performed under zero temperature and zero pressure condition.Then, the ratios of lattice constants are fixed and hydrostatic strain is applied to the structures to calculate the enthalpyversuspressure curve,as illustrated in Fig.9,where the transition point is determined at 118 GPa.Since the data set we have currently collected is primarily focused on configurations at low pressure and relatively few structures related to high pressures are contained,there is a gap between this transition pressure and the result[31]of Kruglovet al.However,the Spherical–Chebyshev descriptors we employed should have advantages in the description of atomic environments if great efforts are focused on highpressure conditions, the existing potential model can be used as a basis for obtaining NN potential suitable for a wide range of pressures by containing related high-pressure DFT data.

Fig.9.Enthalpy difference of γ-U to α-U as a function of pressure.
4.Conclusion
In this paper,a high-dimensional artificial neural network method was used with a step-by-step iterative data set collection strategy to train a machine learning model on a DFT data set for uranium.The final RMSE of the NN potential on the test set can be as low as 8.47 meV/atom.The NN potential was used to calculate the basic lattice parameters of six structures with different symmetries,the elastic constants ofαuranium and the defect formation energies ofαandγphases, respectively.The calculated results agree well with first-principles calculations and experimental values.The NN potential is also capable of reproducing the anisotropy observed in the lattice expansion ofαuranium in experiment.The calculated most stable self-interstitial site and its formation energy agree well with DFT results.This NN potential will provide the basis for further construction of potential model suitable for a wide range of pressures.
Acknowledgments
We acknowledge the computational support from Beijing Computational Science Research Center(CSRC).Project supported by the National Natural Science Foundation of China(Grant Nos.52161160330 and U2230402).
猜你喜欢
杂志排行
Chinese Physics B的其它文章
- Dynamic responses of an energy harvesting system based on piezoelectric and electromagnetic mechanisms under colored noise
- Intervention against information diffusion in static and temporal coupling networks
- Turing pattern selection for a plant–wrack model with cross-diffusion
- Quantum correlation enhanced bound of the information exclusion principle
- Floquet dynamical quantum phase transitions in transverse XY spin chains under periodic kickings
- Generalized uncertainty principle from long-range kernel effects:The case of the Hawking black hole temperature
