Performance of FAST with an Ultra-Wide Bandwidth Receiver at 500–3300 MHz
2023-09-03ChuanPengZhangPengJiangMingZhuJunPanChengChengHongFeiLiuYanZhuChunSunandFASTCollaboration
Chuan-Peng Zhang ,Peng Jiang ,Ming Zhu ,Jun Pan ,Cheng Cheng ,Hong-Fei Liu ,Yan Zhu,Chun Sun,and FAST Collaboration
1 National Astronomical Observatories,Chinese Academy of Sciences,Beijing 100101,China;cpzhang@nao.cas.cn
2 Guizhou Radio Astronomical Observatory,Guizhou University,Guiyang 550000,China
3 College of Earth Sciences,Guilin University of Technology,Guilin 541004,China
Abstract The Five-hundred-meter Aperture Spherical radio Telescope (FAST) has been running for several years.A new ultra-wide bandwidth (UWB) receiver,simultaneously covering 500–3300 MHz,has been mounted in the FAST feed cabin and has passed a series of observational tests.The whole UWB band is separated into four independent bands.Each band has 1,048,576 channels in total,resulting in a spectral resolution of 1 kHz.At 500–3300 MHz,the antenna gain is around 14.3–7.7 K Jy-1,the aperture efficiency is around 0.56–0.30,the system temperature is around 88–130 K,and the half-power beamwidth is around 7.6′–1.6′.The measured standard deviation of pointing accuracy is better than~7.9″when zenith angle is within 26.4°.The sensitivity and stability of the UWB receiver are confirmed to satisfy expectations through spectral observations,e.g.,H I and OH.The FAST UWB receiver has already demonstrated good performance in capturing sensitive observations for various scientific goals.
Key words: instrumentation: detectors–telescopes–line: profiles
1.Introduction
The Five-hundred-meter Aperture Spherical radio Telescope (FAST),with an effective diameter of 300 m,has obtained many groundbreaking achievements,for example,in observations of pulsars,fast radio bursts,star formation and galaxy evolution (e.g.,Cheng et al.2020;Han et al.2021;Li et al.2021;Ching et al.2022;Niu et al.2022;Xu et al.2022),since construction was completed on 2016 September 25(Nan et al.2011;Jiang et al.2019,2020).Until now,the FAST has mainly worked at frequencies of 1000–1500 MHz with a 19-beam receiver.Recently,a new cryogenic ultra-wide bandwidth (UWB) receiver at 500–3300 MHz was developed by Liu et al.(2022) and mounted in the FAST feed cabin for scientific observations.The 19-beam receiver uses all three helium cryogenic compressors and occupies most of the space in the feed cabin,so there it not enough space to place any more cryogenic compressors for an UWB receiver.However,the FAST UWB receiver has now passed a series of tests and could carry out several kinds of spectral observations.
At 500–3300 MHz,the FAST UWB receiver is able to simultaneously cover 330 radio combination lines for Hnα,Henα and Cnα (n=235–126),respectively.This could help us to investigate the active star-formation regions in the Milky Way (e.g.,Chen et al.2020;Zhang et al.2021;Hou et al.2022).Furthermore,the UWB receiver could simultaneously cover the hydrogen (H I at 1420.406 MHz) and hydroxyl radical (OH at 1612.231,1665.402,1667.359 and 1720.530 MHz) lines,and their high redshift signals withz≾1.8.This gives us an opportunity to study star formation and evolution not only in the Milky way,but also in the nearby galaxies and especially to provide us with multiwavelength spectral data.In addition,the UWB receiver has been able to catch the methyladyne (CH) line at 3263.794 MHz.This would provide us with high spatial resolution data (~1.6′) for better inspections of our galaxy.Furthermore,the UWB receiver has a sufficient sensitivity and high spectral resolution (1 kHz).This allows us to study the kinematic properties of star formation in the Milky Way and the hyperfine structures of some spectral lines (e.g.,OH at~1665.402 MHz).
Thanks to the advantageous characteristics of the FAST,we are able to complete a series of observational tests in a short time.In this report,we mainly present the performance of the FAST UWB receiver and relevant antenna parameters at 500–3300 MHz.General parameters of the FAST UWB receiver are listed in Table 1.In Section 2,we introduce the measurement parameters of the UWB receiver system including the noise dipole,beam properties,pointing accuracy,antenna gain,aperture efficiency,and system temperature.In Section 3,we present the properties of the spectral backend,and the measurement results in spectral H I and OH observations.A summary is presented in Section 4.
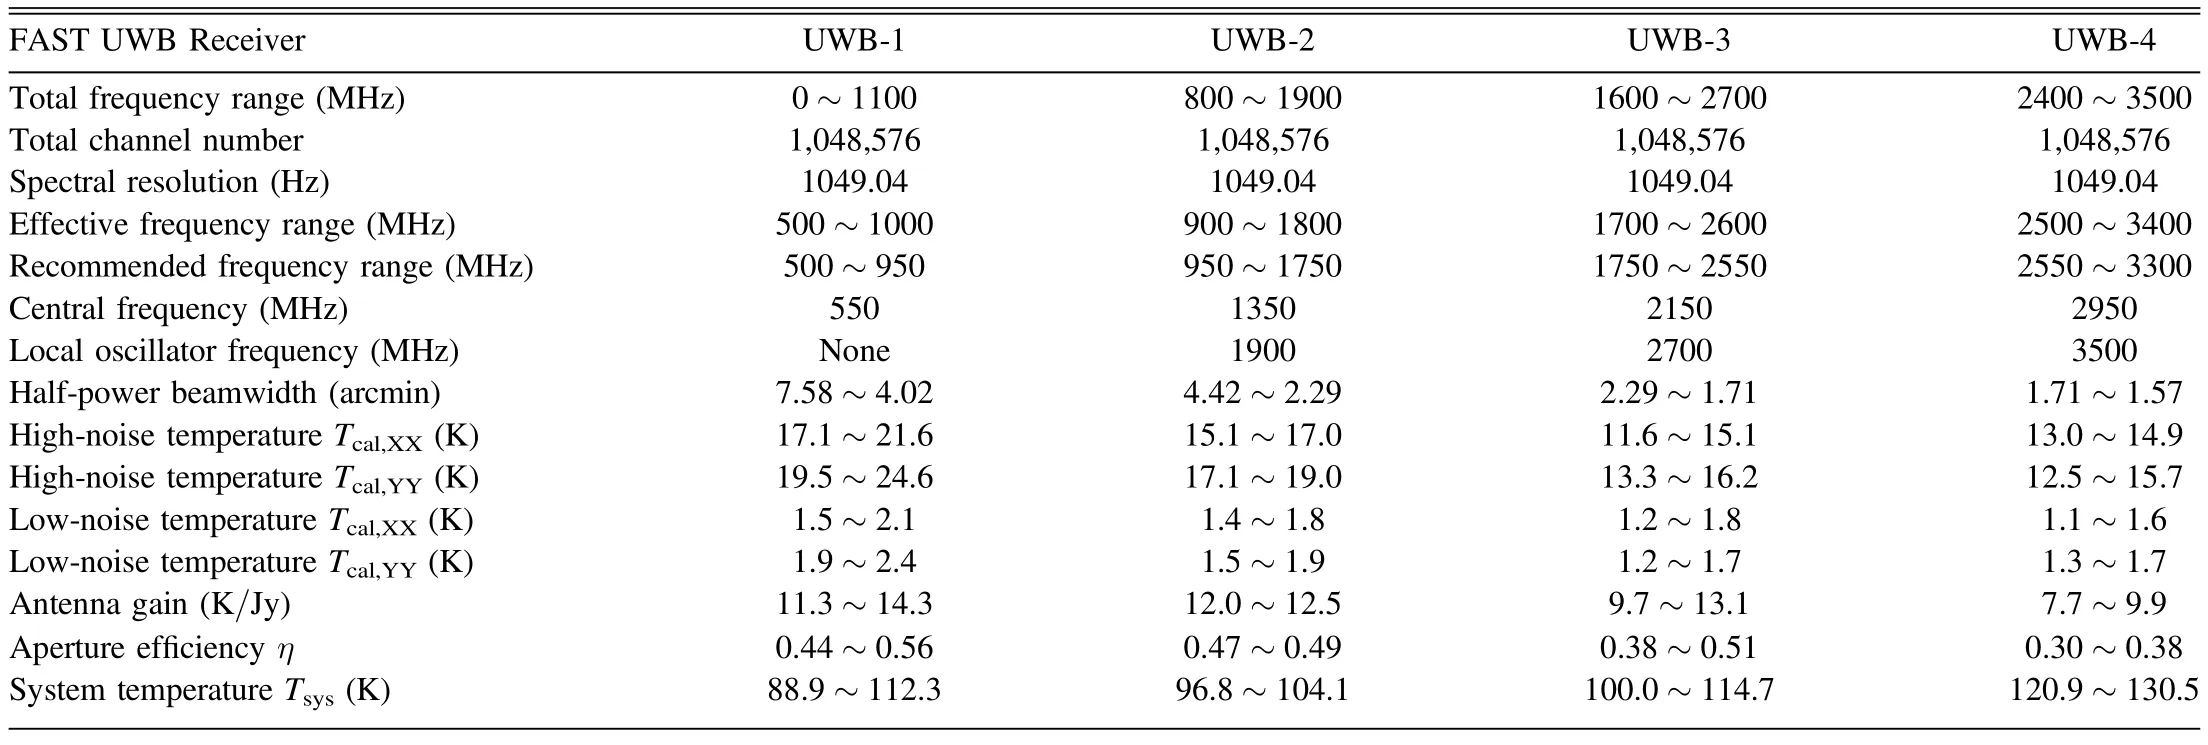
Table 1General Parameters of the FAST with the UWB Receiver
2.Measurement Parameters of the UWB Receiver
2.1.The Noise Source
Like the FAST 19-beam array,the UWB receiver also contains a stabilized noise injection system (Jiang et al.2020).The noise is injected between the feed and the low-noise amplifiers.The noise source is a single diode whose signal is split into each polarization.The noise diode has two adjustable power output modes with 1.5–2.0 K for low-power noise temperatures and 13.5–22.0 K for high-power noise temperatures.Based on the test results of a series of hot-load measurements,the noise diode is stable and meets the requirements of data calibration.The low-and high-power noise temperatures are shown in Figure 1 and listed in Table 2.The full noise diode data for UWB 500–3300 MHz can be downloaded online.
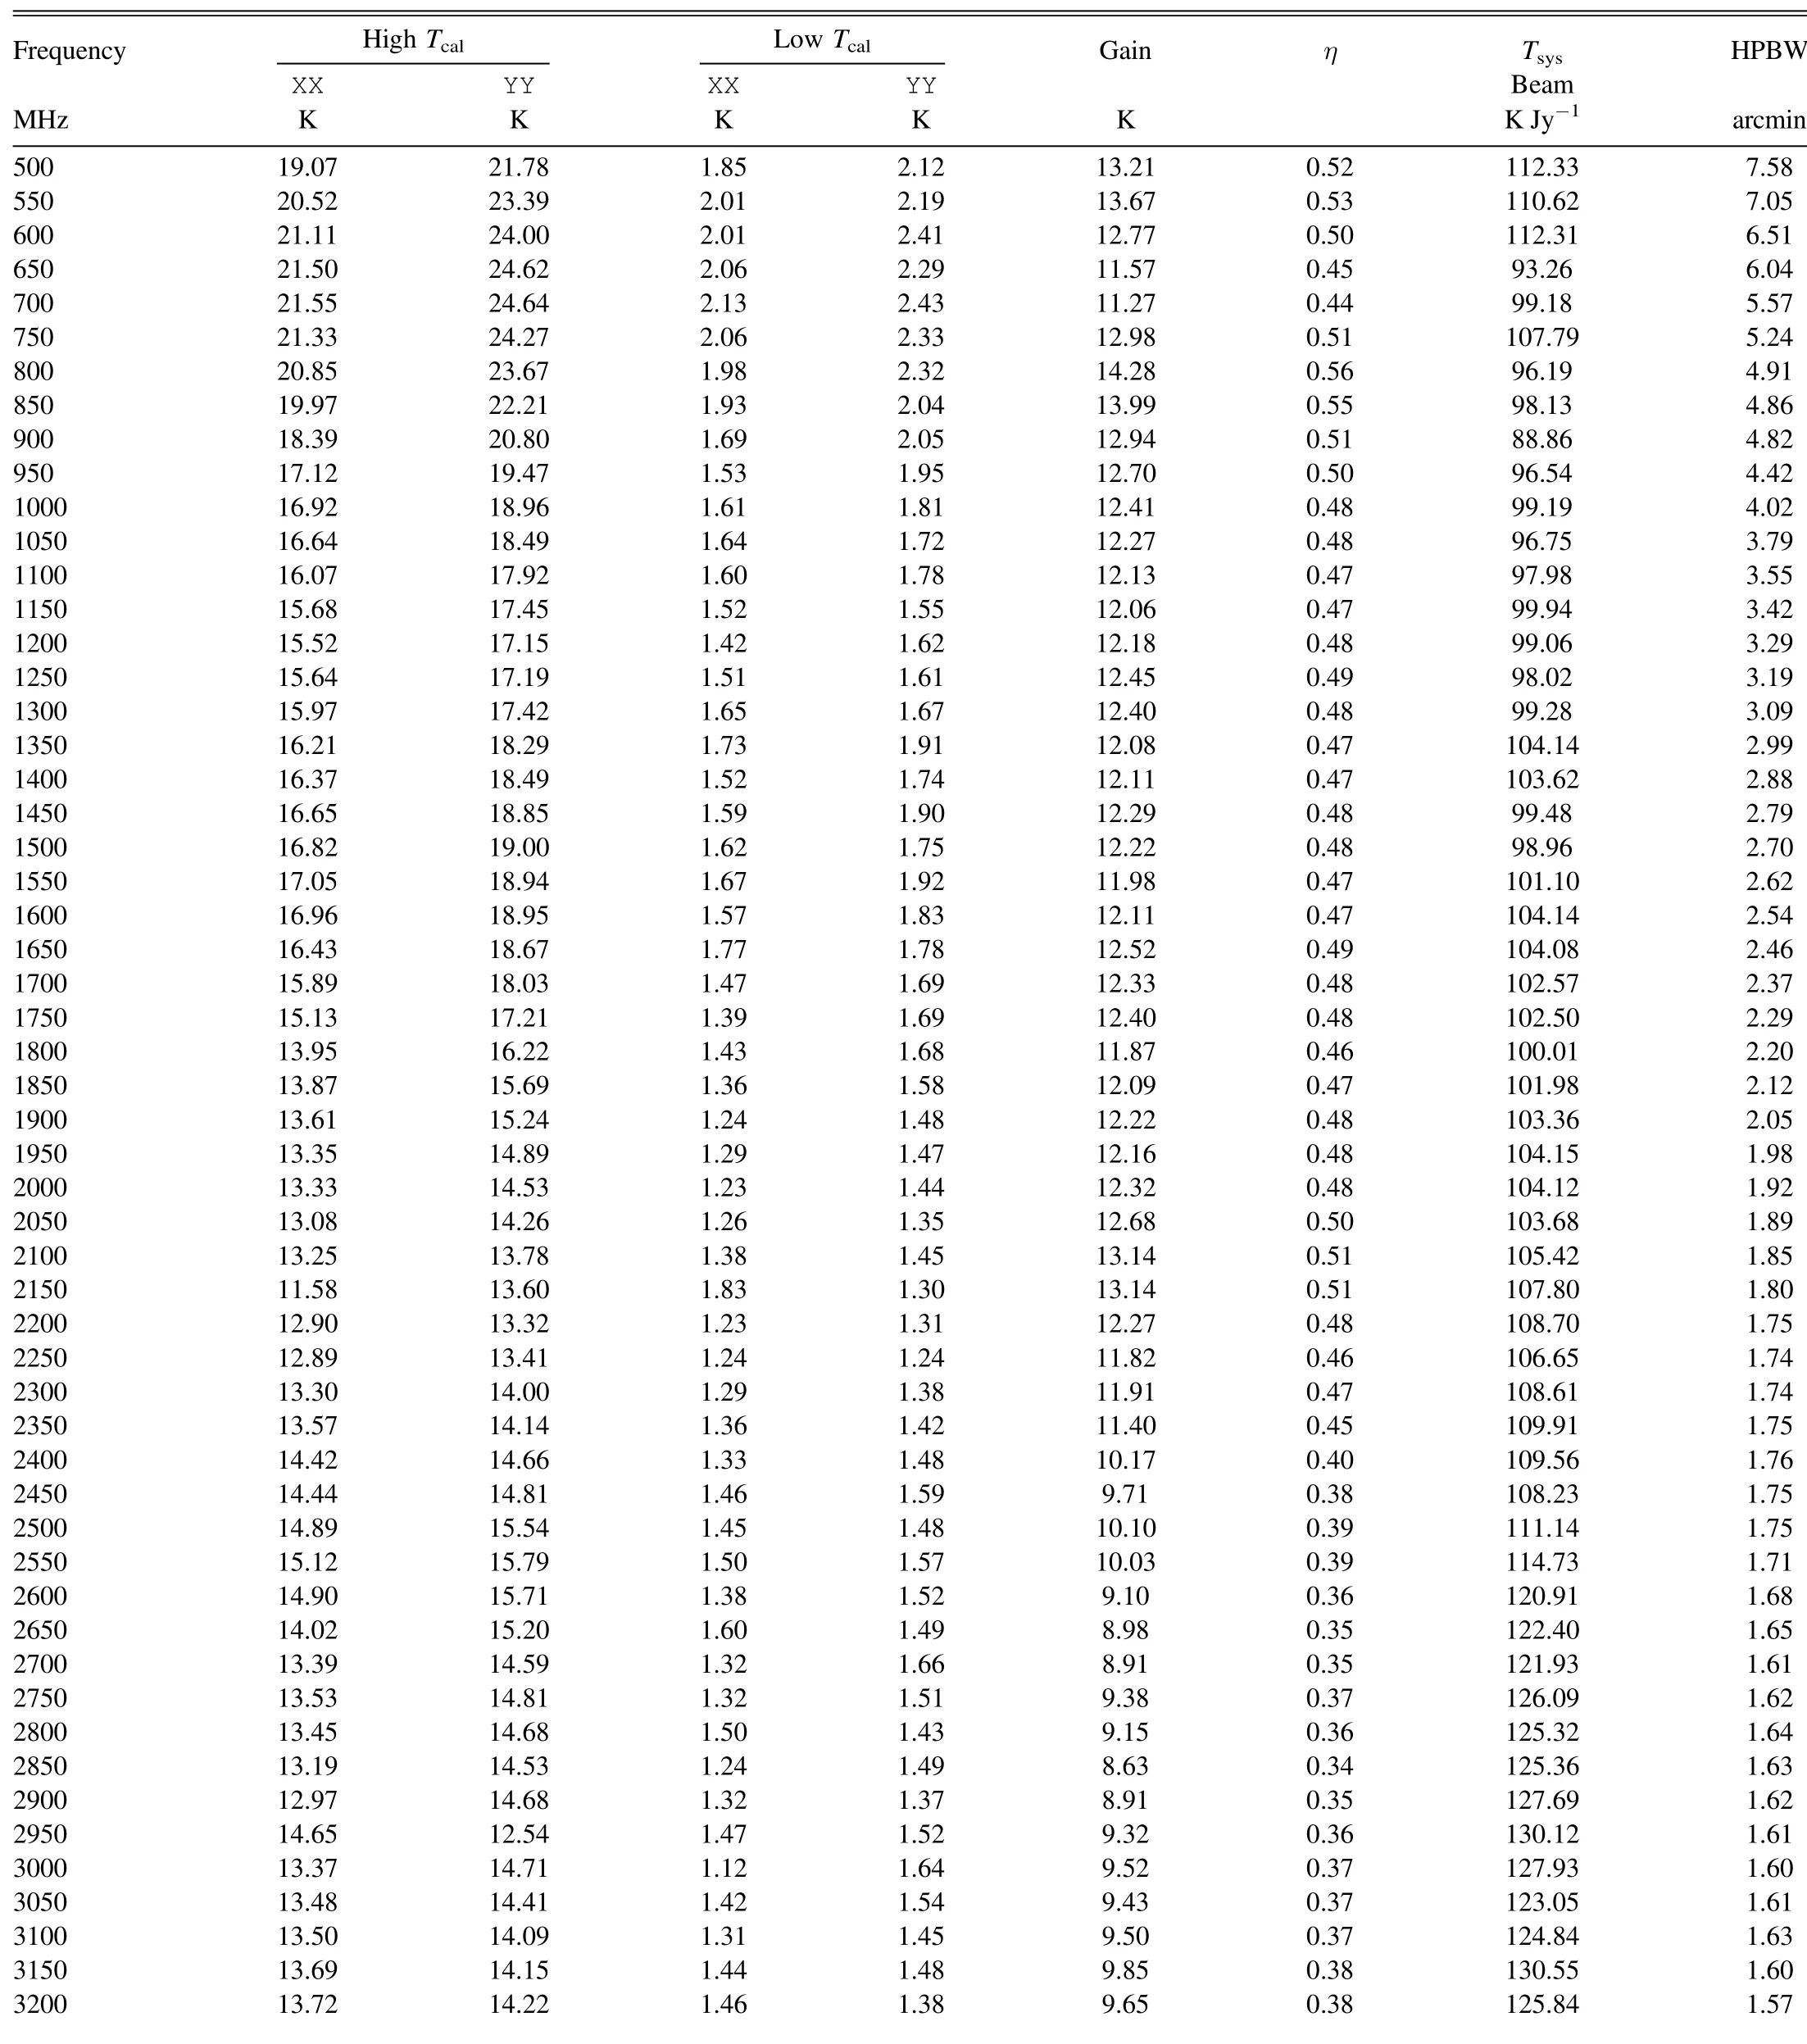
Table 2Detailed Parameters of Noise Diode Temperature(Tcal),Antenna Gain,Aperture Efficiency(η),System Temperature(Tsys),and Half-power Beamwidth(HPBW)for the UWB Receiver

Figure 1.The high-and low-power noise diode temperatures of the average of two polarizations XX and YY for the FAST UWB 500–3300 MHz measured on 2022 June 17.
2.2.Beam Size
To measure the beam properties of FAST UWB receiver,we directly make mapping observations toward a radio point source 3C286 on the sky on 2023 March 26.The used observation mode is OTF along the direction of the RA,and sampling time is 0.2 s,scanning velocity is 20″per second,and the scanning space is 12″.The mapping area is around 20′ × 20′,which is large enough for covering the whole beam structure at 500–3300 MHz.Figure 2 displays examples of observed and fitted beam structures at 800,1400,2000,and 2900 MHz.Table 2 lists all the measured half-power beamwidth (HPBWs) at 500–3300 MHz.Figure 3 shows the observed HPBWs and the theoretical HPBW=1.22 λ/Dwith an assumed telescope diameterD=300 m at 500–3300 MHz.We find that below~2400 MHz,the observed HPBW is smaller than the theoretical HPBW.This indicates that the telescope effective aperture is larger than 300 m below~2400 MHz.We notice that the measured UWB HPBWs are consistent with the FAST 19-beam receiver between 1000 and 1500 MHz.

Figure 2.The beam structures at 800,1400,2000,and 2900 MHz measured by observing calibrator 3C286 on 2023 March 26.The used observation mode is OTF along the direction of the RA,and sampling time is 0.2 s,scanning velocity is 20″ per second and the scanning space is 12″.

Figure 3.The HPBW distribution(blue dotted line)for UWB 500–3300 MHz measured by observing radio point source 3C286 within ZA of 26.4°on 2023 March 26.The red curve indicates the theoretical HPBW=1.22 λ/D with an assumed telescope diameter D=300 m.
2.3.Pointing Accuracy
In the FAST feed cabin,the UWB receiver has been placed at the phase center based on many pointing tests.According to antenna measurements,the UWB observations have the same pointing accuracy as the FAST 19-beam array.The measured standard deviation of pointing accuracy is better than~7.9″within zenith angle(ZA)of 26.4°(Jiang et al.2020).For example,the measured pointing error is~7.0″ when measuring the beam structures using the radio point source 3C286 on 2023 March 26.The pointing accuracy of~7.0″only takes around one twelfth of the HPBW (HPBW3300MHz≈ 1.6′) at the frequency of 3300 MHz for the FAST.Therefore,the pointing accuracy meets the requirements for current UWB receiver observations.
2.4.Antenna Gain and Aperture Efficiency
Figure 4 shows the antenna gain distribution within ZA of 26.4°for UWB 500–3300 MHz measured by observing a stable flux calibrator 3C286 on 2023 March 5.With absolute measurement of noise dipole,the UWB observed ON-OFF data could be calibrated to antenna temperature (Ta,3C286) in Kelvin.The flux density (in Jy) of 3C286 within UWB band could be fitted with a polynomial function (Perley &Butler 2017)

Figure 4.The antenna gains within ZA of 26.4°for UWB 500–3300 MHz measured by observing flux calibrator 3C286 on 2023 March 5.Four separated UWB bands are indicated with different colors.
whereS3C286and ν are the flux density in Jy and the frequency in GHz,respectively.Then the antenna gain could be estimated as
The derived UWB gain at~1400 MHz is~12.0 K Jy-1,which is lower than that of the FAST 19-beam array (~16.0 K Jy-1),mainly because the UWB receiver is uncooled.Up to 3200 MHz,the UWB gain is~9.5 K Jy-1.This meets the requirement for CH observation at~3263.794 MHz.The full antenna gain parameters for UWB 500–3300 MHz can be download online and are partly listed in Table 2.
As can be seen in Figure 4,the antenna gain becomes low at the high-frequency end,probably because the reflector precision or the reflection efficiency becomes low at such a high-frequency band.The wild fluctuation at the low-frequency end could have resulted from the serious radio frequency interference (RFI) pollution at 500–920 MHz.Generally,the variation of the monitored antenna gain is less than~10%from 2022 August to 2023 March.This indicates that the FAST UWB receiver is relatively stable,but it still needs long-term monitoring for better data calibration.
Assuming that the aperture efficiency of the FAST is 300 m at 500–3300 MHz,the corresponding geometric illumination area produces a theoretical gain withG0=25.6 K Jy-1(Jiang et al.2020).The aperture efficiency η of the FAST UWB receiver can be estimated by η=Gain/G0.The maximum and minimum gains are,respectively,0.56 and 0.30 at 500–3300 MHz.All derived aperture efficiencies are listed in Table 2.
2.5.System Temperature
System temperature is a synthetic contribution from the noise of receiver (Trec),the continuum brightness temperature of the sky(Tsky),emission of the Earth's atmosphere(Tatm),and radiation of the surrounding terrain (Tscat) (Campbell 2002;Jiang et al.2020) as
Figure 5 displays the system temperature (Tsys) within ZA of 26.4° for UWB 500–3300 MHz measured by observing cold sky on 2023 March 5.The raw data were converted to antenna temperature with the noise data in Figure 1.The data points,which are deviated from the main curve,result from strong RFI.The UWB system temperatures are 90–130 K for the band of 500–3300The high system temperature mostly arises from the uncooled UWB receiver,whose parameters are presented in Liu et al.(2022).The measured system temperature (Tsys) for UWB 500–3300 MHz are also listed in Table 2.Such high system temperatures require lengthy integration times for compensation.In the future,once there is enough space in the feed cabin,the UWB receiver will have a cryogenic low-noise front-end installed;then,a lower system noise temperature and a higher detection sensitivity could be achieved.

Figure 5.The system temperature within ZA of 26.4°for UWB 500–3300 MHz measured by observing cold sky on 2023 March 5.Four separated UWB bands are indicated with different colors.
3.Spectral-line Backend and Observations
3.1.Backend
At the backend,the whole UWB passband is separated into four subbands,0–1100 MHz,800–1900 MHz,1600–2700 MHz,and 2400–3500 MHz.Each subband has 1,048,576 channels,so the frequency resolution is~1049.04 Hz (or~1 kHz).Any two adjacent bands have some overlapping frequency ranges to compensate for the shortcomings of the analog filter.The effective frequency ranges are 500–1000 MHz,900–1800 MHz,1700–2600 MHz,and 2500–3400 MHz,but the recommended frequency ranges for science observations are 500–950 MHz for UWB-1,950–1750 MHz for UWB-2,1750–2550 MHz for UWB-3,and 2550–3300 MHz for UWB-4 (see details in Table 1).Combining the four subbands,the UWB could simultaneously and effectively cover the frequency ranging from 500 to 3300 MHz(see Figure 1).The observed data are recorded in the spectral-line backend using a dual linear polarization (XX and YY) mode.The sampling time is adjustable,e.g.,in 0.1 s,0.2 s,0.5 s,or 1.0 s.
3.2.Observation Modes
All the observation modes available in the FAST 19-beam array can be used in the UWB receiver,such as Drift,OnOff,OTF,and so on(see details in Jiang et al.2020).However,we have to remember that the UWB only has one receiver available for observation.The setup parameters for scanning velocity is also the same as those for the FAST 19-beam array.The maximum scanning velocity is 15″ and 30″ per second in direction of DEC and RA,respectively.
3.3.Radio Frequency Interference
In radio astronomy,RFI becomes more and more serious for radio observational facilities (Kesteven 2005;An et al.2017;Zeng et al.2021;Zhang et al.2022).RFI always influences the search and study of interesting astronomical objects.Figure 6 displays the whole bandwidth with one minute integration using UWB 500–3300 MHz.In many tests,we found that,in different sky directions,the RFI distribution at different frequencies is generally similar to that shown in Figure 6,but the intensities vary.Additionally,the low frequency bands(500–950 MHz)have more serious RFI pollution than the other high-frequency bands (Zhang et al.2020).All the emission lines are basically RFI,except for the H I line at 1420 MHz.The extremely strong and evident RFIs mainly come from communication satellites and navigation satellites (Wang et al.2021).Therefore,we must carefully avoid areas of strong RFI.

Figure 6.The spectral bandpass and RFI distribution with one minute integration for UWB 500–3300 MHz measured by observing cold sky on 2022 November 23.The emission lines basically are RFI,except for the H I line at 1420 MHz.
3.4.H I and OH lines
Figure 7 shows Arp 220 (IC 4553) OH emission and H I absorption lines observed by the UWB receiver with 600 s ontime integration.Arp 220 is a well-known starburst galaxy with a redshift of 0.018 40(Baan et al.1982).The observed redshift frequencies of the OH and H I lines are,respectively,1637 and 1395 MHz,which are covered by the UWB-4 and UWB-2 bands,respectively.In 600 s integration,the measured spectral rms is around 15.27 mJy with an original channel space of 1.0 kHz.For the H I absorption line of Arp 220 (see the H I line in Figure 7),the measured flux density by the FAST UWB receiver is only~3% higher than the Arecibo 300 m observations (Mirabel 1982).In addition,for the OH emission line of Arp 220 with the rest frequency of 1665.402 MHz (see the right OH peak in Figure 7),the measured flux density by the UWB is also only~3% higher than the Arecibo 300 m observations(Baan et al.1982).However,for the OH emission line of Arp 220 at its rest frequency of 1667.359 MHz(see the left OH peak in Figure 7),the measured flux density by the UWB is~10% higher than the Arecibo 300 m observations(Baan et al.1982).This is probably because the OH flux density of Arp 220 at 1665.402 MHz is variable (Darling &Giovanelli 2002).Generally,our flux density and velocity measurements (OH and Hi lines) of Arp 220 are coincide well with Arecibo 300 m observations (Baan et al.1982;Mirabel 1982;Mirabel &Sanders 1988).This further suggests that the FAST UWB receiver already demonstrates good performance for spectral scientific observation at 500–3300 MHz.

Figure 7.Arp 220 (IC 4553) OH emission and H I absorption lines simultaneously covered by the UWB-3 and UWB-2 bands,respectively.Arp 220 is a well-known starburst galaxy with redshift of 0.01840 (Baan et al.1982).For the FAST UWB observed lines,the integration time is 10 minutes,and they have been smoothed into a frequency resolution of 12.0 kHz,leading to an rms of 4.41 mJy.The dotted and dashed curves present the OH and H I lines observed by Arecibo 300 m from Baan et al.(1982)and Mirabel(1982),respectively.The integration time is 25 minutes for the Arecibo OH line,but for the Arecibo H I line there is no integration-time parameter recorded in Mirabel (1982).
4.Summary
The FAST has been running well since it began its commission when construction was completed on 2016 September 25.The 19-beam receiver covering 1.05–1.45 GHz is used for most of its scientific observations.However,highfrequency observations,e.g.,OH lines at rest frequencies of 1665 and 1667 MHz,are needed to study star formation in the Milky Way and nearby galaxies.The precision of the designed FAST reflector has met observational requirements at the high frequency of around 3000 MHz.
A new uncooled UWB receiver,simultaneously covering 500–3300 MHz,was mounted in the FAST feed cabin in 2022 June,and has passed a series of observational tests.The whole UWB band has been separated into four independent bands,but the recommended frequency ranges for users are UWB-1 for 500–950 MHz,UWB-2 for 950–1750 MHz,UWB-3 for 1750–2550 MHz,and UWB-4 for 2550–3300 MHz.Each band has 1,048,576 channels in the total frequency range,resulting in an adequately high spectral resolution of 1 kHz.At 500–3300 MHz,the antenna gain is around 14.3–7.7 K Jy-1,the aperture efficiency is around 0.56–0.30,the system temperature is around 88–130 K and the HPBW is around 7.6′–1.5′.The measured antenna parameters above are listed in Table 2 for data reduction.The measured standard deviation of pointing accuracy is better than~7.9″,when ZA is within 26.4°.In addition,the sensitivity and stability of the UWB receiver are confirmed to satisfy expectations through spectral H I and OH observations.The measured Arp 220 (OH and H I lines) flux density and velocity coincide well with Arecibo 300 m observations.This further suggests that the FAST UWB receiver already demonstrates good performance in taking sensitive observations for various scientific goals at 500–3300 MHz.
In the future,once there is enough space in the FAST feed cabin,the UWB receiver will have a cryogenic low-noise frontend,and then the performance of the UWB receiver will be significantly improved.For example,the system temperature would decrease~50 K and the antenna gain would increase~2.5 K Jy-1.That will help us to make more sensitive observations towards more various scientific goals than at present.
Acknowledgments
This work is supported by the National Key R&D Program of China No.2018YFE0202900.C.P.Z.acknowledges support by the West Light Foundation of the Chinese Academy of Sciences(CAS).C.C.and H.F.L.thank support by the National Natural Science Foundation of China Nos.11803044,11933003,12173045,and 12273072.This work is sponsored partly by the CAS South America Center for Astronomy(CASSACA)and the China Manned Space Project No.CMS-CSST-2021-A05.FAST is a Chinese national mega-science facility,operated by the National Astronomical Observatories of CAS (NAOC).We also wish to thank the anonymous referee for comments and suggestions that improved the clarity of the paper.
杂志排行
Research in Astronomy and Astrophysics的其它文章
- In Search for Infall Gas in Molecular Clouds: A Catalogue of CO Blue-Profiles
- Pulsation Analysis of High-Amplitude δ Scuti Stars with TESS
- Cross-correlation Forecast of CSST Spectroscopic Galaxy and MeerKAT Neutral Hydrogen Intensity Mapping Surveys
- Mock X-Ray Observations of Hot Gas with L-Galaxies Semi-analytic Models of Galaxy Formation
- NuSTAR View of the R-Γ Correlation in the Hard State of Black Hole Lowmass X-Ray Binaries
- Fermi Blazars in the Zwicky Transient Facility Survey: A Correlation Study