Cross-correlation Forecast of CSST Spectroscopic Galaxy and MeerKAT Neutral Hydrogen Intensity Mapping Surveys
2023-09-03YuErJiangYanGongMengZhangQiXiongXingchenZhouFurenDengXueleiChenYinZheMaandBinYue
Yu-Er Jiang ,Yan Gong ,Meng Zhang ,Qi Xiong ,Xingchen Zhou ,Furen Deng ,Xuelei Chen,5,6,Yin-Zhe Ma,and Bin Yue
1 National Astronomical Observatories,Chinese Academy of Sciences,Beijing 100101,China;gongyan@bao.ac.cn
2 School of Astronomy and Space Sciences,University of Chinese Academy of Science (UCAS),Beijing 100049,China
3 Science Center for China Space Station Telescope,National Astronomical Observatories,Chinese Academy of Sciences,Beijing 100101,China
4 NAOC-UKZN Computational Astrophysics Centre (NUCAC),University of KwaZulu-Natal,Durban,4000,South Africa
5 Department of Physics,College of Sciences,Northeastern University,Shenyang 110819,China
6 Center for High Energy Physics,Peking University,Beijing 100871,China
7 School of Chemistry and Physics,University of KwaZulu-Natal,Westville Campus,Private Bag X54001,Durban 4000,South Africa
8 Department of Physics,Stellenbosch University,Matieland 7602,South Africa
Abstract Cross-correlating the data on neutral hydrogen (H I) 21 cm intensity mapping with galaxy surveys is an effective method to extract astrophysical and cosmological information.In this work,we investigate the cross-correlation of MeerKAT single-dish mode H I intensity mapping and China Space Station Telescope (CSST) spectroscopic galaxy surveys.We simulate a survey area of~300 deg2 of MeerKAT and CSST surveys at z=0.5 using Multi-Dark N-body simulation.The PCA algorithm is applied to remove the foregrounds of H I intensity mapping,and signal compensation is considered to solve the signal loss problem in H I-galaxy cross power spectrum caused by the foreground removal process.We find that from CSST galaxy auto and MeerKAT-CSST cross power spectra,the constraint accuracy of the parameter product ΩHIbHIrHI,g can reach~1%,which is about one order of magnitude higher than the current results.After performing the full MeerKAT H I intensity mapping survey with 5000 deg2 survey area,the accuracy can be enhanced to <0.3%.This implies that the MeerKAT-CSST crosscorrelation can be a powerful tool to probe the cosmic H I property and the evolution of galaxies and the Universe.
Key words: (cosmology:) large-scale structure of universe–(cosmology:) cosmological parameters–Cosmology
1.Introduction
Probing the large-scale structure (LSS) of the Universe has always been one of the main missions of cosmological observations.Constraining the property of dark matter and dark energy,recovering the primordial fluctuations and testing gravity theories are all in need of cosmological surveys with large survey area and wide redshift coverage.To achieve this target,line intensity mapping (LIM) has been proposed and proven to be an efficient technique.LIM makes use of the emission lines from the energy level transition of atoms or molecules,such as H I 21 cm,C II,CO,Lyα,Hα,[O III],etc.(see,e.g.,Visbal&Loeb 2010;Carilli 2011;Gong et al.2011;Lidz et al.2011;Gong et al.2012,2013;Silva et al.2013;Gong et al.2014;Pullen et al.2014;Uzgil et al.2014;Silva et al.2015;Gong et al.2017;Fonseca et al.2017;Gong et al.2020).These lines can reflect different properties and progresses of galaxy evolution,and can be good tracers of the LSS.
Instead of the traditional observations targeting the resolvable sources,intensity mapping probes accumulative intensity of all sources in a spatial volume (voxel) defined by survey spatial and frequency resolutions.So even though some sources are too faint to be detected in traditional sky surveys,in principle,their signals can be probed in intensity mapping.In addition,the frequency shifts of the emission lines are a natural probe of redshift,so intensity mapping is expected to be a powerful tool to obtain cosmic 3D matter structure information traced by emission lines from galaxies with high efficiency and relatively low cost.Among various emission lines,the H I 21 cm line from atomic hydrogen is the most widely studied in intensity mapping research (see e.g.,Chen 2011,2012;Battye et al.2013;Dickinson 2014;Newburgh et al.2014;Bandura et al.2014;Santos et al.2015;Smoot &Debono 2017;Wang et al.2021;Cunnington et al.2023;Deng et al.2022;Zhang et al.2022;Spinelli et al.2022;Perdereau et al.2022).Besides being a main probe of epoch of reionization,the neutral hydrogen 21 cm line has a tight connection with star formation and galaxy evolution,and it can trace the galaxy and hence dark matter distribution at low and high redshifts.
While many experiments about H I intensity mapping have been proposed or are already running,the foreground contamination problem is still one of the biggest challenges,as the foregrounds can be as large as five orders of magnitude higher than the signal.The high brightness temperature of the Galactic emission and other sources makes the H I signal hard to be detected from auto-correlations.In principle,crosscorrelating the 21 cm observation with an optical galaxy survey in the same survey area is a good method to reduce the foreground contamination and instrumental noise,and extract the signal (e.g.,Chang et al.2010).The signal-to-noise ratio(SNR)can be significantly improved since the foregrounds and instrumental noise of different wave bands in different surveys are barely correlated.
However,in practice,the cross-correlation result is not fully satisfied due to the complex components of the foreground.So,the foreground removal algorithms are still needed in crosscorrelations.Various algorithms have been applied,including the blind foreground removal techniques like principal component analysis(PCA)(Davis et al.1985)and independent component analysis (ICA) (Wolz et al.2014) which make use of different frequency smoothness of foreground and signal,the polynomial/parametric-fitting method which fits the physical properties of the foreground (Bigot-Sazy et al.2015),machine learning (ML) methods (Li &Wang 2022),etc.Although signal loss and foreground residual are usually inevitable,foreground removal techniques do make progress and are necessary in cross-correlation detection.
Currently,positive results on H I abundance and H I-galaxy correlation have been obtained by several experiments.The Green Bank Telescope (GBT) implemented their H I intensity mapping correlation detection with the Deep2 optical redshift survey (Chang et al.2010),WiggleZ Dark Energy Survey(Masui et al.2013) and eBOSS survey (Wolz et al.2022).In addition,the Parkes radio telescope also presented their work on correlating H I intensity mapping with the 2dF galaxy survey (Anderson et al.2018).Recently,MeerKAT accomplished H I intensity mapping correlation detection with the WiggleZ survey (Cunnington et al.2023).They all constrain the H I-galaxy correlation parameter product ΩHIbHIrHI,gat different redshifts,where ΩHI,bHIandrHI,gare the H I energy density parameter,H I bias,and correlation coefficient of H I and galaxy,respectively.In this work,we will determine the constraint power on neutral hydrogen parameters by the observations of MeerKAT and the next-generation galaxy survey of China Space Station Telescope (CSST).
MeerKAT is a pathfinder project of the Square Kilometre Array (SKA)and in the future will become a part of SKA-mid(Santos et al.2017;Bacon et al.2020).It is a state-of-the-art intensity mapping instrument which is capable of complementing and extending cosmological measurements at a wide range of wavelengths.While MeerKAT is a large interferometric array which can access small scales of cosmic structure,singledish mode is preferred in intensity mapping experiments.We plan to perform MeerKAT H I intensity mapping crosscorrelation with the China Space Station Optical Survey(CSS-OS) (Zhan 2011;Cao et al.2018;Gong et al.2019;Zhan 2021).CSS-OS is the major observation project of CSST,and it will cover 17,500 deg2of sky area in a 10 yr working time.In addition,the spectroscopic survey of CSS-OS will provide a large amount of data in the form of a galaxy catalog with verified redshift using slitless gratings.CSST is planned to start its observation around 2024,while MeerKAT will still be working full-time before SKA which will begin full operations in 2028,and these two surveys will have a large overlapping survey area.Thus we believe MeerKAT H I intensity mapping and CSST galaxy survey would make promising crosscorrelation detection in the coming future.
This paper is organized as follows: in Section 2,we introduce our method of creating mock data of MeerKAT H I intensity mapping and CSST spectroscopic galaxy surveys;in Section 3,we apply the PCA algorithm to remove the foreground in H I intensity map;in Section 4,we calculate the galaxy auto and H I-galaxy cross power spectra,and discuss the signal compensation method for cross power spectrum;in Section 5 we forecast the constraints on relevant cosmological parameters;we conclude our work and provide discussion in Section 6.
2.Mock Data
We generate MeerKAT intensity maps and CSST spectroscopic galaxy survey data using MultiDark cosmological simulations (Klypin et al.2016).MultiDark is a suite ofNbody cosmological simulations which have been carried out by L-GADGET-2 code.Most simulations of this suite have 38403particles,with box sizes ranging from 250 Mpc/hto 2500 Mpc/h.Based on the survey area and redshift of the MeerKAT observation plan,the Small MultiDark Planck simulation(SMDPL) has been chosen in this work.The box size of SMDPL is 400 Mpc/h,and halos in SMDPL boxes are identified through the halo finding code Friends-of-Friends(FOF) with relative linking length of 0.2 (Davis et al.1985).The relevant simulation and cosmological parameters that SMDPL adopted are listed in Table 1,and its halo catalog can be acquired from the CosmoSim database.9The data are available at https://www.cosmosim.org/.
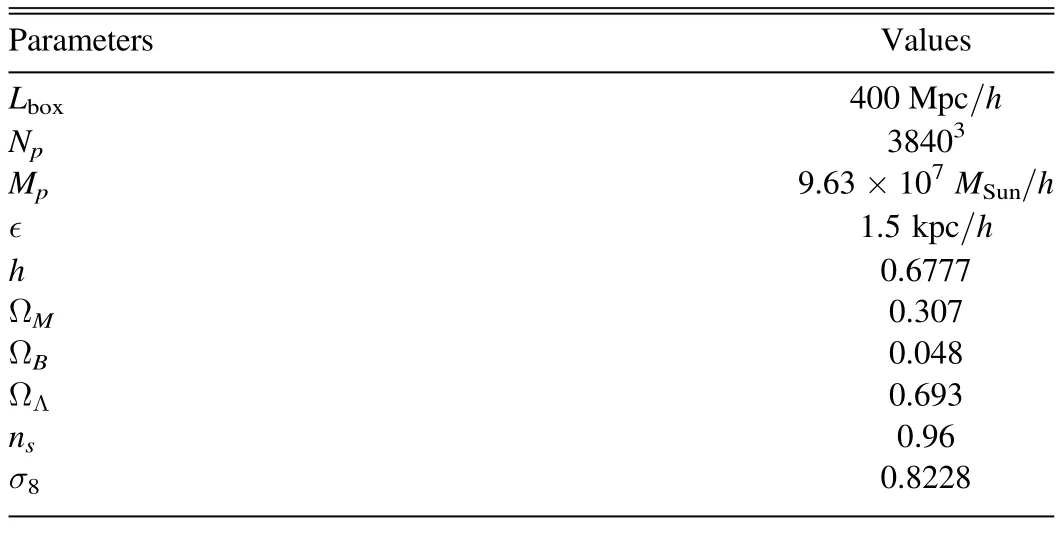
Table 1Simulation Parameters for SMDPL
In our work,we focus on the cosmology atz=0.5,which is one of the main observational target redshifts for both CSST and the MeerKATL-band.So,our mock data are generated from the snapshot70 of SMDPL,whose redshiftz≈0.5.We also find that the 400 Mpc/hbox size of the snapshot70 corresponds to a survey of~297 deg2atz=0.5.Note that the non-flat sky effect may need to be considered for a~300 deg2sky coverage,but for simplicity,we still use the flat sky approximation in our mock data analysis.
2.1.H I Intensity Mapping with MeerKAT
Since H I could only survive from ultraviolet (UV)radiation in dense clumps in galaxies after the epoch of reionization,we assume that H I can only exist in halos hosting galaxies atz=0.5.We place the H I mass in the center of a halo,as has been proven to be reasonable in previous studies (see,e.g.,Villaescusa-Navarro et al.2018).Under this assumption,we construct a catalog applying the halo H I mass function given by Villaescusa-Navarro et al.(2018),and it takes the form
HereMis the halo mass,and we have three free parameters,i.e.,α,M0andMmin,which determine the shape of the fitting curve at different redshifts.In order to get the values of these three parameters atz=0.5,we perform interpolation on the fitting values atz=0 and 1 given in Villaescusa-Navarro et al.(2018).Then we find that α=0.42,M0=2.50×10¹⁰h-1M⊙,Mmin=1.13 ×10¹²h-1M⊙atz=0.5.In Figure 1,we plot theMHI-Mrelation atz=0.5 (green solid curve),and the relations atz=0 (blue dashed curve) and 1 (orange dashed curve) from Villaescusa-Navarro et al.(2018) are also shown for comparison.
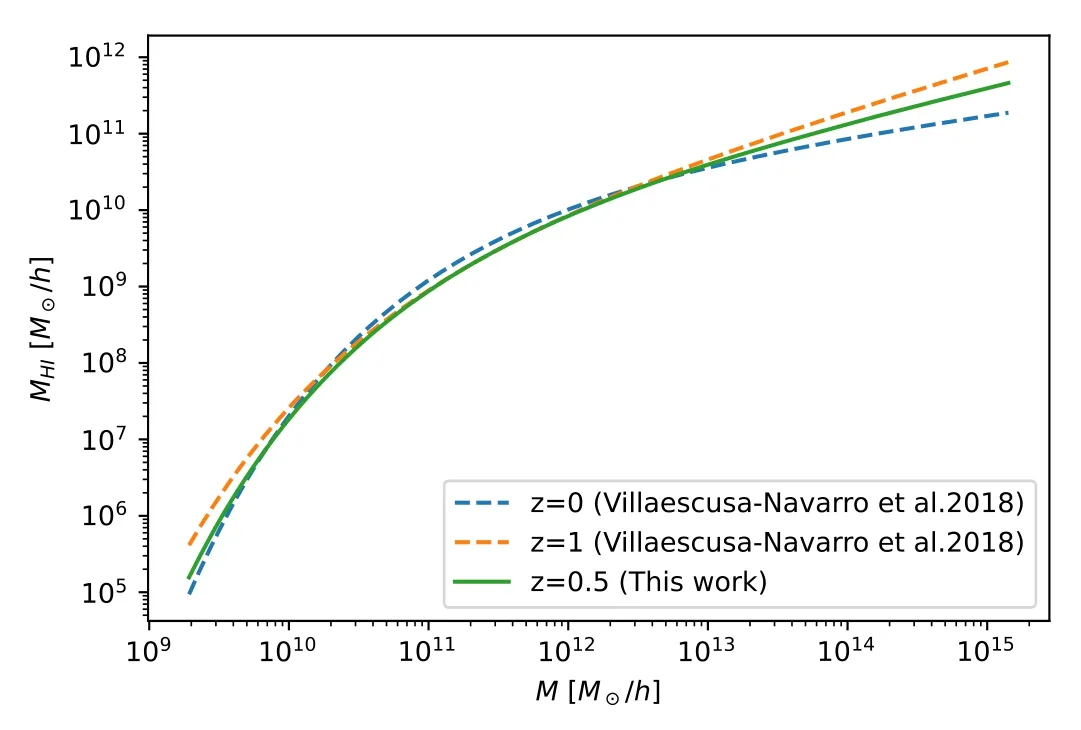
Figure 1.The H I mass MHI and halo mass M relation we use at z=0.5(green curve),which is derived from the relations at z=0 (blue dashed curve) and z=1 (orange dashed curve) given in Villaescusa-Navarro et al.(2018).
Then we can calculate the H I energy density parameter ΩHI,which is expressed as
Next,we can create the map of H I brightness temperature.The brightness temperature field δTtraces the underlying matter fluctuations δmas
whereTb(z)is the mean H I brightness temperature atz,andbHIis the H I bias,which can be estimated by
Hereb(M,z) is the halo bias.So for a voxel with position on the sky r and redshiftz,its H I brightness temperature can be derived as
whereE(z)=H(z)/H0represents the evolution of the Hubble parameter,andT0is a redshift dependent parameter which is defined asT0=189hE(z)-1(1+z)2.ThenTb(z) can be estimated by averagingTb(r,z) at different positions in the simulation box.Atz=0.5,we find that the corresponding mean H I brightness temperature isTb=0.145mK in our simulation.The brightness temperature of the H I distribution(right panel) and the corresponding dark matter distribution(left panel) in the simulation are shown in Figure 2.
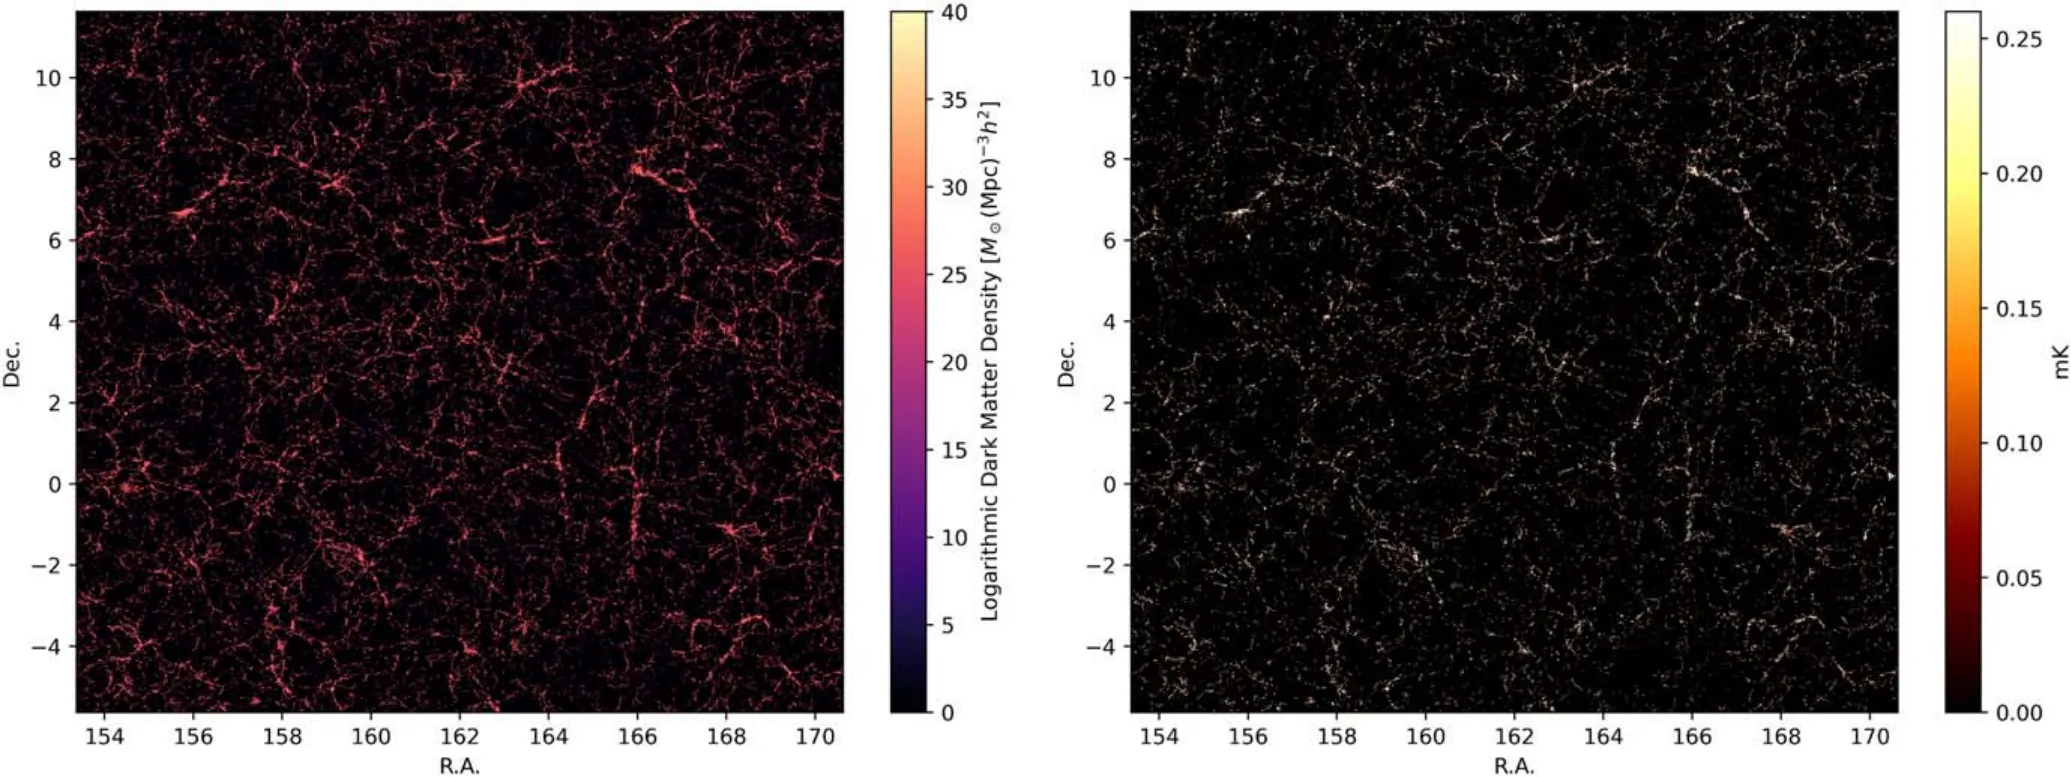
Figure 2.(Left)The dark matter distribution at z=0.5 in the simulation.(Right)The corresponding map of H I brightness temperature.We can see that the H I map has similar structure as dark matter,and can be a tracer for the LSS.
After obtaining the H I brightness temperature in the simulation box,our next step is to create the H I intensity maps with MeerKAT instrumental parameters and observational effects.Since the observable of H I intensity mapping is the H I brightness temperature of each voxel in the survey volume,we divide the survey volume (here this means our simulation box) into voxels that MeerKAT can observe.The details are as follows:
1.To divide frequency bins along the line of sight (LOS),we put the center of the box atz=0.5.As the box length of 400 Mpc/his known,the redshift range of the survey volume can be calculated.We find that the redshift range of snapshot70 is 0.415~0.590,corresponding to the observed H I frequency of 1004.14 MHz~893.30 MHz.This frequency range can be observed by the MeerKATL-band with frequency resolution of 0.2 MHz,and it allows us to divide the survey volume into 554 bins,such that each bin width is about 0.72 Mpc/h.For simplicity,we assume that there is no redshift evolution in this range.
2.As for the pixels perpendicular to LOS,since we plan to use the single-dish mode observation,resolution θ is defined by the full width at half maximum (FWHM) of the beam of an individual dish.Then the beam size or spatial resolution is given by
where λobsis the observed wavelength,andDdishis the dish aperture diameter.We find that the spatial resolution of MeerKAT atz=0.5 is 1.36 deg.Since the size of a simulation box is 400×400 (Mpc/h)2,corresponding to a 297 deg2survey area,the number of pixels in an H I map is found to be 12×12 for MeerKAT single-dish mode observation.We note that the current spatial resolution given by the FWHM of the beam is a choice of simplicity,and more realistic resolution will be considered in the future work.Moreover,since the beam size actually changes with frequency,it can introduce more complexity and challenges into the foreground subtraction.However,because our simulation snapshot has no redshift evolution,for simplicity,we do not consider the frequency dependence of the beam size,and set the pixel size of all the maps to be the same.
The H I signal intensity map obtained by MeerKAT atz=0.5 is displayed in the upper left panel of Figure 3.In real observation,the H I intensity mapping will be contaminated by different components,such as system thermal noise,foreground emission from the Milky Way,radio frequency interference (RFI),etc.,which can lower the SNR.Here we model the system thermal noise of a single-dish as Gaussian noise.Its root mean square (rms) noise temperature can be calculated as (Bull et al.2015)
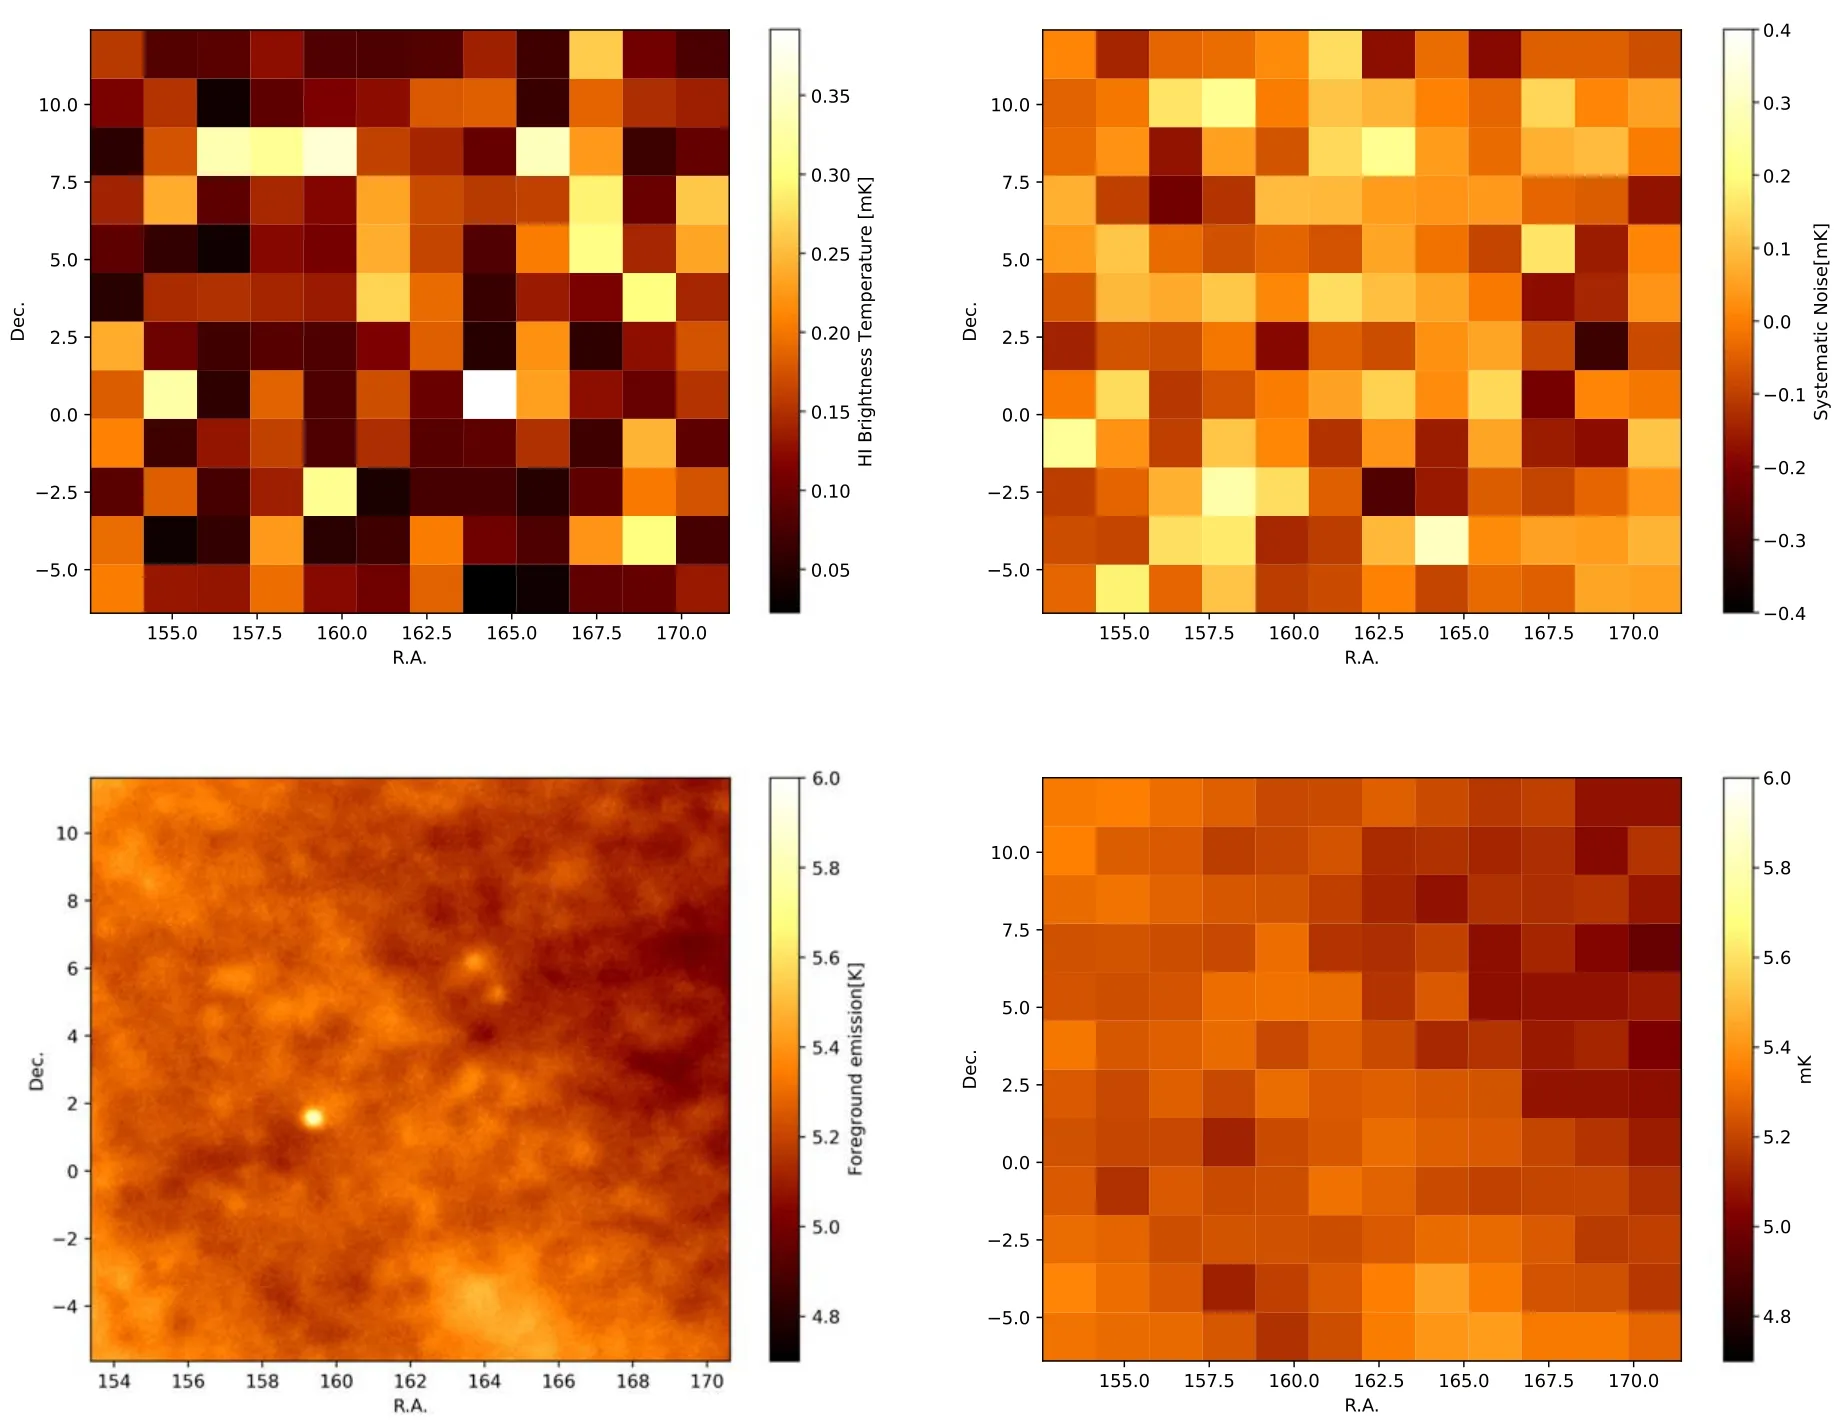
Figure 3.The mock MeerKAT intensity maps for the central slice in the simulation at ν=946.7 MHz or z=0.5.The upper left panel is the signal map of H I brightness temperature.The upper right panel features the map of Gaussian system noise.The bottom left panel is the total foreground map generated by GSM2016 at ν=946.7 MHz,including Galactic synchrotron emission,free–free emission,cold and warm dust thermal emission,the cosmic microwave background (CMB)anisotropy,and Galactic H I emission.The bottom right panel depicts the total sky map observed by MeerKAT containing all components we consider.
where δν is the frequency interval,ttotis the total observation time of the survey,Aeis the effective collecting area of a dish,ASis the survey area andTsysis the system temperature which is usually described as a combination of four components,yielding
The mean sky temperature can be approximated byTsky=2.725+1.6(ν/GHz)-2.75,andTspill,TatmandTrecrepresent spillover temperature,atmosphere temperature and receiver temperature,respectively.The values of these parameters we adopt are listed in Table 2,and then we obtain σT=0.102 mK at ν=946.7 MHz(z=0.5).The corresponding map of Gaussian system noise is shown in the upper right panel of Figure 3.
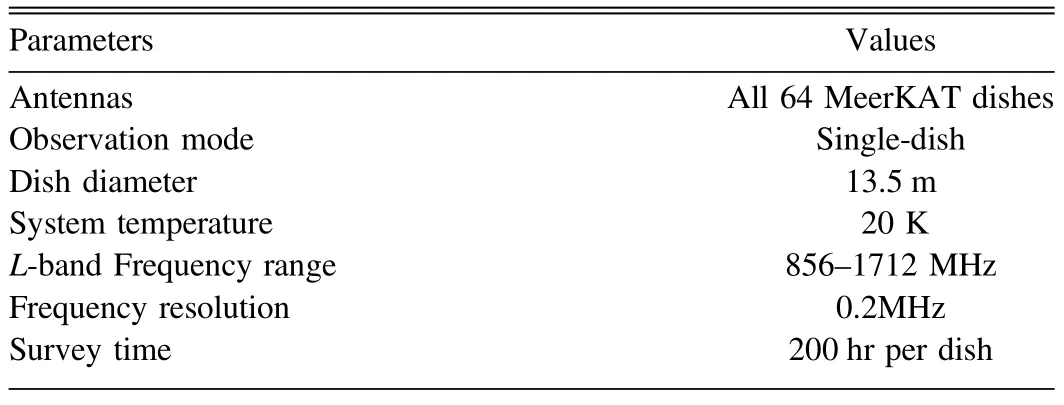
Table 2Specifications of the MeerKAT Observations
The foreground emission from the Milky Way is actually the main challenge to H I intensity mapping.The brightness temperature of foregrounds can be more than 4 orders of magnitude brighter than H I signal,so its effect has to be seriously taken into account in our forecast of MeerKAT observation.Here we generate the foreground emission using the GSM2016 model (Zheng et al.2017).GSM2016 is an improved model of the original GSM.It uses an extended PCA algorithm to identify different components in the diffuse Galactic emission.Six components of Galactic emission that match the known physical emission mechanisms are obtained,i.e.,synchrotron emission,free–free emission,cold and warm dust thermal emission,the CMB anisotropy and Galactic H I emission.This algorithm allows it to make use of 29 sky maps from 10 MHz to 5 THz,and do interpolation to produce a fullsky map of any frequency in this frequency range.
To apply the foreground model on our H I map,the coordinates of the survey area have to be set.According to the previous work(Wang et al.2021),we set our survey area at 153°.38 <R.A.<170°.62 and -5°.62 <decl.<11°.62,mostly intersecting with the WiggleZ 11 hr field (Drinkwater et al.2010)(Drinkwater et al.2018).Note that this choice of survey area is only for discussion here,since this area has relatively low Galactic emission in the full-sky map.For future observation of MeerKAT-CSST cross-correlation,the target survey area can be chosen from anywhere in the overlapping region of the MeerKAT and CSST survey area with relatively low foreground emission.We generate foreground maps at each frequency bin,and then interpolate them to the center of each voxel.
The foreground map for the survey area at ν=946.7 MHz(z=0.5) is shown in the lower left panel of Figure 3.We find that the foreground contamination we consider is about 4 orders of magnitude brighter than the H I signal.After combining the H I signal,foreground emission and system noise maps,we obtain the total sky map observed by MeerKAT.The mock total observational map is displayed in the lower right panel of Figure 3.Since the H I signal has totally drowned in the contamination,the foreground contaminant subtraction algorithms have to be applied to extract the H I signal.We will discuss the foreground removal method in the next section.
2.2.Galaxy Survey with CSST
We use the same simulation data SMDPL snapshot70 to create the mock data of CSST spectroscopic galaxy survey.We utilize Python package Halotools10https://halotools.readthedocs.io/to generate a galaxy distribution for each dark matter halo in the simulation.First,the structure of a cold dark matter(CDM)halo can be described by an NFW profile (Navarro et al.1996).The halo concentration-mass relation under the NFW profile is fitted by Dutton &Macciò (2014)
whereMviris the halo virial mass,cviris the concentration of the corresponding halo,andaandbare the fitting parameters,which are expressed as
After obtaining the halo concentration,the halo occupation distribution (HOD) model can be applied to get galaxy distribution.The HOD model can determine the population of the central galaxy and satellite galaxies in a given halo.The central galaxy occupation statistics are given by Zheng et al.(2007)
and central galaxies are assumed to reside at the centers of their host halos.On the other hand,the distribution of satellite galaxies is written as
When redshift,cosmological model and the threshold of galaxy absolute magnitude are set,the values of the parameters in Equations (12) and (13) are calculated by the Halotools package based on the model published in Zheng et al.(2007).Atz=0.5,we set the threshold of galaxy absolute magnitude to be -19.5,and then these parameters are expressed as
The final step in generating a galaxy catalog is to determine which galaxies can be observed by CSST.We assign luminosity to galaxies using the relation between host halo mass and galaxy luminosity,which is given by Vale&Ostriker(2008)
and for simplicity,if assuming all satellite galaxies have the same luminosity,we have
HereLgroup,LcenandLsatare the luminosities of a galaxy group,central galaxy and satellite galaxy,respectively.Nsatis the number of satellite galaxies in a galaxy group.The parameter values are chosen to beLA=0.3L⊙,L0=2.8×10⁹L⊙(Zheng et al.2007),a=29.78,b=29.5 andc=0.0255(Vale&Ostriker 2008).Then the galaxy luminosity can be converted to the magnitudes in CSST spectroscopic bands.Since the magnitude limit of the CSST spectroscopic survey is~23 mag (Gong et al.2019;Zhan 2021),galaxies whose magnitude is under this limit can be selected to form the CSST spectroscopic galaxy survey catalog.After the selection,we find that the galaxy number density in the simulation box is 9.07×10⁻³(Mpc/h)-3,which is in good agreement with the result in previous works (e.g.,Gong et al.2019).The mock map of the CSST spectroscopic galaxy survey atz=0.5 is depicted in Figure 4.
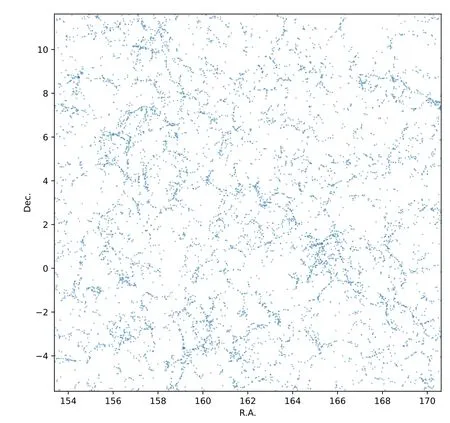
Figure 4.The mock galaxy map observed by CSST spectroscopic survey at z=0.5,which is in the same survey area as the MeerKAT H I intensity mapping survey.
3.Foreground Removal
The signal extraction of H I intensity mapping highly relies on foreground removal efficiency.Theoretically,cross-correlation with other tracers (e.g.,galaxies and other emission lines)could be a good way to extract the H I signal and reduce the effects of foregrounds and system noise,since the foregrounds and instrumental noise of different wave bands in different surveys should be uncorrelated.However,it is found that it will be problematic if directly cross-correlating the raw intensity map with other surveys.In Figure 5,we show the results of our mock MeerKAT H I raw(blue data points)and signal(red data points) maps cross-correlated with the mock CSST spectrographic galaxy map.We can see that the effect of foreground contamination is still too huge to extract correct cosmological information,as there is large deviation at all scales between the two curves.This indicates that extra foreground removal methods should be performed before cross-correlation.
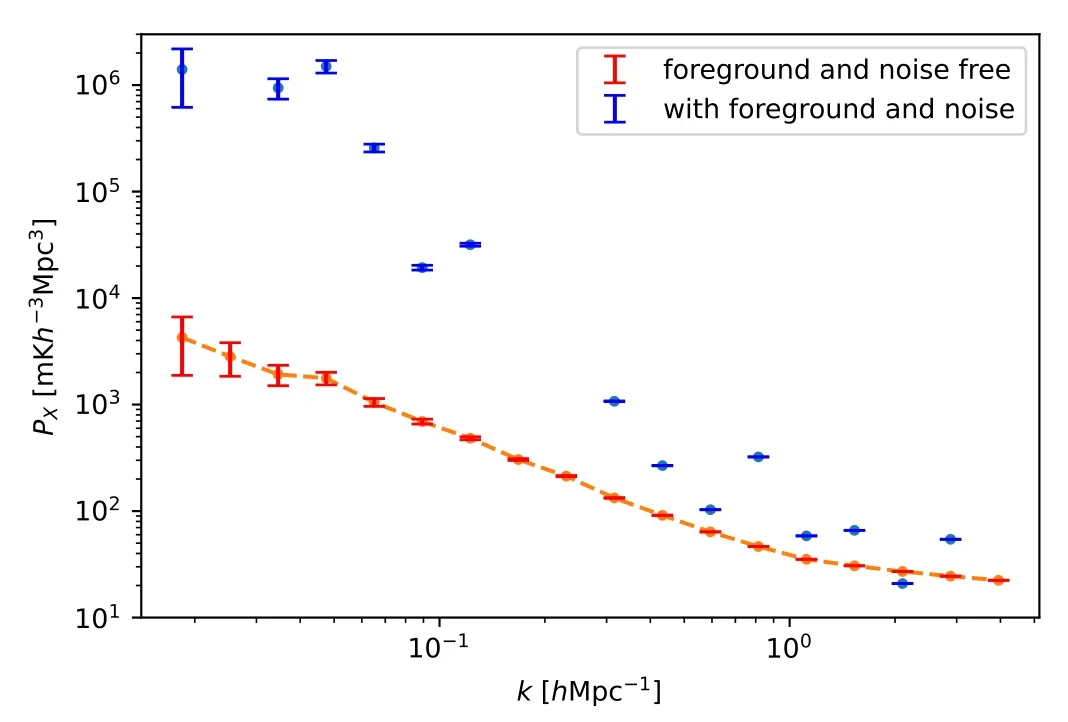
Figure 5.The cross-correlation power spectra of the MeerKAT H I raw (blue data points)and signal(red data points)intensity maps with the corresponding CSST spectroscopic galaxy map.The missing data points in the raw cross power spectrum (blue data points) have negative or small values,so they are not shown in the figure.
Many methods of foreground removal have been discussed in previous works.These include blind foreground subtraction algorithms,such as PCA and Singular Value Decomposition(SVD) (Davis et al.1985;Paciga et al.2011;Villaescusa-Navarro et al.2017;Yohana et al.2021),ICA (Wolz et al.2014),correlated component analysis (CCA) (Bonaldi et al.2006),extended ICA (Zhang et al.2016) and FASTICA(Chapman et al.2012),non-parametric Bayesian methods,like Gaussian Progress Regression (GPR) (Mertens et al.2018;Ghosh et al.2020),and methods assuming some physical properties of the foregrounds,such as polynomial/parametricfitting(Bigot-Sazy et al.2015;Alonso et al.2015).Here we use the PCA/SVD algorithm to perform foreground removal.Since the PCA method is based on identifying different correlations of corresponding components in the frequency domain,in principle,this method can distinguish the foregrounds from the H I signal by their different frequency smoothness.Besides,PCA does not require much knowledge about the models of data components,which is suitable in our case.On the other hand,SVD is a similar method that can be applied on a data matrix,which can obtain similar results as PCA but with fewer calculation steps.
To apply our foreground removal procedure,first we transform the simulation result into data matrixXwith dimensionsNν×Np.HereNνis the number of frequency channels,andNpis the number of pixels in a frequency channel of the intensity map.Then SVD can decompose the data matrixXin the form
whereWTandRare called left and right singular vectors,respectively,and Σ is a rectangular diagonal matrix of singular values.WTandRare unitary matrices,which are defined asWW*=1 andRR*=1,where asterisk denotes conjugate transpose.Generally,when dealing with a complex valued matrixX,Equation(17)takes the form ofX=W*ΣR.But since our data matrixXis real,we use transposed matrixWTto substituteW*.
Singular vectorsWTand singular values Σ are equivalent to the eigenvectors and eigenvalues in PCA,respectively.So,we rank the singular vectors in decreasing order of their corresponding singular values to identify the principal components of the data matrix,i.e.,the foregrounds.
Then we compose anNν×mprojection matrixW′ with the firstmcolumns ofW,wheremis the number of components which are thought to be foregrounds.In Figure 6,we show the first five principal components decomposed from the data matrixX.We notice that the first two components are relatively smooth in frequency smoothness,so they are identified as foreground,i.e.,m=2.The dominant principal components will be obtained when the data matrixXis projected onto the projection matrixW′ by
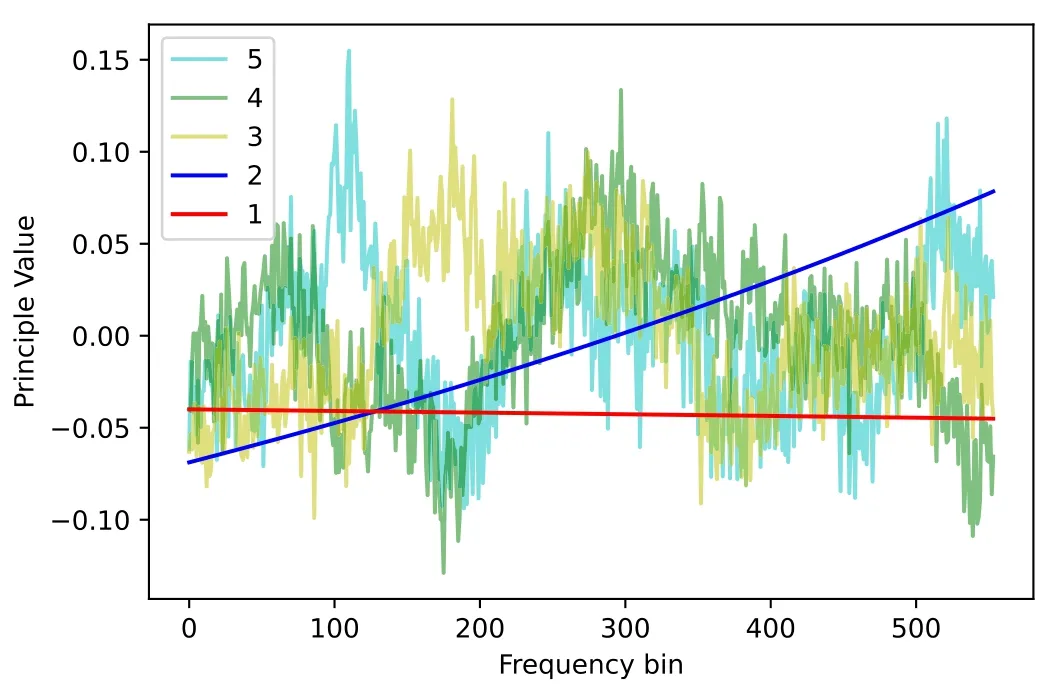
Figure 6.The first five principal components of data matrix X decomposed by the PCA/SVD method.
HereUis the foreground information constructed from the data matrix.Then the H I signal can be recovered as
At last,the recovered signal is projected back to the original map position for obtaining the foreground-removed map.In principle,the foreground-removed map is composed of H I signal and system noise.The effect of the PCA procedure can be indicated more clearly in a line intensity power spectrum as we discuss in the next section.
4.Power Spectrum
Here we introduce the process of line intensity power spectrum estimation.We consider the cross-correlation using the method based on Wolz et al.(2017).The galaxy survey and intensity mapping data are converted into galaxy over-density and brightness over-temperature contrasts respectively by
where the angled brackets denote mean values.The Fast Fourier Transforms ofN(xi) andTHI(xi) are given by
Then our estimators for the galaxy auto-correlation power spectrumPgand the cross power spectrum between the gridded galaxy distribution and intensity mapP×at wavevector k are
HereV=4003(M pch-1)3is the survey volume andPSNis the shot noise term for the galaxy survey,which can be estimated byPSN=The error for the corresponding power spectrum is given by Feldman et al.(1994);Wolz et al.(2017)
where Δkisk-bin width,PTis the H I brightness temperature power spectrum andPN(k) is the power of system noise.
After performing the PCA/SVD foreground subtraction,we estimate and show the cross power spectra of CSST galaxy with foreground-free (blue data points) and foregroundsubtracted (red data points) maps in MeerKAT H I intensity mapping survey,in the left panel of Figure 7.We can find that signal loss can be caused by the PCA procedure,and it becomes severe especially at large scales that we are interested in.Therefore,the over-eliminated signal must be compensated.
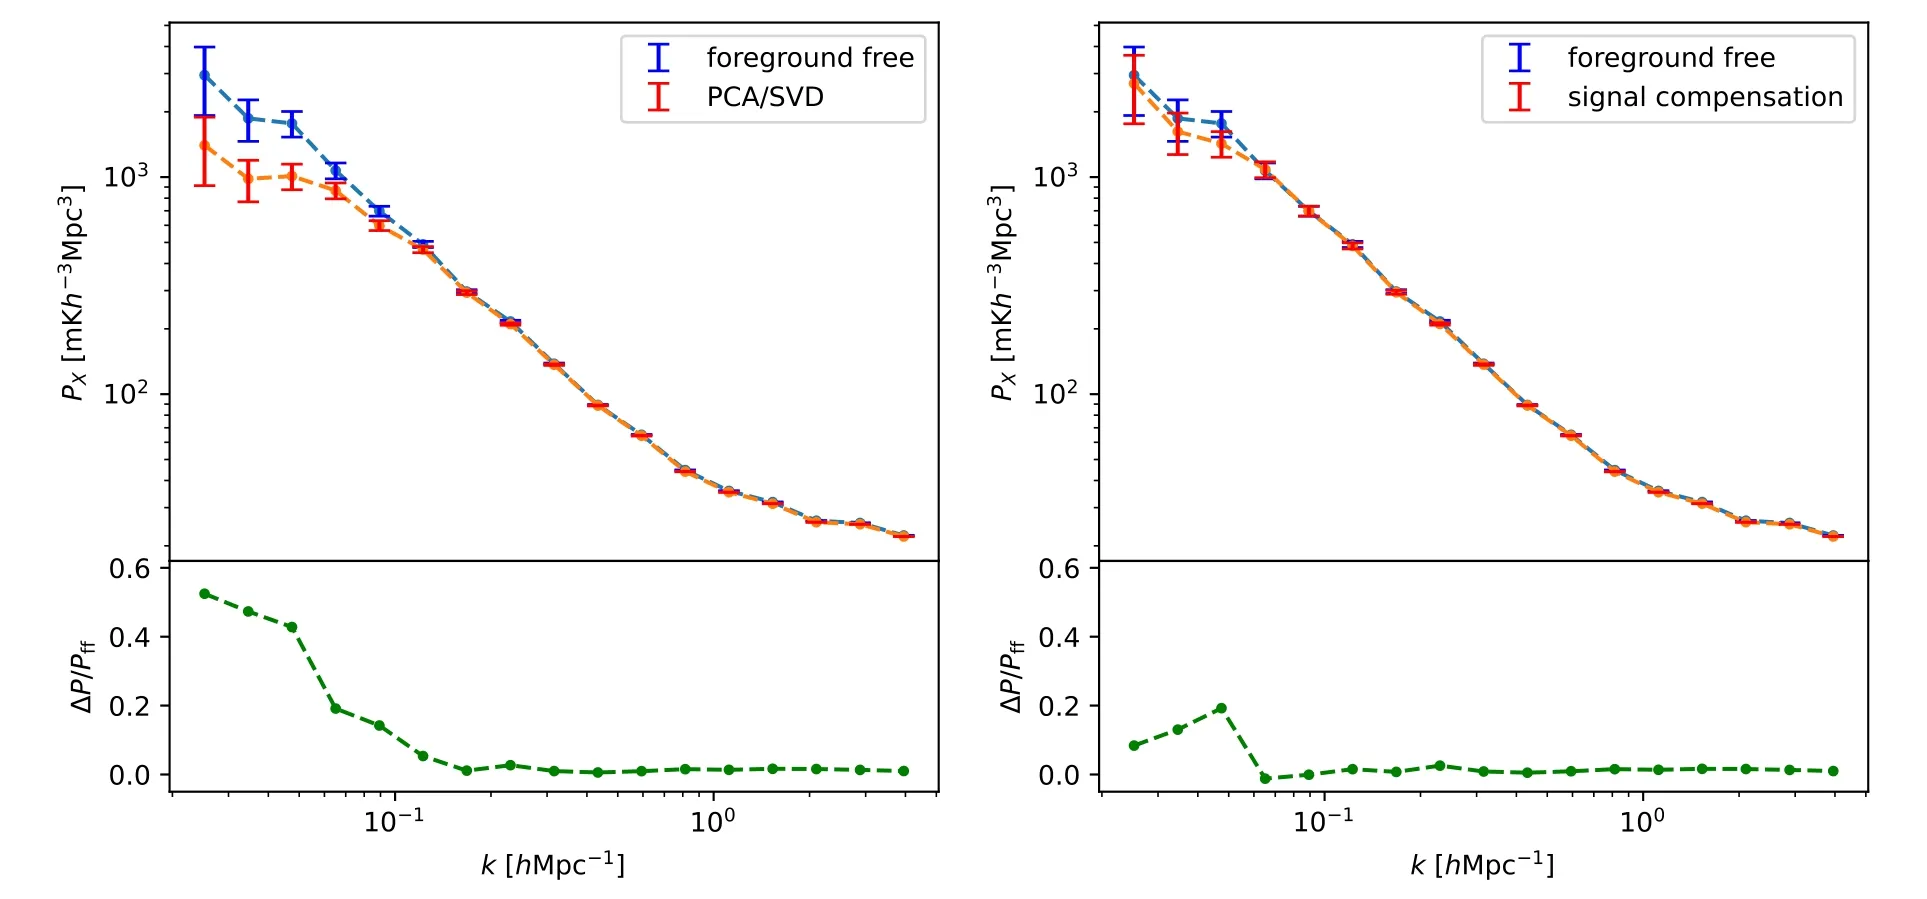
Figure 7.(Left) The MeerKAT-CSST cross power spectra of H I foreground free (blue data points) and foreground removal by PCA (red data points).(Right) The same as the left panel but considering signal compensation after PCA foreground removal(red data points).The corresponding relative errors are also shown in green dashed curves in the lower panels,where ΔP is the difference between the two power spectra in the upper panels.
We compensate the cross power spectrum based on the method given in Cunnington et al.(2022),and the procedure can be described as follows:
1.First,we generate mock data of halos.The mock halo catalogs include the information on mass and position,which follows the same matter power spectrum and halo mass function as SMDPL simulation.
2.After that we calculate the H I brightness temperature of mock data using the H I model and MeerKAT observational effect.So,the mock H I intensity map data are obtained and further transformed into mock data matrixYwith the same dimensions of data matrixX.
3.Then the mock data matrixYis injected into the data matrixX.We apply the PCA clean on this data combination with the same projection matrixW′ we used in previous PCA.Then the foreground-removed mock data can be written as
So,we can determine the signal loss of the cross power spectrum betweenYandYc.
4.Finally,the transfer function is constructed as
whereP() denotes the cross power spectrum andYgis the corresponding mock galaxy data.To compensate the signal loss,we construct the transfer functionT(k) by generating 100 H I intensity mapping mock data and corresponding galaxy survey data.The result of the transfer function is shown in Figure 8.
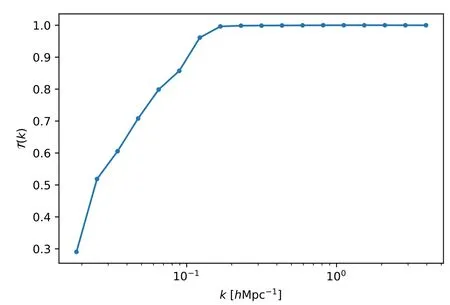
Figure 8.The transfer functionT(k) estimated by 100 H I intensity mapping and corresponding galaxy survey mock data to compensate the signal loss after PCA foreground removal.
The cross-correlation compensated by transfer function is displayed in the right panel of Figure 7.We can find that the signal compensation method we use is efficient,and that the compensated power spectrum is very consistent with the foreground-free power spectrum at 1σ.Although overcompensation may happen due to large variance in the lowkrange,the transfer function is reliable enough that the effect of signal loss can be effectively reduced.
5.Cosmological Constraint
After obtaining the cross power spectrum of MeerKAT H I intensity mapping and CSST spectroscopic galaxy surveys,we can explore the constraint power on cosmological parameters.Theoretically,the power spectra of different tracers have a similar relation to the matter power spectrum.The galaxy auto power spectrumPg(k) is related to the matter power spectrumPm(k) as
wherebgis the galaxy bias.On the other hand,the relation of the H I intensity auto power spectrumPT(k) and the matter power spectrum can be written as
HerebHIis the H I bias,andTbis the mean H I brightness temperature in the Universe.Then the cross power spectrumP×(k) is given by
whererHI,gis the H I-galaxy correlation coefficient that indicates the correlation strength.
Note that the parameterT0can be absorbed into the H I biasbHI(Wolz et al.2017).Hence,in real observations,we can actually constrain the parameter product ΩHIbHIbgrHI,gusing the cross power spectrumP×(k),if the matter power spectrumPm(k) is known.Furthermore,the constraint on ΩHIbHIrHI,gcan be achieved,ifbgcan be properly estimated.Besides,in the ideal case,if the auto-correlation of H I intensity mapping can be detected at the same time,the correlation coefficientrHI,gcan be constrained byP×/(PgPT).Unfortunately,due to inevitable foreground residual,experiments which aim at the auto-correlation of H I intensity mapping have not achieved any convincing result so far.Here we assume the H I autocorrelation is unreachable,so that the cosmological parameter we can constrain by cross-correlation power spectrum is basically limited to ΩHIbHIbgrHI,gand ΩHIbHIrHI,gifbgcan be derived in a galaxy survey.
Since the matter power spectrum could be accurately calculated by a cosmological model,e.g.,ΛCDM,and assuming its uncertainty is small enough that it can be neglected compared to the H I parameters,the theoretical matter power spectrum could be a proper choice forPm(k).We use CAMB (Lewis et al.2000) to generate a non-linear matter power spectrumPm(k) atz=0.5.Here the values of cosmological parameters in CAMB are set to be the same as those in the MultiDark simulation(Klypin et al.2016),and we can adopt the values obtained from real cosmological observations in the real H I intensity mapping surveys.
In addition,bgcan be estimated from galaxy auto power spectrum as indicated in Equation (31),and the galaxy auto power spectrum derived from the mock data of CSST galaxy survey is displayed in Figure 9.With the help of the theoretical matter power spectrum,the correspondingbgcan be estimated as a function of wavenumberkas shown in Figure 10.As can be seen,the value ofbgpresents an increasing trend as the scale gets smaller.This is reasonable since the baryonic matter has more complicated physical mechanisms at smaller scales,like outflow feedback of galaxy and star formation process,which can significantly affect the density fluctuations.On the other hand,at linear scales,bgis shown to be a constant.We set the scale range to bek<0.3hMpc-1(Cunnington et al.2023;Deng et al.2022),and calculate the average value ofbgfrom the power spectrum.The average value and error ofbgare shown in Table 3.
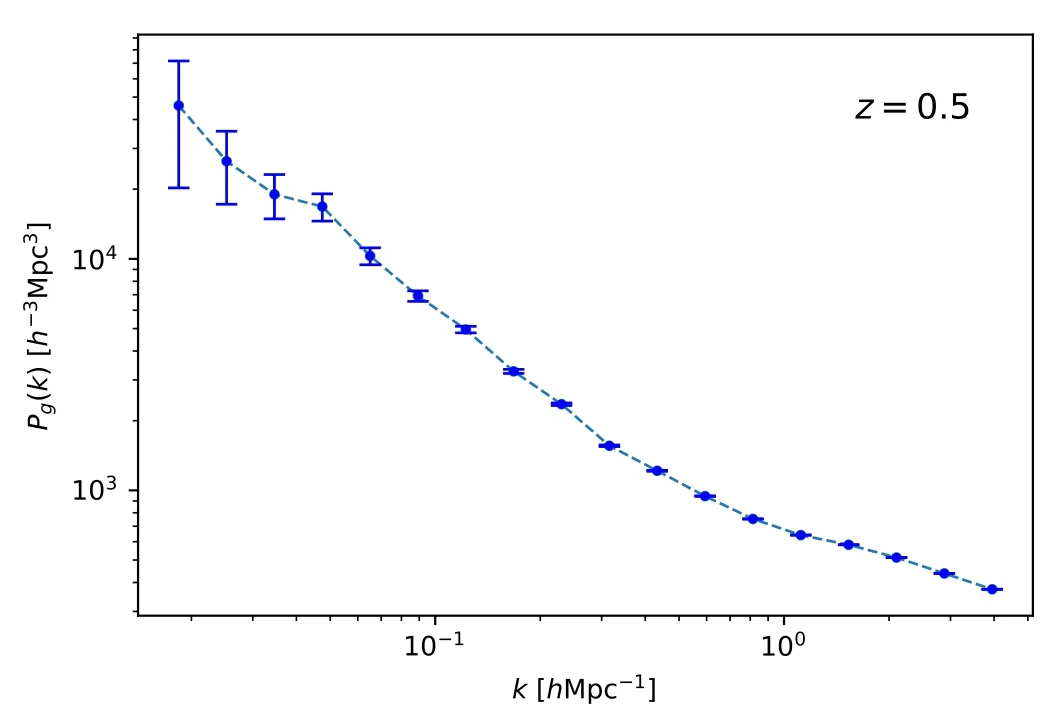
Figure 9.The galaxy auto power spectrum of CSST spectroscopic galaxy survey at z=0.5,which is derived from the simulation.
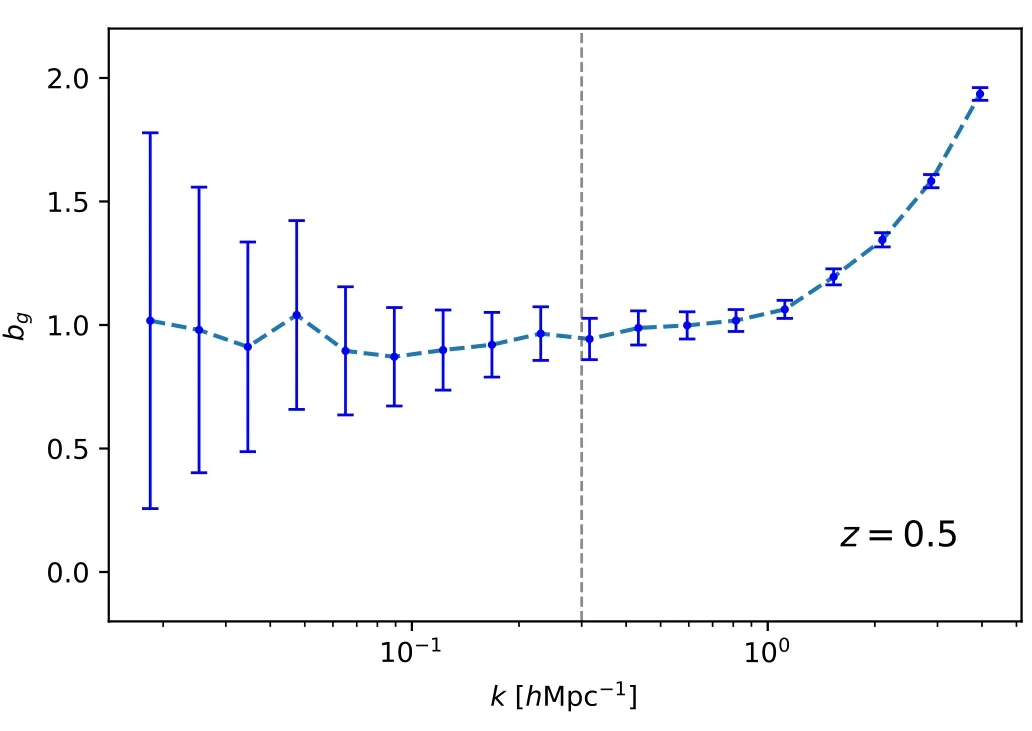
Figure 10.The galaxy bias factor bg for optical galaxies.The vertical dashed line is k=0.3 h-1 Mpc that signifies the boundary of the linear scales we consider.

Table 3The Value and Error of bg,ΩHIbHIbgrHI,g and ΩHIbHIrHI,g
In Figure 11,we show the constraint results of ΩHIbHIbgrHI,gand ΩHIbHIrHI,gas a function of wavenumberk.Similar tobg,we derive the average values of these two parameter products in the linear scales withk<0.3h-1Mpc,and the results are listed in Table 3.We find that the errors are~1% of the average values,which mean the precision of our future MeerKAT-CSST survey can be one order of magnitude more accurate than the present experimental result(Chang et al.

Figure 11.The constraint results of ΩHIbHIbgrHI,g (left panel) and ΩHIbHIrHI,g (right panel) from the cross-correlation of MeerKAT H I intensity mapping and CSST galaxy surveys.The vertical dashed lines are k=0.3 h-1 Mpc that indicate the boundary of the linear regime we consider.
2010;Masui et al.2013;Wolz et al.2022).Furthermore,if assumingrHI,gis close to 1 at linear scales,which is supported by the simulation results (e.g.,see Deng et al.2022,and our simulation givesrHI,g≃0.94 atk<0.3 Mpc-1h),the constraint on ΩHIbHIcan be accurately obtained.These indicate that the cross-correlation method is powerful in LIM surveys for cosmic neutral hydrogen,galaxy evolution and cosmological studies.
6.Summary and Discussion
H I intensity mapping is a promising technique of cosmological detection.Although due to strong foreground contamination,H I intensity mapping auto-correlation detection is still facing great challenges at the present stage,H I-galaxy crosscorrelation could be easier to achieve by extracting H I and cosmological information with the help of galaxy surveys.In this work,we have investigated the cross-correlation of MeerKAT H I intensity mapping and CSST spectroscopic galaxy survey atz≃0.5.
We first generate mock H I intensity maps of MeerKAT and galaxy catalog of CSST spectroscopic galaxy survey using SMDPLN-body simulations atz=0.5.The system noise and foreground emission are also taken into account when making the sky map.The voxel of a simulation box is divided according to the the frequency resolution ofL-band and beam size of MeerKAT single-dish mode.We constructed the H I model to transform the dark matter distribution in the simulation snapshot into H I distribution.Then we calculated the H I brightness temperature of each voxel to get H I intensity maps.The galaxy survey catalog is generated based on the NFW profile and HOD model,and the galaxy luminosity is derived by galaxy luminosity-halo mass relation.Then we filter the galaxies with the magnitude limit of CSST spectroscopic survey to produce the mock galaxy data.
We apply the PCA/SVD algorithm to remove the foregrounds in MeerKAT H I intensity mapping,and crosscorrelate the residual intensity map with the corresponding CSST galaxy map.The signal compensation is employed to solve the signal loss caused by the foreground removal process,and we construct the transfer function to compensate the cross power spectrum.After compensation,we derive the H I-galaxy cross power spectrum for constraining cosmological parameters.
We constrain the parameter products ΩHIbHIbgrHI,gand ΩHIbHIrHI,gusing the cross power spectrum,and find that the constraint accuracy can achieve~1%,which is one order of magnitude higher than the current result.Besides,note that our simulation is in a~300 deg2survey area,and in the future,the MeerKAT-CSST detection of H I-galaxy correlation can be performed on a much larger survey area of 5000 deg2.Then the constraint accuracy can be reduced to <0.3% level.This indicates that the cross-correlation of MeerKAT H I intensity mapping and CSST galaxy survey is powerful for exploring the property of cosmic neutral hydrogen and the evolution of galaxies and our Universe.
We also note that some assumptions in the current work still may be too simple which can affect the prediction of the results.For example,the frequency dependency of the beam size may contaminate the data,which will be hard to be removed by the PCA/SVD foreground removal process.Moreover,the non-flat sky effect also should be seriously included,especially for the 5000 deg2MeerKAT-CSST joint analysis in the future.Other issues,such as the simple HOD model and systematics used in the work,probably need to be considered more carefully with more powerful simulations and precise H I model in future work.
Acknowledgments
Y.J.and Y.G.acknowledge the support of 2020SKA0110402,MOST-2018YFE0120800,National Key R&D Program of China No .2022YFF0503404,and the National Natural Science Foundation of China (NSFC,Grant Nos.11822305,11773031 and 11633004).X.L.C.acknowledges support of the National Natural Science Foundation of China (NSFC,Grant Nos.11473044 and 11973047),and the Chinese Academy of Sciences grants QYZDJ-SSW-SLH017,XDB23040100,XDA15020200.Y.Z.M.is supported by the National Research Foundation of South Africa under Grant Nos.150580,120385 and 120378,NITheCS program “New Insights into Astrophysics and Cosmology with Theoretical Models confronting Observational Data”.This work is also supported by the science research grants from the China Manned Space Project with NO.CMS-CSST-2021-B01 and CMS-CSST-2021-A01.
杂志排行
Research in Astronomy and Astrophysics的其它文章
- In Search for Infall Gas in Molecular Clouds: A Catalogue of CO Blue-Profiles
- Pulsation Analysis of High-Amplitude δ Scuti Stars with TESS
- Mock X-Ray Observations of Hot Gas with L-Galaxies Semi-analytic Models of Galaxy Formation
- NuSTAR View of the R-Γ Correlation in the Hard State of Black Hole Lowmass X-Ray Binaries
- Fermi Blazars in the Zwicky Transient Facility Survey: A Correlation Study
- Spatially Resolved Properties of the GW170817 Host Galaxy
