Design andimplementation ofaccelerator control monitoring system
2023-07-05ChaoYuanWeiZhangTaoMaMinYuePengPengWang
Chao Yuan ·Wei Zhang ·Tao Ma ·Min Yue ·Peng-Peng Wang
Abstract IMPCAS has constructed and currently manages a large number of accelerator facilities.However, the current accelerator monitoring methods are unable to satisfy all of the device requirements.The accelerator control monitoring system(ACMS) was created and established to provide an efficient and accurate accelerator control monitoring system.It enables automatic alerting of problems with accelerator control systems and infrastructure.It utilizes a big data distributed stream processing engine and open-source monitoring tools.Metrics, logs, and EPICS PV values are the major three types of data that it monitors.Prometheus is primarily used to monitor metrics such as network traffic, hardware devices, and software operations.Graylog is used to monitor logs created by various applications and systems.We also created the EPICS Pulsar connector software, which allows us to transfer PV values to the Pulsar messaging cluster and use the Flink compute engine for real-time monitoring.The designed data management module allows users to define alert rules in a variety of ways.The ACMS enables the separation of the Flink business system and alarm rules.Users may use the data management module to add or alter alarm rules in real-time without having to restart the alarm software.This reduces the effect of alarm flooding when the accelerator reaches the beam shifting or shutdown condition and dramatically enhances alarm efficiency.The main components of the ACMS may be deployed in clusters, making it extremely versatile.Experimental results demonstrated that it has a higher throughput than the Phoebus Alarm system and can handle millions of monitoring indicators.The ACMS employs a modular framework that is very scalable.Long-term stability analyses were performed at the SESRI and HIRFL facilities.It achieved all of the intended goals and could greatly improve the accident handling efficiency while minimizing the failure time of the accelerator control system.
Keywords EPICS ·ACMS ·Pulsar ·Flink ·Graylog ·Prometheus
1 Introduction
An accelerator is a precision integrated complex system composed of multiple subsystems such as ion-source, power supply, magnet, high-frequency, vacuum, beam diagnostic,and cooling-water systems.The accelerator control system links the various subsystems and realizes cooperative operations.It operates continuously and any software or hardware malfunction may result in a beam loss or an accelerator shutdown.As a result, the real-time monitoring of the control system is extremely critical and required.It can identify prospective difficulties and optimize potentially uncertain aspects by monitoring indicators in real-time.When a failure occurs, the appropriate employees may be swiftly and properly contacted to deal with it, improving the accelerator’s operating efficiency.Many studies have recently been conducted on the operation monitoring of accelerator control systems.Some facilities have utilized open-source monitoring software.For example, CERN created the DIAMON system in 2009 to monitor control facilities and updated it to the COSMOS system in 2017 [1].The new system core makes use of the open-source component Icinga2 to monitor and visualize the accelerator control system architecture.SuperKEKB built their monitoring system with the opensource tool Zabbix, and they created the zabbix-epics-py plugin to integrate EPICS PV monitoring [2].Some monitoring software has also been based on EPICS.For example,Alarm Handler (ALH) was created for the Advanced Photon Source (APS).ALH is a basic EPICS OPI client application that provides an excellent overview of any outstanding alert conditions reported by the control system [3].It is written in C, receives data through the CA protocol, visualizes it, and can control alarms in great detail.ALH requires the presence of Motif and X11 headers and libraries.Kay Kasemir and Xihui Chen of the Oak Ridge National Laboratory (ORNL)created the Best Ever Alarm System Toolkit (BEAST) on the basis of ALH and applied it to the Spallation Neutron Source (SNS).BEAST’s architecture is designed in C/S.The core component Alarm server monitors PV according to the configuration information, generates alarm information, and writes it into the relational database.It realizes the persistent storage of data and is a Control System Studio (CSS)plug-in [4].With the release of the Java Platform Module System (JPMS), Kay Kasemir developed a JavaFX version of CSS and named it Phoebus.Phoebus’s Alarm system is specifically used for alarm monitoring.Unlike the BEAST,the Alarms message middleware has been upgraded from JMS to Kafka, and uses Elasticsearch to store historical data[5].Users can view historical data through Kibana.Alarms maintains alarm information using an XML file, which is particularly rigid when monitoring several PVs at the same time.It cannot avoid alarm flooding, especially when the accelerator equipment is repaired or shut down.Despite the fact that numerous researchers have made considerable progress in this area [6], Kafka’s broker will lose monitoring data when it fails, and data migration is extremely inconvenient, which is unacceptable for a large accelerator device such as the High Intensity Heavy-ion Accelerator Facility(HIAF) [7, 8].Thus, we proposed and constructed the accelerator control monitoring system (ACMS), which comprehensively monitor an accelerator control system with high reliability, throughput, and scalability.
This paper is organized as follows.Section 2 describes the overall architectural design of the ACMS.Section 3 introduces each sub-function module of the ACMS in detail, and Sect.4 offers the experimental findings and a discussion of the ACMS and Phoebus Alarm throughput testing.Finally,Sect.5 concludes this paper by discussing its contributions.
2 System design
The accelerator control system has numerous pieces of conventional and non-standard software and hardware.The ACMS was built with the intention of monitoring these for both functional and business purposes.In relation to the functionality, the system monitors the accelerator infrastructure for errors and breakdowns and notifies the system administrator or appropriate specialists as soon as a problem is detected.In relation to the business aspects, the system primarily focuses on the control system runtime data and offers support for the control accelerator.As a result,ACMS’s monitoring scope covers metrics, logs, and EPICS PVs [9-11].The metric monitoring mainly uses Prometheus[12], which is open source and collects component metrics by integrating various exporters.It perfectly solves most of the indicators monitored in the heterogeneous infrastructure.Graylog is used to monitor logs from various facilities[13].Its master-node mode is extensible, and the UI includes query and analytic features.We created a log alarm module for it because it supports permission management and offers a variety of log types and standards.The EPICS to Pulsar connector was developed to import EPICS PVs into Pulsar [14].Combined with the Flink real-time computing engine, we realize the real-time monitoring of EPICS PVs[15].(See the EPICS control system real-time monitoring section below for details.)
The whole system design, as illustrated in Fig.1, is separated into four layers: the underlying components, data acquisition, data calculation and storage, and visualization and management.The underlying components are primarily the various facilities we wish to monitor, including systems, software log files, hardware devices, and EPICS PVs.Data acquisition is the procedure of collecting data from monitored objects using various collectors.It serves as a data source for further data analysis.Data calculation and storage is the process of analyzing and storing the monitoring data.It includes processes such as real-time timestamp conversion, exception cleaning, data formatting and standardization, and alert information generation.Finally, the data are saved in databases such as Elasticsearch, MySQL, and InfluxDB [16, 17].The data are then used for displaying subsequent monitoring views and locating problems.Visualization and management creates a uniform portal for displaying various monitoring data.Simultaneously, we created Alert Center and DB manager modules to facilitate alert dissemination, rule maintenance, and historical data query features.
The ACMS employs a modular structure with distinct tiers, effective encapsulation, adaptable maintenance, and great scalability.Second, employing established open-source components and middleware technology boosts the processing capacity and dynamic scaling capabilities.Finally, the system has excellent stability and availability, can run continuously 24 h a day and 7 days a week without interruption,and satisfies the monitoring requirements of the accelerator control system’s numerous facilities.
3 Software development
3.1 Metric monitoring

Fig.1 ACMS system architecture diagram
The ACMS is built around metric monitoring.Metrics are statistics that are gathered at various points in time to describe how monitored metrics change over time.They are regarded as time series data and identified by names.Each indicator’s sample data provide at least three dimensions of information: the name, time, and value.Other labels such as alarm descriptions and monitored device locations are also provided for alerting information and future analysis.Prometheus is used to monitor metrics such as the network traffic and CPU memory consumption.Prometheus metrics are classified into four kinds.These include the univariate metric Counter, which only increases and never decreases,the univariate metric Gauge, which can increase or decrease,and the Histogram and Summary of several variables.As illustrated in Fig.2, Prometheus is part of the new generation of cloud native monitoring systems.It includes the following core modules: the Prometheus server, Pushgateway, exporters, Alertmanager, and graphical interface.
The Prometheus server is in charge of collecting, storing, and analyzing monitoring data.The Prometheus time series database is only available for 15 days and cannot retain a large number of measurements, which leads to the danger of data loss.To address ACMS’s demand for long-term monitoring data storage, we selected InfluxDB as an option for persistently storing monitoring data.For monitoring systems that cannot expose all of their internal data for Prometheus to pull as metrics on a regular basis,we provide Pushgateway to actively push the monitoring status to ACMS.Instead of exposing data to Prometheus,it functions as an intermediary component to gather data indicators from an external push.Then, Prometheus retrieves data from Pushgateway on a regular schedule.
Grafana is a free and open-source program for displaying massive amounts of measurement data [18].It is used in Prometheus to view and evaluate metric data.Exporter translates the acquired data into the appropriate text format and offers an HTTP interface for Prometheus to collect data on a regular basis.There are already over 120 exporters for typical open-source components, from which we mostly employ four: hardware, application, middleware,and system.Figure 3 depicts the graph we use to monitor H3C switch traffic using SNMP exporter.H3C switch equipment MIB files can be downloaded from the company’s official website [19].SNMP exporter collects the necessary switch status and traffic data depending on the provided MIB OIDs, and then exports these in a metric format that Prometheus can utilize.Prometheus provides PromQL, a data query DSL language, for analyzing metrics and generating alerts.The average traffic load from each switch port is calculated using PromQL.The produced traffic load data are also used as a time series metric that can be seen in Grafana and saved in the InfluxDB database.As a result, the ACMS can monitor changes in the traffic load across the whole control network and provide warnings concerning switch and access node conditions.
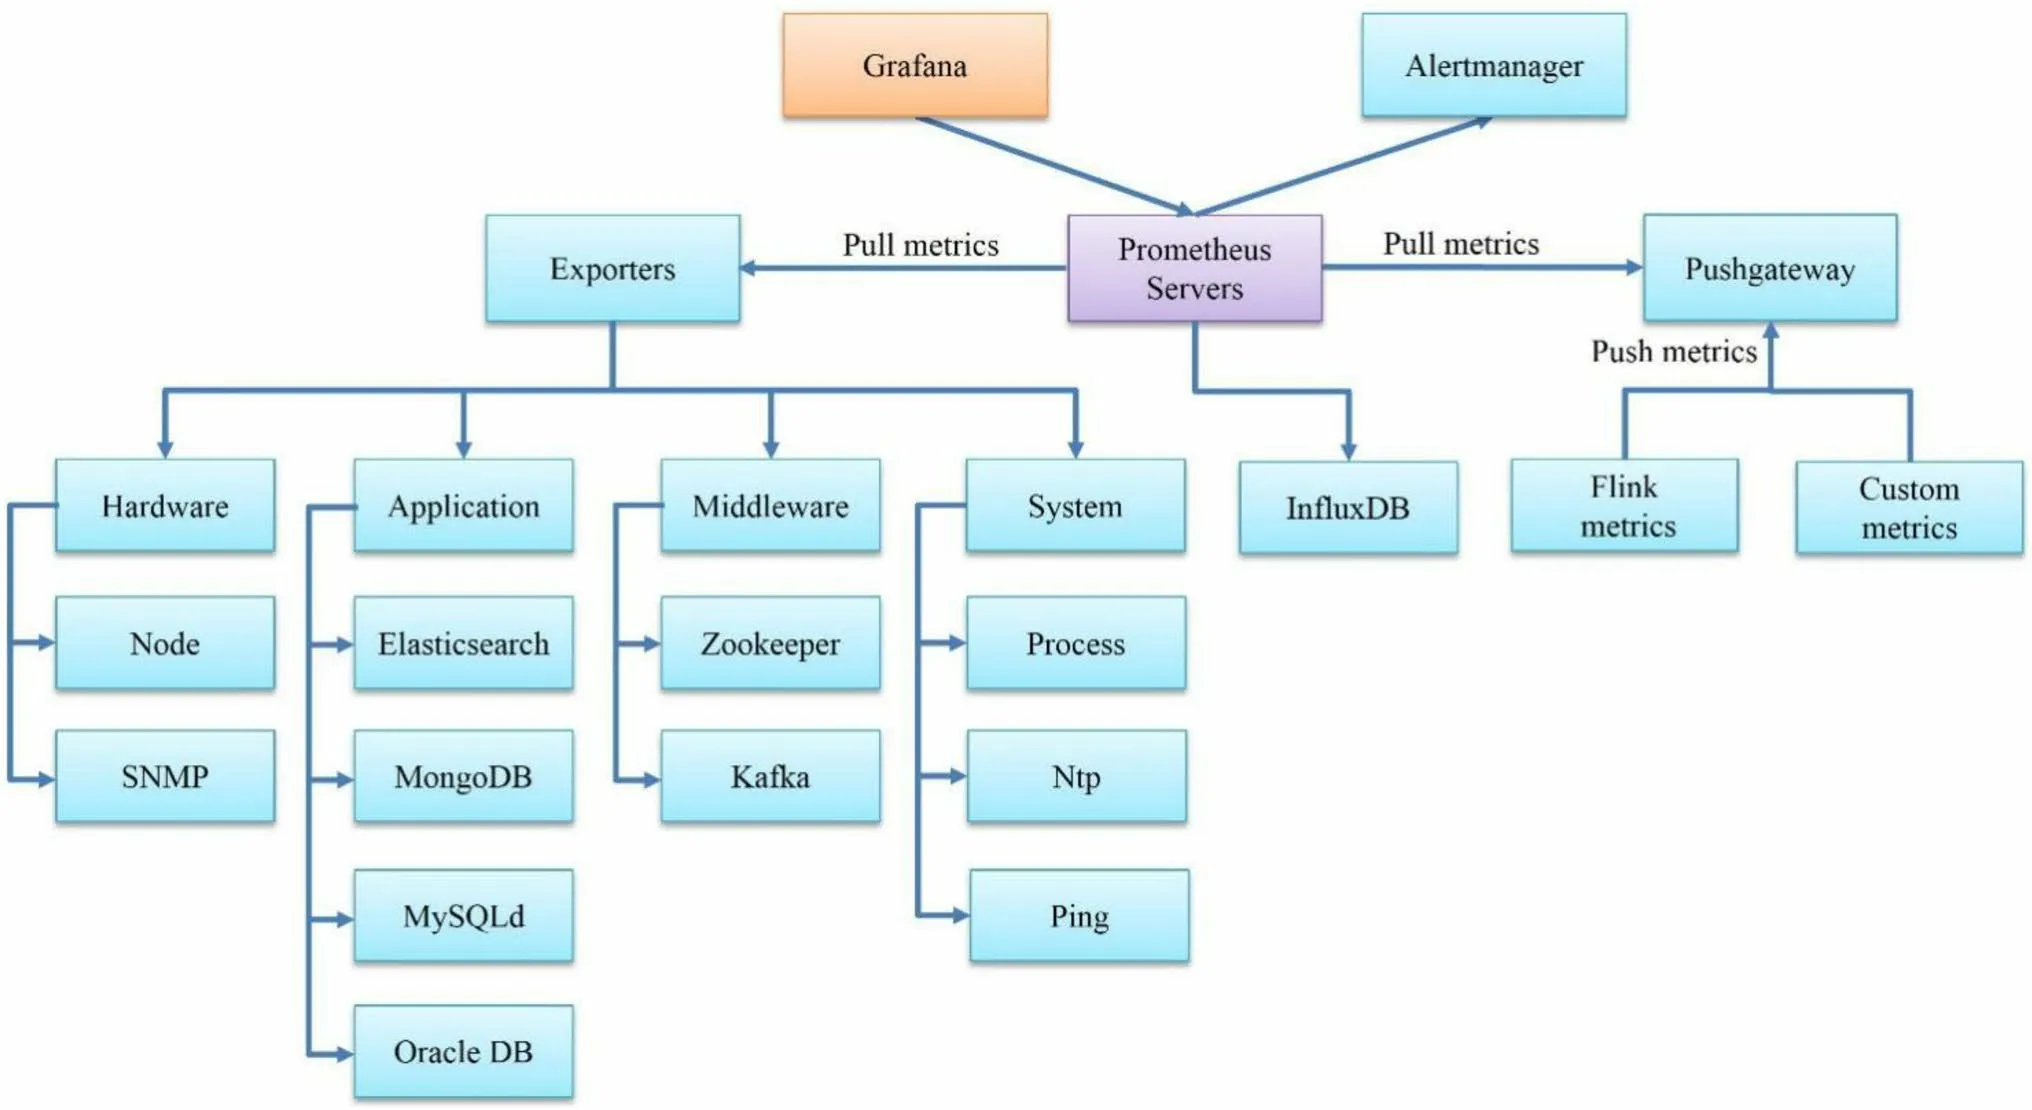
Fig.2 Metric monitoring alarm flowchart
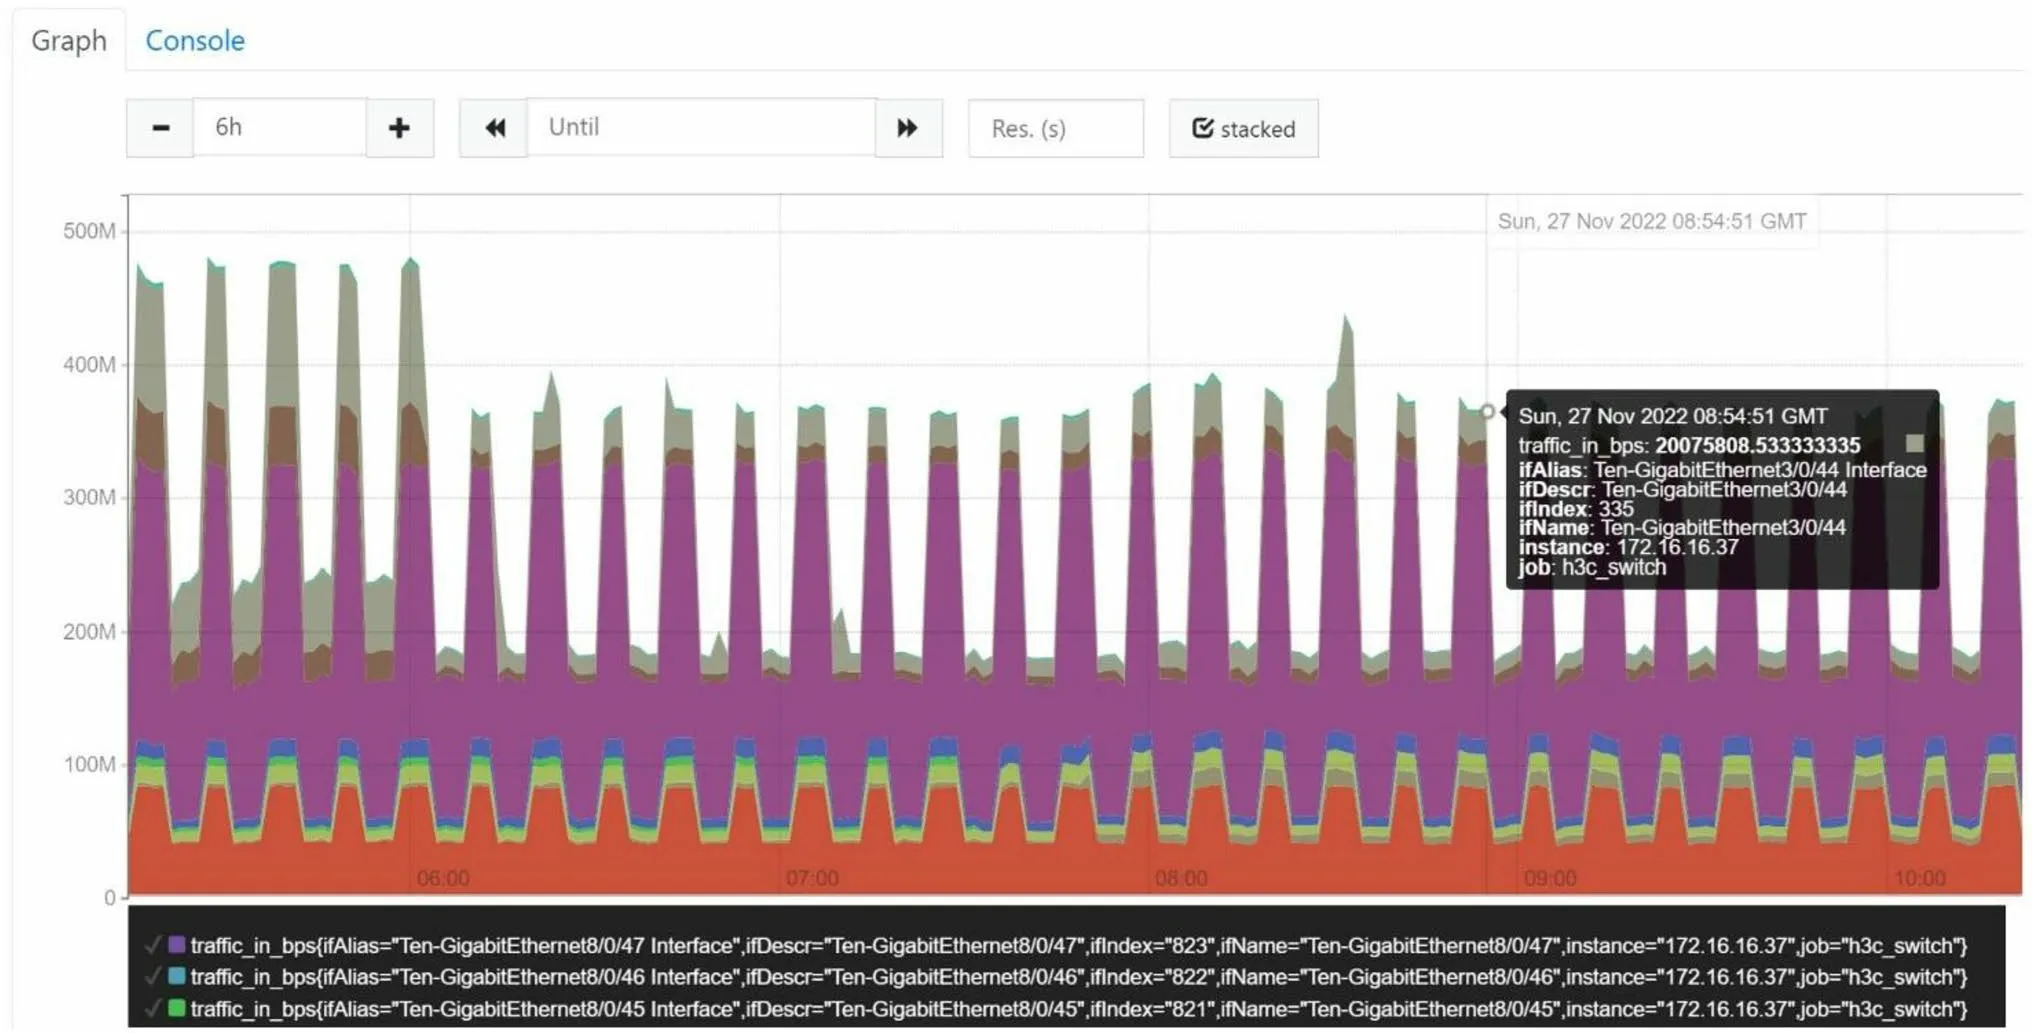
Fig.3 (Color online) SNMP monitoring network traffic graph

Fig.4 (Color online) Monitoring diagram of IOC server
In order to collect the operating indicators of the host,such as information about the CPU, memory, disk, and other devices, we use node exporter to provide Prometheus with monitoring data in a standard format.Figure 4 shows the resource monitoring information of the IOC host.Because the node exporter cannot cover all the monitored items,we use the process exporter to monitor different software processes of the accelerator control system, such as the number of processes and survival status of services.The acquired metrics are stored locally by the Prometheus server,and we define alert rules based on PromQL, such as the following:expr: 100- (avg by(instance) (irate(node_cpu_seconds_total{mode = “idle”}[5 m])) * 100) > 80.
If this rule is violated, an alarm regarding excessive CPU utilization is triggered, and the alarm information is sent to Alertmanager.Alertmanager processes received alerts in accordance with the configuration file and delivers alert reminders in a variety of formats.
3.2 Log monitoring
The accelerator control system’s infrastructure consists of numerous network devices, databases, servers, applications, and hosts.To increase the accelerator’s operating efficiency, logs from various devices and systems must be stored, monitored, and analyzed.We created a log monitoring system based on Graylog to capture all of the logs generated by the various devices and applications.Graylog is a log aggregation and analysis program that is also open source.It includes capabilities similar to those of ELK but is more succinct and efficient [20].Figure 5 depicts the log monitoring architecture.The system is separated into three layers: the underlying data source, data collection layer, and core processing layer.
Three components make up the core processing layer.Elasticsearch is used to store and retrieve log file data indefinitely.Graylog’s configuration is stored in MongoDB, and Graylog primarily provides a web interface and an external interface [21].The data collection layer mostly completes the log data collection.Graylog gathers logs using a variety of methods.We now gather logs primarily using two methods.The first approach is to use Syslog to collect information about network devices.To transmit logs to Graylog, we use the system’s syslog module and the UDP protocol.Because all Linux ports below 1024 are privileged, it is necessary to use iptables to divert traffic from the custom port to port 514.The second method is to use the Graylog collector sidecar client program to acquire the necessary logs.Its backend can contact Filebeat or Nxlog, and these clients will automatically monitor the selected log directory or log file and track the reading of these files.Finally, the data are sent to Graylog for storage.The bottom layer contains certain log types that we currently collect, such as application logs, middleware logs,and EPICS PV alarm logs.
After collecting log messages from the client using Inputs, we utilize Extractor to extract the appropriate field information from them.Finally, we may perform statistical analyses on different logs.The EPICS PV alarm log is shown in Fig.6.The Graylog dashboard report can be used to determine whether there are issues with thousands of internet devices.Distinct alert conditions are created for different log streams.When Graylog generates an alarm,it sends the associated alarm information to the ACMS Alert Center.

Fig.5 Log file monitoring alarm graph

Fig.6 Graylog view alarm log historical data
3.3 EPICS control system real-time monitoring
We created the IMPCAS Netanalyzer program to continuously monitor the accelerator control network [22].It provides an in-depth analysis of the accelerator control protocols, particularly the Channel Access (CA) and PV Access(PVA) protocols.The PV search frequency and IOC status could be statistically analyzed.The output log is sent to Graylog through Nxlog for real-time viewing, which is important for monitoring the status of the EPICS network.Therefore, the ACMS, like the Phoebus Alarm system, primarily monitors and alarms changes in PV values in realtime.We initially created the EPICS Pulsar connector, as shown in Fig.7a, in order to write a PV value into Pulsar in real-time.The application was developed using JCA 2.4.3.First, we create the EPICS PV POJO class.This class’s primary properties are pvname, value, and pvtime.The connector will first read the configuration files pvproduce.properties and pulsarconfig.properties.The IP addresses of the IOC and gateway, as well as the names of all PVs to monitor,are included in the pvproduce file.The serviceurl and topic name may be found in pulsarconfig.The connector will attach a MonitorListener to each PV in order to monitor the DBR value in real-time.Finally, it is serialized with pvname and pvtime and sent to the topic specified by the Pulsar cluster.For example, the message with the topic “persistent://HIRFL-CS/hirflgatewayioc/hirflcs”looks like this:

Fig.7 a EPICS to Pulsar.b Flowchart of Flink streaming processing
{“pvname”:”gateway:load”,”value”:0.38,”pvT ime”:1666773224892}.
The real-time alarm system for EPICS PVs has a multilayered design.The Flink service, function, and data stream are the three layers from bottom to top.The business process is represented by the service layer, which is in charge of providing alarm data to Alertmanager.Alarm rule synchronization, updating, and matching are also accomplished here.Serializable items are converted into streams by the data stream layer.Each functional module of the system is realized in the function layer.Figure 7b depicts the full business process.The Driver is in charge of the complete Flink’s job launch.The initial step after startup is to load the MySQL,Pulsar, and Flink configuration files.The configuration in MySQL is processed into a rule stream in the second stage using the CDC data source module.The Pulsar topic will be processed into a data stream in the third stage.It is necessary to broadcast to all parallel subtasks because the rules change in real-time and are globally valid for the whole application.A map structure is used to hold the underlying broadcast state.In the fourth stage, we link the Pulsar data stream to the MySQL broadcast stream, resulting in a broadcast connected stream.To acquire alert rules and data, a broadcast process function is created based on this connected stream.Concurrently, the alarm rule matching processing is carried out here.After filtering the data, we are able to obtain a Pulsar alert stream, which contains real-time alarm information.This is sent to Alertmanager for further processing.
3.3.1 Alarm rule matching
The key element of the EPICS PV real-time alarm system is the matching of alarm rules.AviatorScript is used in the ACMS to match alarm rules.AviatorScript is a lightweight, high-performance expression evaluation engine written in Java.Figure 8 depicts the whole rule matching flow.To begin, the pulsar-flink connector is used to read data from the Pulsar and deserialize it into a JSON String.Then, using JSON-flattener, the nested JSON String is turned into a Java Map.Simultaneously, the rule expression is derived from MySQL’s effective rules, and the matching procedure between the two is completed by the Aviator expression engine.As an example, the rule pvname = = ‘HIRFL:channel1’indicates that the value of the pvname attribute is identical to HIRFL:channel1, and value > 100 indicates that the value attribute is larger than 100.The rule matching succeeds only when the Aviator evaluator instance validates that both the pvname and value are true.At this point, the alarm process is initiated, a Pulsar alert message is created to form the Alertmanager message structure, and it is transmitted to Alertmanager for alerting.

Fig.8 Alarm rule matching flowchart
3.3.2 Alarm module design
We created the ACMS Alert Center.As seen in Fig.9,its primary role is to forward received alarm messages to Tencent Phone, Yimei SMS, email, DingTalk, Enterprise WeChat, and other platforms.Alert Center is built using the Beego framework and employs the MVC design pattern.Beego is an http framework for developing Go apps quickly utilizing native http requests.Goroutine’s concurrent effi-ciency can facilitate high-traffic web application access.The app.conf file in the current directory will be parsed when the system boots.We initialized several default options in this file, such as the Alert Center listening port, MySQL connection string, and DingTalk and WeChat connection URLs.All of the http requests received enter the framework from the main function, and are parsed by the URL route to determine which controller to execute.For route parsing,we employ all-matching routes.As an example, Prometheus uses the “/prometheus/alert”route.Figure 10 depicts the Alertmanager’s alert information.Because Flink and Prometheus must first send the alert information to Alertmanager, their routes are the same.For Grafana and Graylog, we define different message structures and routes to push alarm messages.Alarm Center is very extendable, and it can process all the alert messages delivered by systems that utilize the WebHook interface.In order to prevent alarm flooding and realize intelligent alarms, the Grouping, Silence, and Inhibition functions of Alert Center are currently implemented through Alertmanager.Grouping separates alarmswith similar natures into a single notification.For example,hundreds of alerts may be sent to Alertmanager because of network failures.To determine which service instances are affected, we may set Alertmanager to combine alerts by cluster or alert name and provide a single compact notice.Silence is a straightforward mechanism that mutes reminders at particular times.If there is a match, no notice will be generated for this alert, similar to the Annunciator in Phoebus Alarm.Inhibition means that when an alarm is issued, it is not repeatedly sent, which could cause other errors.

Fig.9 (Color online) Flowchart.Of the alarm module
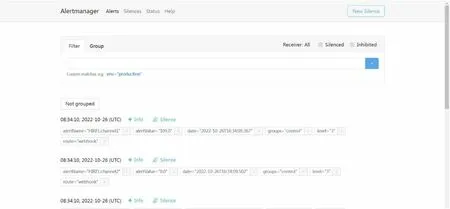
Fig.10 Alert information received by Alertmanager
Phoebus Alarm classifies alarm severity into five degrees based on the alarm type and severity of the PV.This design method is used by Alert Center in the alarm push procedure.We divided the alert degree into five levels, as indicated in Table 1.Different alarm levels in Alert Center will transmit signals to different alarm channels.When the alert level is 3,for example, the system cannot recover by itself and requires human intervention.The appropriate individuals are notified using SMS, WeChat, and DingTalk.Figure 11 shows the user’s alert SMS and WeChat messages.We formatted the alarm content in a targeted manner because the content provided by standard SMS is restricted.Alert Center will put each piece of information into the alert log file and MySQL database after finishing the push of alarm messages, which is useful for alarm statistics and historical data review.
3.3.3 Alarm data management
The ACMS data management system was created to allow for remote control of alarm rules and historical data for each system.The software was developed based on the idea of separating the front and back ends in order to realize system adaptability and scalability.The MVC pattern is used at the architectural level.To provide users with a seamless experience, the front end relies heavily on the standard development modes of Beetl, Bootstrap, and AdminLTE.Based on standard technologies such as Spring Boot, Shiro,and MyBatis, the back end is primarily responsible for dataprocessing and transmission.The data management system has complete authority.Access to various types of data can be granted based on users and roles.MySQL is the database linked in the background, and it allows access to numerous data sources.The alarm rule management interface is depicted in Fig.12.The system provides functions such as adding, deleting, modifying, and querying alarm rules.The three fields of name, exph, and expl are used for matching alarm rules and must be filled in precisely.Because it is dependent on Aviator, the precedence of operators is the same as that in JAVA.The is_valid field indicates whether the alarm rule is valid or not, and its value is only 0 or 1.When the accelerator is in the shutdown or maintenance state, for example, the user must set its value to 0.As a result, the alert will not be triggered in Flink’s rule stream.When sending alerts to Alertmanager, the fields alertname,level, and group are utilized to construct the label structure,and annotations are built using the fields summary, description, mobile, and email.The comma-separated variables mobile and email describe the recipients who will receive this alert message.Groups are used to determine the system that contains the alert rule, which is important for auditing alerts.

Table1 Alarm levels in Alert Center
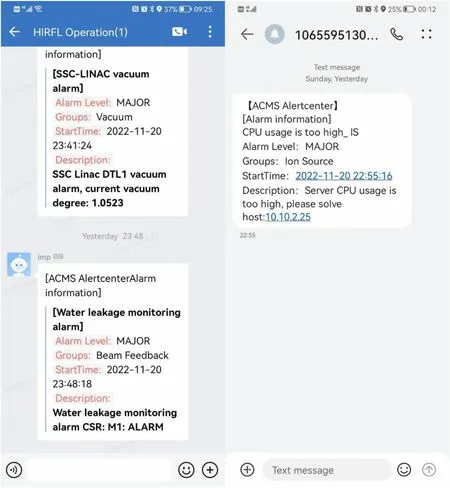
Fig.11 Examples of WeChat and SMS alert messages
4 ACMS versusPhoebus alarm
Functionally, the ACMS is more effective than Phoebus Alarm at monitoring different logs and infrastructure indications.It has real-time monitoring and analysis capabilities that Phoebus Alarm does not have for the EPICS control network.In addition, users may change the alarm rules whenever they want in accordance with their own demands without having to restart the main program, making up for the latter’s limitation of a single alarm channel.For EPICS PV real-time monitoring, the primary distinction between the ACMS and Phoebus Alarm is the messaging system.The ACMS uses Pulsar, while Phoebus Alarm uses Kafka.To completely isolate subsystem PVs, the ACMS may employ Pulsar’s inbuilt multi-tenancy feature, in contrast to Phoebus Alarm, which publishes all data into a fixed topic.We utilized the OpenMessaging benchmark to assess the throughput values of the ACMS and Phoebus Alarm to ensure fairness [23].It is a package of tools within the Linux Foundation that makes benchmarking distributed messaging systems simple.To build message clusters for Pulsar and Kafka, we employed three virtual machines.The Client was in charge of assigning jobs, setting the benchmark subject,producing customers and producers, and so on.It utilized actual machinery.The entire hardware and software setup is shown in Table 2.

Fig.12 Alarm rule data configuration management interface
Durability refers to the ability to maintain system consistency and availability in the face of external problems such as hardware or operating system failures.Pulsar has four levels of durability, whereas Kafka offers three levels of durability: 1, 2, and 4.We needed both Pulsar and Kafka to guarantee level 1 synchronous durability in order to precisely record the values of all PVs in sequence without data loss.Figure 13 depicts the outcomes of the tests.The red line in the illustration reflects the publication throughput of the ACMS’Pulsar.The figure is the average of three tests.It can be noted that the ACMS’Pulsar had a publication throughput of approximately 600,000.This implied that we could publish 600,000 pieces of PV data per second, which was approximately 2.8 times higher and clearly superior to that of Phoebus Alarm’s Kafka.
5 Conclusions andfuture work
The HIAF is a next-generation high-current heavy-ion accelerator facility built by IMPCAS.Its control system includes thousands of control components along with infrastructure.These must be available 24 h a day and 7 days a week.As a consequently, its maintenance includes many challenges.Large data volumes, interrelated control components, and thousands of operational tasks are all difficulties to overcome.A real-time monitoring system that meets the operating and maintenance requirements of large accelerators has become an essential core component in their regular functioning.There is no single monitoring solution on the market that can meet all of our requirements.We built the ACMS by integrating a small amount of open-source software and distributed stream processing engine.

Table 2 Detailed configuration of software and hardware

Fig.13 ACMS’pulsar and Phoebus alarm’s Kafka throughput comparison chart
The ACMS has a modular architecture with great scalability and may be dynamically expanded to meet a variety of business monitoring requirements.It can collect data from a wide range of sources and has advanced data processing and analysis capabilities.It is extremely versatile because the fundamental components may be deployed in clusters.At the same time, it is very adaptable, with users able to select multiple display ways for each monitored piece of data.It supports a wide range of alert delivery mechanisms,including SMS, email, and WeChat.When used in different scenarios, users may choose from a selection of alert systems.Currently, the system is being utilized in HIRFL and SESRI projects.It is primarily used to monitor the EPICS and accelerator infrastructure at SESRI.The system recognizes the precise location and alert of a defect during the accelerator’s diagnostics.A total of 38,202 alerts have been sent since it was installed and used on HIRFL in December 2019.It has been proven to be reliable and is well appreciated by users after constant updates and enhancements.Based on the existing accelerator alarm data of the ACMS,we will provide future assistance for accelerator operation and maintenance in terms of data preprocessing, fault localization, and anomaly identification.This will save troubleshooting time and allow AIOps for the accelerator control system in the medium and long terms.
Author contributionsAll authors contributed to the study conception and design.Interface design was performed by Tao Ma and Peng-Peng Wang; Algorithm implementation and experimental analysis were performed by Chao Yuan and Tao Ma; Investigation and project administration were performed by Wei Zhang.The first draft of the manuscript was written by Chao Yuan and Min Yue.And all authors commented on previous versions of the manuscript.All authors read and approved the final manuscript.
Data availabilityThe data that support the findings of this study are openly available in Science Data Bank at https:// doi.org/ 10.57760/ scien cedb.j00186.00059 and https:// cstr.cn/ 31253.11.scien cedb.j00186.00059.
Declarations
Ethical approvalThe ACMS was designed for large accelerator device such as High Intensity Heavy-ion Accelerator Facility (HIAF).To verify our design, we deployed and tested all functions on existing accelerators, Heavy Ion Research Facility in Lanzhou (HIRFL) accelerator and Space Environment Simulation and Research Infrastructure(SESRI) accelerator.
杂志排行

Nuclear Science and Techniques的其它文章
- Hformer: highly efficient vision transformer for low-dose CT denoising
- Effect of radiolysis of TODGA on the extraction of TODGA/n-dodecane toward Eu(III): an experimental and DFT study
- Dose reconstruction with Compton camera during proton therapy via subset-driven origin ensemble and double evolutionary algorithm
- Longitudinal impedance measurements and simulations of a three-metal-strip kicker
- A refined Monte Carlo code for low-energy electron emission from gold material irradiated with sub-keV electrons
- Systematic study on the proton radioactivity of spherical proton emitters