Responses of Carbon Sink of Ecosystem Vegetation to Land Use Changes in Kunming City
2023-06-28BozhouGONGHaiyingPENGXinyouLIU
Bozhou GONG, Haiying PENG*, Xinyou LIU
1. Research Institute of Land Resource and Sustainable Development, Yunnan University of Finance and Economics, Kunming 650221, China; 2. Central Yunnan Water Diversion Project Construction Administration Bureau of Yunnan Province, Kunming 650221, China
Abstract [Objectives] To analyze the relationship between the land use pattern and the carbon sequestration level of the ecosystem vegetation in Kunming City, and to provide a certain reference for optimizing the land ecological use pattern and scientific carbon reduction and sequestration. [Methods] Based on remote sensing data, meteorological data, vegetation data and soil data, the Carnegie-Ames-Stanford Approach (CASA) was adopted to estimate the vegetation net primary productivity (NPP) in Kunming during 2005-2020, and then the vegetation carbon sink was calculated through the plant mortality model. Besides, it established the land use transfer matrix of Kunming City, and analyzed the change characteristics of the carbon sink of ecosystem vegetation in Kunming City under the influence of land use changes. [Results] During 2005-2020, the water area, construction land and unused land area in Kunming increased by 43.52, 710.51 and 2.8 km2, respectively; farmland, woodland and grassland decreased by 269.72, 140.20 and 347.03 km2, respectively; farmland, woodland, grassland, water area, construction land and unused land caused a total of 58 212.72 t of vegetation net carbon sink loss in land conversion, accounting for 14.88%, 25.23%, 11.95%, 10.58%, 37.09%, and 0.26%, respectively.[Conclusions] This study is expected to help to improve the ecological carbon sequestration capacity of Kunming and promote the sustainable development of land resources.
Key words Land use, Net primary productivity (NPP), Carbon sink, Carbon gain and loss
1 Introduction
Many foreign scholars have studied the impacts of land use changes on carbon cycle and carbon sequestration from different regions and historical periods. For example, Glassetal.[1]measured the changes in grassland soil carbon, nitrogen and nutrients caused by land use in seven different periods through the study of grassland land use changes in pastoral areas. Larba analyzed the impacts of land use on plant biodiversity, stand structure and carbon storage in the Savannah region of West Africa[2]. Taking Madeira Island in Portugal as an example, based on multispectral satellite data, Massetti analyzed the changes in vegetation carbon storage caused by land use/cover changes in the area from 2009 to 2011, and plotted, assessed and monitored the carbon of the aboveground biomass in the region. Taking the southern subtropical region of Queensland, Australia as an example, Ranjanetal.[4]explored the changes in soil organic carbon under different temperatures and land use patterns. Domestic scholars studied the factors affecting forest carbon sink. For example, Chen Guangshengetal.[5]simulated the impacts of land use/cover change on the ecosystem carbon cycle through the coupling of ecosystem process models. Using the land use data based on remote sensing observations and ecosystem process model driven by climate data at high spatio-temporal resolution, Gao Zhiqiangetal.[6]estimated the effects of land use and climate change on vegetation carbon storage, soil respiration and carbon storage in agro-pastoral transitional regions. Yang Yushengetal.[7]studied the impacts of different land use types in subtropical mountainous areas on the storage and quality of soil organic carbon in natural forests, artificial forests, secondary forests, orchards and slope farmlands.
At present, in the research process of vegetation carbon sequestration, there are many studies on ecosystem carbon sequestration based on single objects such as forest, grassland, and soil. Most of them focus on observation and modeling at ground points. However, there are few related studies on complex terrestrial ecosystems composed of multiple objects. Revealing the current situation and development trend of ecosystem vegetation carbon sinks in Kunming in the rapid urbanization process and land type change can provide a scientific data basis for the effective management and utilization of land in different ecosystems and the enhancement of carbon sequestration capacity in the future, and also provide a scientific basis for Kunming to reduce carbon sequestration risks, improve ecological benefits, and achieve sustainable development.
On the basis of calculating the carbon sinks of ecosystem vegetation in Kunming during 2005-2020, we established the land use transfer matrix of Kunming and analyzed the characteristics of carbon sink changes in farmland, woodland, grassland, water area, construction land and unused land during the period, to provide a theoretical basis for Kunming to improve the carbon sink capacity of ecosystem vegetation.
2 Materials and methods
2.1 Overview of the study areaKunming (102°10′-103°40′ E, 24°23′-26°22′ N), located in Southwest China, in the middle of the Yunnan-Guizhou Plateau, covers a total area of 22 074.09 km2. The overall terrain is high in the north and low in the south, gradually decreasing in steps from north to south, uplifted in the middle, and low on the east and west sides. The highest altitude is 4 247.7 m, and the lowest altitude is 746 m. The annual average temperature is 15 ℃, the average annual precipitation is 1 035 mm, and the annual average sunshine is 2 200 h. The city’s natural terrestrial ecosystem vegetation is relatively rich, with 9 vegetation types, 20 vegetation subtypes, 56 formations, and 118 clusters, separately accounting for 75% of the vegetation types in Yunnan, 59% of the vegetation subtypes in Yunnan, 33% of the formations in Yunnan, and 56% of the formations in Yunnan. There are mainly subtropical evergreen broad-leaved forests, coniferous and broad-leaved mixed forests, temperate coniferous forests, alpine shrubs and other zonal vegetation in the territory of Kunming City.
2.2 Data sourceThe data of land cover change in Kunming came from the 30 m high-precision land use status and land use type remote sensing monitoring data in China (http:∥www.resdc.cn). We selected two phases of data in 2005 and 2020, and divided the data into 6 categories, namely farmland (paddy field and dry land), woodland (woodland, shrubs sparse woodland, other woodland), grassland (high coverage grassland, medium coverage grassland, and low coverage grassland), water area (river canals, lakes, reservoirs, pits, and beaches), construction land (urban land, rural residential areas, other construction land) and unused land (swamp and bare rock texture land). Meteorological data such as daily rainfall, daily average temperature, and daily solar radiation were searched from the China Meteorological Data Sharing Service System (http:∥data.cma.cn); the soil data were searched from the Qinghai-Tibet Plateau Data Center (http:∥westdc.westgis.ac.cn); the normalized difference vegetation index (NDVI) data were retrieved from the 2005 and 2020 MODIS13Q1 images of the study area, obtained from the website of NASA, with spatial resolution of 250 m, the temporal resolution of 16 d, and 23 periods and 46 scenes per year.
2.3 Research method
2.3.1Calculation method of vegetation net productivity. In this study, we used the Carnegie-Ames-Stanford Approach (CASA) to estimate the net primary productivity (NPP) on the basis of surface vegetation, solar radiation, temperature, hydrology, NDVI and other data. NPP is the product obtained by multiplying the observed absorbed photosynthetic active radiation (APAR) of the vegetation and the light energy use efficiency (ε) of the vegetation type[8]. The calculation formula is as follows:
NPP(x,t)=APAR(x,t)×ε(x,t)
(1)
APAR(x,t)=SOL(x,t)×FPAR(x,t)×0.5
(2)
ε(x,t)=Tε1(x,t)×Tε2(x,t)×Wε(x,t)×εmax
(3)
whereNPP(x,t) represents the cumulativeNPP(gC/m2/t) of the vegetation in the pixelxwithin the time periodt;APAR(x,t) denotes the photosynthetic active radiation (MJ/m2/t) absorbed by the vegetation in the pixelxwithin the periodt;ε(x,t) represents the actual light energy utilization rate (gC/MJ) of the vegetation in the pixelxin the time periodt;SOL(x,t) is the total solar radiation (MJ/m2/t) received by pixelxin the time periodt;FPAR(x,t) is the fraction of photosynthetically active radiation absorbed by vegetation in the pixelxin the time periodt; 0.5 is the proportion of total solar radiation used for photosynthesis;Tε1(x,t) refers to the stress coefficient of the highest temperature onε;Tε2(x,t) refers to the stress coefficient of the lowest temperature onε;Wε(x,t) is the water stress coefficient;εmaxis the maximum light energy utilization rate (gC/MJ) under ideal conditions.
2.3.2Estimation method of vegetation carbon sink. Based on the NPP, we used the amount of carbon transformed by the proportion of carbon in plant dry matter to estimate the vegetation carbon sink (plant mortality model) and calculated the spatiotemporal changes of ecosystem vegetation carbon sink in Kunming during 2005-2020. In this paper, the vegetation carbon sink can be expressed as the product of aboveground biomass density, area and its conversion coefficient[9], and the calculation formula is shown in formula (4):
CTi=MDi×Li×α
(4)
whereidenotes the cover type,CTiis the carbon sink value of aboveground vegetation of theithcover type,MDiis the aboveground biomass density of theithcover type,Liis the area of theithcover type, andαis the conversion coefficient of biomass to carbon, andαis 0.5 in this study.
In this study, we used the plant mortality model established by Zhang Jiahua was to calculate the biomass density[10]. The formula is shown in formula (5):
MDi=0.565×NPP
(5)
2.3.3Land use transfer matrix. The land use transfer matrix can comprehensively and accurately display the transfer of land use types in and out of a certain area during the migration process in a certain period, and it can be calculated using formula (6):
(6)
whereSrefers to the area of land use type;iis the beginning of the study period;jis the end of the study period;nis the number of land use types in the study area.
3 Results and analysis
3.1 Analysis of changes in NPP and carbon sinks in KunmingThrough CASA model estimation, we obtained the average mean of plant NPP in each district and county of Kunming from during 2005-2020. Using the plant mortality model, we calculated the corresponding carbon sink. The specific statistical values are listed in Table 1.
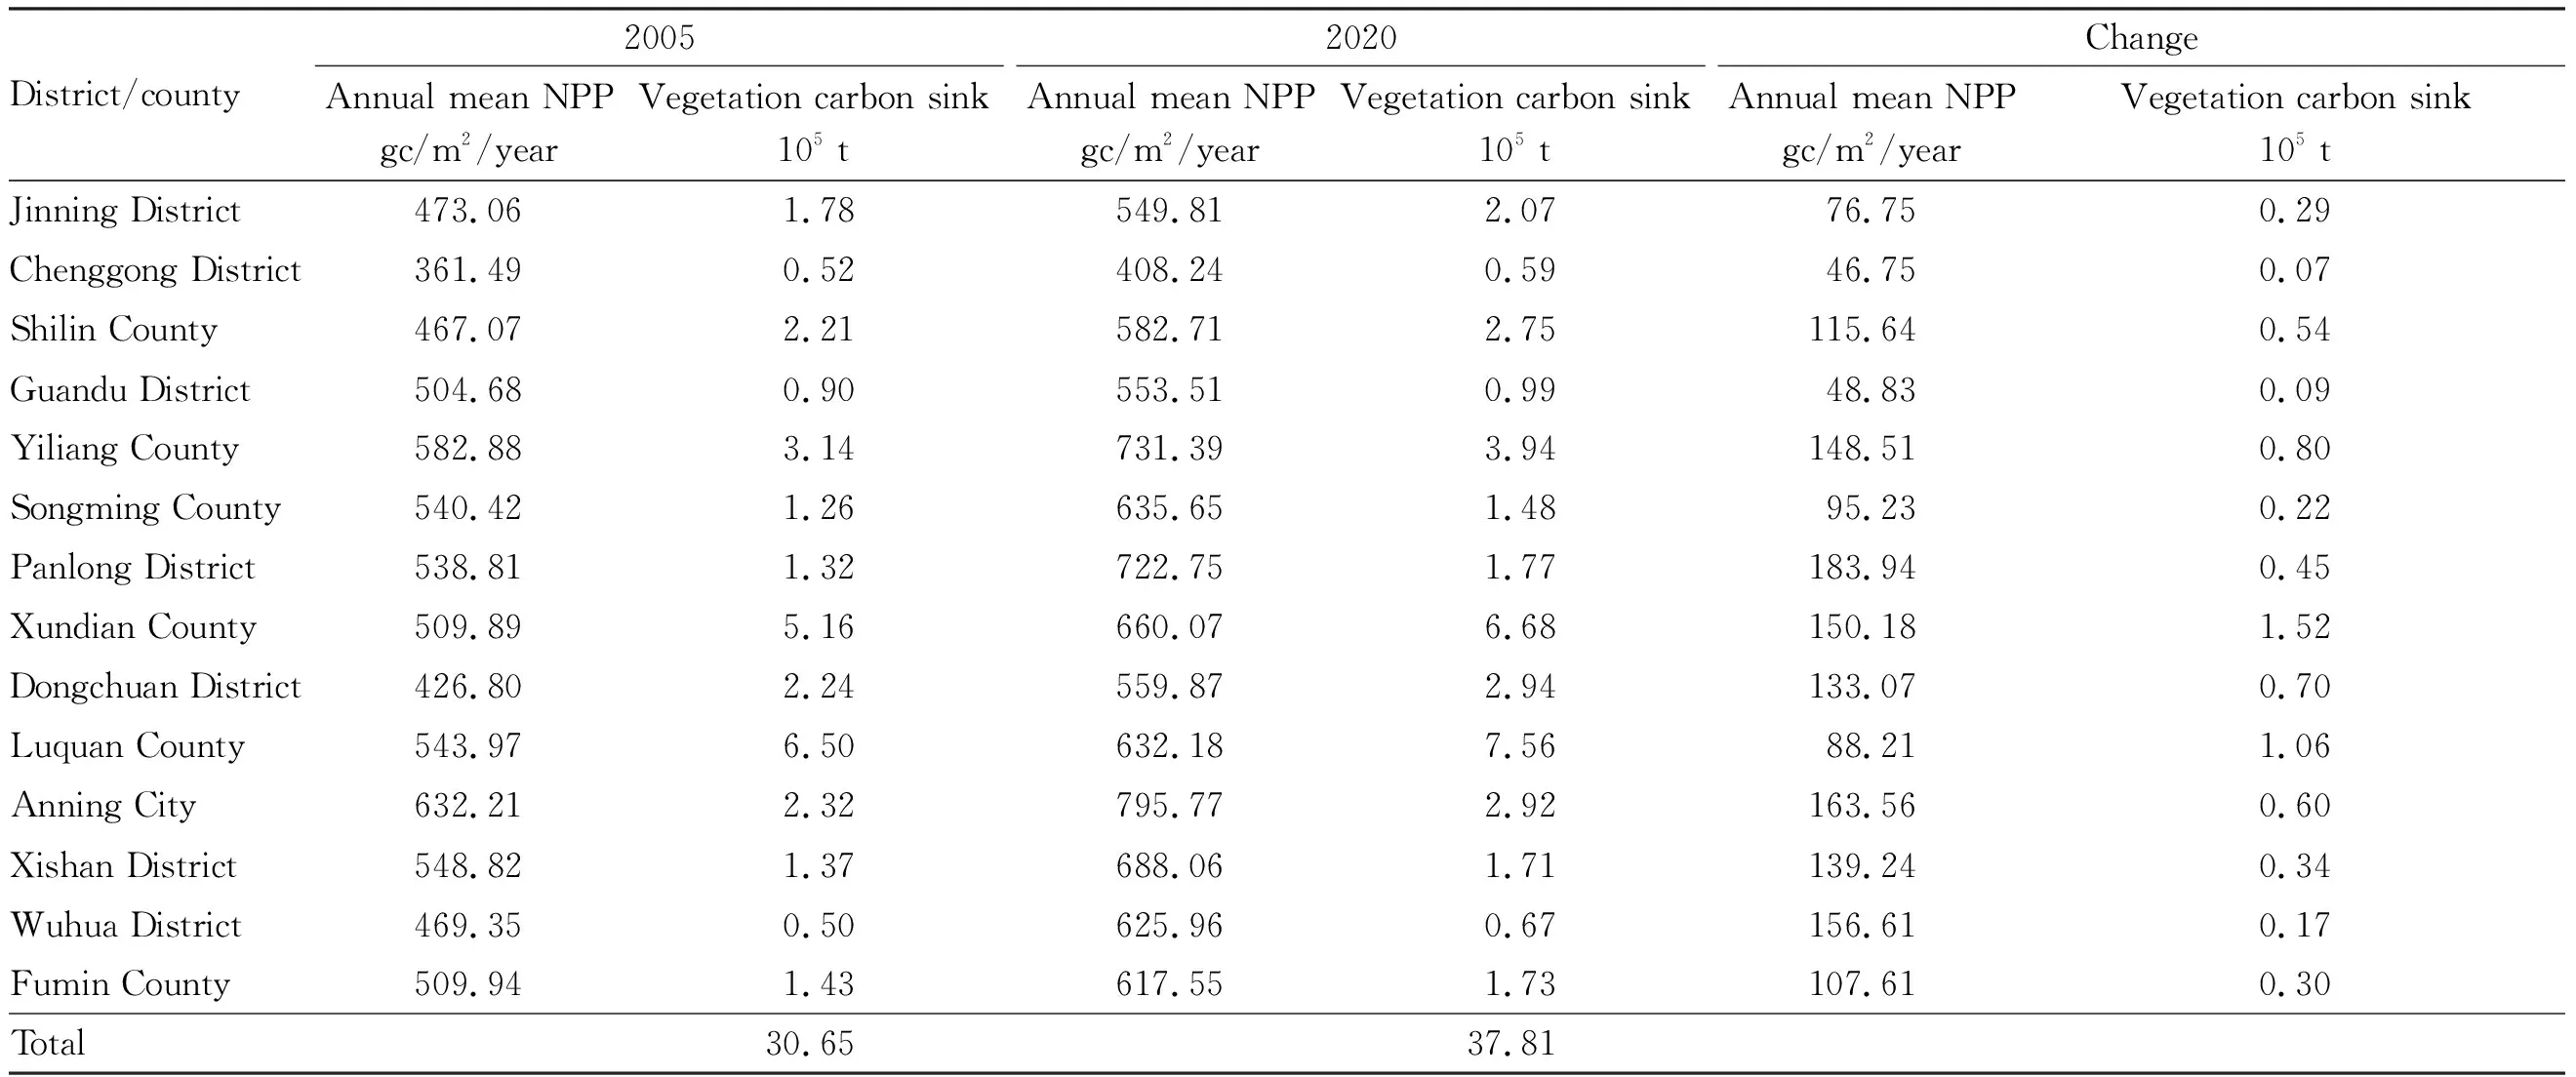
Table 1 Annual mean value of NPP and vegetation carbon sink in each district and county of Kunming during 2005-2020
The average annual NPP and vegetation carbon sinks in Kunming City during 2005-2020 showed an overall increasing trend. The annual average NPP increased from 517.87 gc/m2/year in 2005 to 638.67 gc/m2/year in 2020. The vegetation carbon sink increased from 30.65×10⁵t to 37.81×10⁵t, with an average annual increase of 4.77×10⁴t. During 2005-2020, Panlong District had the highest average annual NPP increase, followed by Anning City, Wuhua District, Xundian County, Yiliang County, Xishan District, Dongchuan District, Shilin County, Fumin County, Songming County, Luquan County, Jinning District, Guandu District, and Chenggong District. In the same period, Xundian County had the highest increase in vegetation carbon sinks, followed by Luquan County, Yiliang County, Dongchuan District, Anning City, Shilin County, Panlong District, Xishan District, Fumin County, Jinning District, Songming County, Wuhua District, Guandu District, and Chenggong District.
3.2 Analysis of land use changes in KunmingThe spatial-temporal characteristics of area changes and land use conversion of different land use types in Kunming during 2005-2020 are shown in Tables 2-4.
Table 2 lists the area of various land use types in Kunming in 2005 and 2020. As shown in Table 2, the woodland was the most important land cover type in Kunming, and its area accounted for more than 45% of the land area of the study area. Compared with the year 2005, the area of water area, construction land and unused land showed an increasing trend, increasing by 43.52 km2(8.73%), 710.51 km2(130.57%) and 2.8 km2(3.94%), respectively; land types with reduced area include farmland, woodland and grassland, decreasing by 269.72 km2(-6.07%), 140.20 km2(-1.39%), and 347.03 km2(-5.39%), respectively.

Table 2 Area of land use types in Kunming in 2005 and 2020 km2
According to Table 3, the total area of land use conversion in Kunming during 2005-2020 was 2811.6 km2, accounting for 12.74% of the total land use area of the study area. Specifically, grassland had the largest amount of transfer, with a total transfer of 1010.83 km2, accounting for 35.95% of the transfer-out area of land use. The land was mainly transferred to woodland, farmland and construction land, accounting for 97.04% of the transfer-out area of grassland. About 664.14 km2of other land types were transferred to grassland, accounting for 23.62% of the transfer-in area of land use. The main sources of transfer were woodland and farmland, separately accounting for 66.67% and 29.92% of the transfer-in area of grassland. The transfer-out area of farmland was 833.23 km2, accounting for 29.64% of the transfer-out area, mainly from construction land and woodland, and the transfer-in area was 563.52 km2, accounting for 20.04% of the land transfer-in area, mainly from woodland and grassland, and the transfer-out area of woodland was 842.55 km2, accounting for 29.97% of the transfer-out area of land use, and the transfer-in area was 702.47 km2, accounting for 24.98% of the transfer-in area, and the main transfer-out objects and transfer-in sources were both farmland and grassland. The transfer-out area of construction land was 63.61 km2, accounting for 2.26% of the transfer-out area of land use; the transfer-in area was 774.09 km2, accounting for 27.53% of the transfer-in area of land use. The transfer-out area of construction land was relatively small, mainly from farmland and grassland. The transfer-out area of water and unused land was 54.73 and 6.65%, separately accounting for 1.95% and 0.24% of the transfer-out area of land use, and the transfer-in area was 97.72 and 9.46, separately accounting for 3.48% and 0.34% of the transfer-in area of land use.
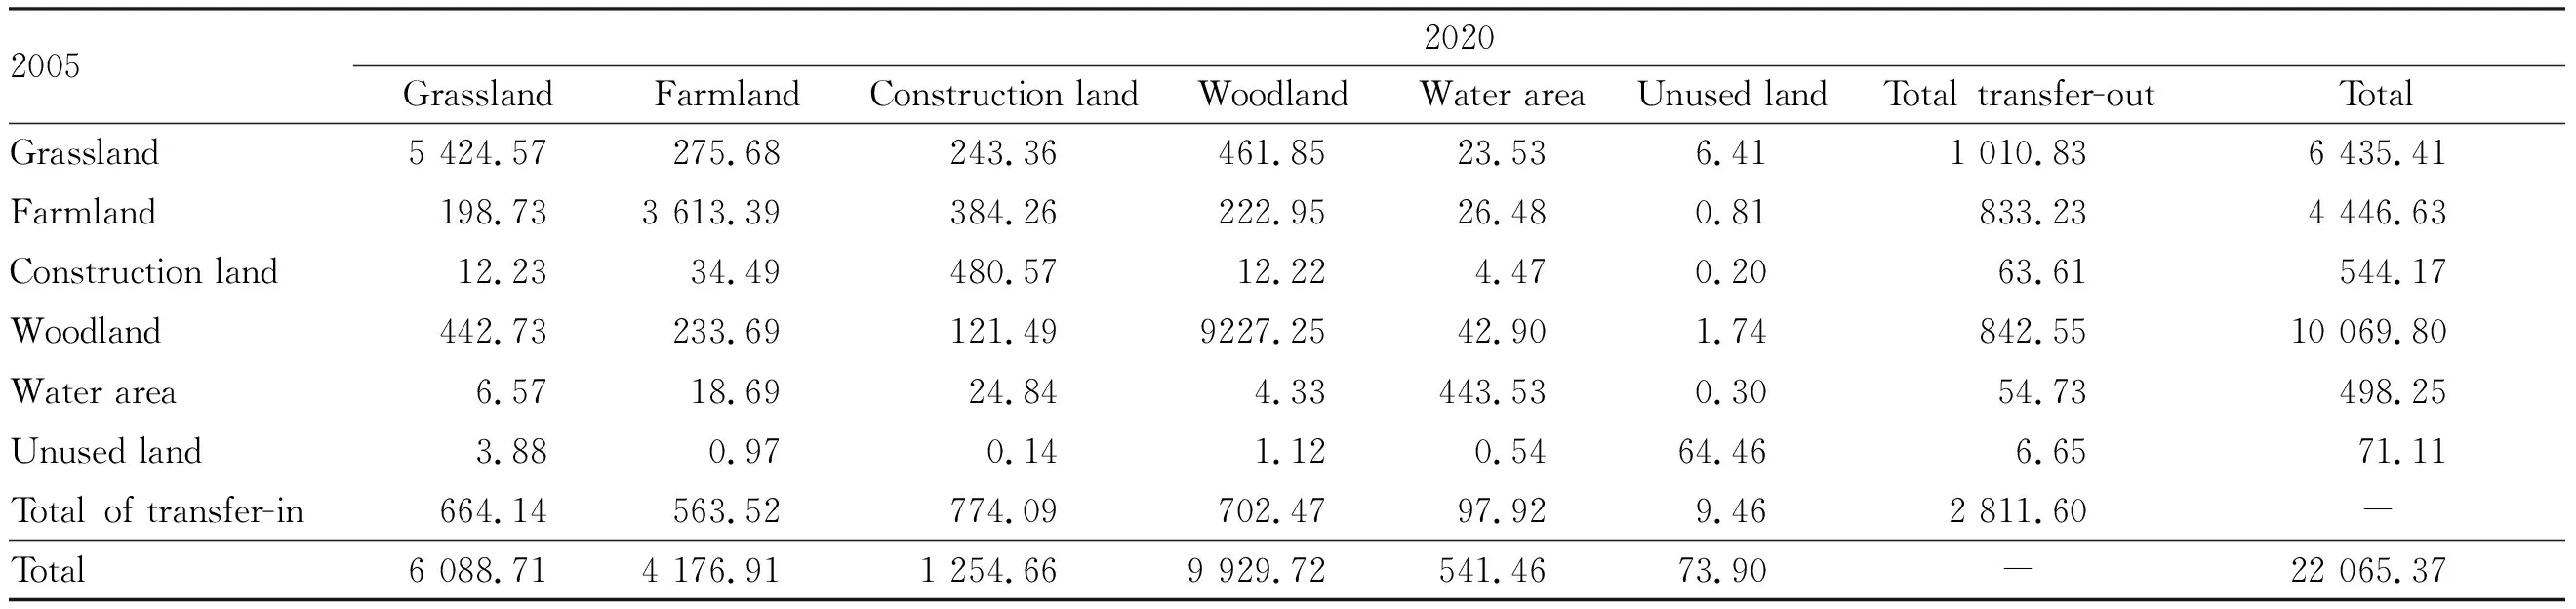
Table 3 Land use transfer matrix of Kunming during 2005-2020 km2
As indicated in Table 4, in terms of spatial distribution characteristics, the areas transferred from farmland were mainly concentrated in Xishan District, Guandu District, Jinning District and Chenggong District along the Dianchi Lake, as well as the junction of the northern part of Anning City and the southern part of Fuming County, while scattered in northern Fumin County, western Shilin County, central Songming County and Luquan County. The areas transferred to farmland were concentrated in the center of Shilin County and Songming County. The areas transferred from woodland were concentrated in the border area between Xundian County and Songming County, Anning City and the central Guandu District; the areas transferred to woodland were concentrated in the northern part of Chenggong District and the junction of the central part of Songming County and the southern part of Luquan County. The areas transferred from grassland were concentrated in Chenggong District, northern Guandu District and Luquan County, scattered in the east of Dongchuan District, most of Anning District, Wuhua District and central Shilin County; the areas transferred to grassland were concentrated in the southeast of Xundian County, northeast of Fumin County and southwest of Anning City. The areas transferred from water area were concentrated in the middle of Songming County, and mainly transferred to the west of Luquan County and the middle of Songming County. The areas transferred from construction land were relatively small, concentrated in the central part of Songming County, and mainly transferred to Wuhua District, Panlong District, Xishan District, Guandu District, Chenggong District, Jinning District, most of Anning City and the eastern part of Songming County. The transfer of unused land was relatively small, and a small amount was concentrated in the central part of Songming County.

Table 4 Changes in the area of land use types in each district and county of Kunming during 2005-2020 ha
Generally, the land cover structure of Kunming has undergone major changes during 2005-2020, with the main features being the continuous reduction of grassland, woodland and farmland and the significant increase of construction land. The main reason is that the number of rural populations has decreased and the urban population has continued to increase, and the scale of urban traffic has continued to expand. As a result, a large number of farmland, woodland and grassland are occupied by construction land, which greatly increases the area of construction land and affects the changes in other land use types. Besides, policies such as returning farmland to forests, natural forest protection projects, wetland protection and development, and Dianchi Lake ecological protection in Kunming also have an impact on the conversion of land use types[11].
3.3 Analysis of response of vegetation carbon sink to land use change in KunmingUsing the spatial analysis function of Arcgis, we carried out overlay analysis and zoning statistics on the land use data and NPP data of Kunming City during 2005-2020. We made a comprehensive analysis of the dynamic changes in vegetation carbon sinks under different land use types and the net carbon gain and loss of vegetation caused by land conversion, as shown in Fig.1 and Table 5.
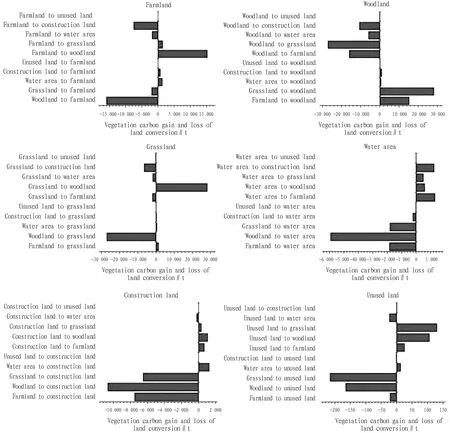
Fig.1 Vegetation carbon gain and loss of various types of land conversion in Kunming during 2005-2020

Table 5 Vegetation carbon sinks and net carbon gains and losses of various types of land conversion in Kunming during 2005-2020
Compared with the year 2005, the annual mean NPP of each land use type and vegetation carbon sink in Kunming in 2020 showed an increasing trend. The growth of annual mean NPP from high to low during 2005-2020 was woodland, grassland, unused land, farmland, water area and construction land, with an increase of 150.04, 135.3, 121.7, 79.86, 63.05 and 34.48 gc/m2/year, respectively; the growth of vegetation carbon sinks from high to low was woodland, grassland, construction land, farmland, water area and unused land, with an increase of 3.97×10⁵, 1.69×10⁵, 0.83×10⁵, 0.54×10⁵, 0.11×10⁵and 0.02×10⁵t, respectively.
During 2005-2020, various types of land use conversion in Kunming caused a loss of 8 212.72 t of vegetation net carbon sink. The vegetation net carbon sink loss caused by the conversion of construction land was the largest, 21 592.15 t, accounting for 37.09% of the total loss. The occupation of grassland, woodland and farmland by construction land separately caused 6 509.19 t, 10 670.38 and 7 509.25 t of vegetation carbon sink losses. Water area and unused land occupation of construction land separately caused 224.42 and 1.38 t of vegetation carbon sink losses, with a total loss of 24 914.63 t of vegetation carbon sinks. The water area and unused land occupied by construction land, and the transfer of construction land to woodland, grassland, farmland, and unused land obtained a total of 3 322.47 t vegetation carbon sink gain. The conversion of woodland and other land types caused a total loss of 14 688.99 t of vegetation net carbon sinks, other land types transferred to woodland obtained 45 068.84 t of vegetation carbon sink gain, while the transfer of woodland to other land types caused a loss of 59 757.83 t of vegetation carbon sinks. Among them, the conversion of woodland and grassland caused the largest gains and losses of vegetation carbon sinks. The conversion of grassland to woodland obtained 28 210.78 t of vegetation carbon sink gain and the transfer of woodland out of grassland resulted in 27 042.89 t of vegetation carbon loss. The conversion of farmland caused a total of 8 662.19 t net vegetation carbon loss, among which the occupation of farmland by construction land and the occupation of woodland by farmland caused the largest vegetation carbon loss, 7 509.25 and 15 958.04 t, respectively. The conversion of water areas caused a total of 6 160.17 t vegetation net carbon loss, among which the occupation of woodland caused the largest vegetation carbon loss, resulting in 5 921.70 t vegetation carbon loss. Grassland conversion caused a total of 6 958.82 t of vegetation net carbon loss, mainly due to construction land occupation of grassland and grassland occupation of woodland, resulting in 6 509.19 and 27 042.89 t of vegetation carbon loss, respectively. The impact of unused land conversion on vegetation carbon sink was very small, and the vegetation net carbon loss accounted for only 0.26% of the total vegetation net carbon loss. Although the conversion of various land types caused the loss of vegetation net carbon sinks, the transfer of farmland, grassland and construction land to woodland, farmland to grassland, and water area to farmland obtained a compensation of vegetation net carbon sink of 47 244.14 t.
As shown in Table 6, the land conversion in Fumin County achieved net carbon sink gains from vegetation, and the net carbon sink losses caused by land conversion in other districts and counties in descending order were Guandu District, Anning City, Yiliang County, Luquan County, Jinning District, Xundian County, Xishan District, Chenggong District, Shilin County, Panlong District, Dongchuan District, Songming County, and Wuhua District. The vegetation net carbon sink loss caused by farmland conversion was concentrated in Guandu District, Chenggong District, Jinning District and Anning City, and the vegetation net carbon sink gain was concentrated in Xundian County. The vegetation net carbon sink loss of woodland was concentrated in Guandu District, Anning City, Xundian County and Yiliang County, while the vegetation net carbon sink gain was concentrated in Chenggong District, Luquan County, and Fuming County. The vegetation net carbon sink loss of grassland was concentrated in Chenggong District, while the vegetation net carbon sink gain was concentrated in Fumin County and Yiliang County. The vegetation net carbon sink loss in the water area was concentrated in Luquan County and Yiliang County, while the vegetation net carbon sink gain was concentrated in Xishan District and Songming County. The vegetation net carbon sink loss of construction land was concentrated in Guandu District, Jinning District and Anning City. The vegetation net carbon sink loss of unused land was concentrated in Luquan County, while the vegetation net carbon sink gain was concentrated in Shilin County.
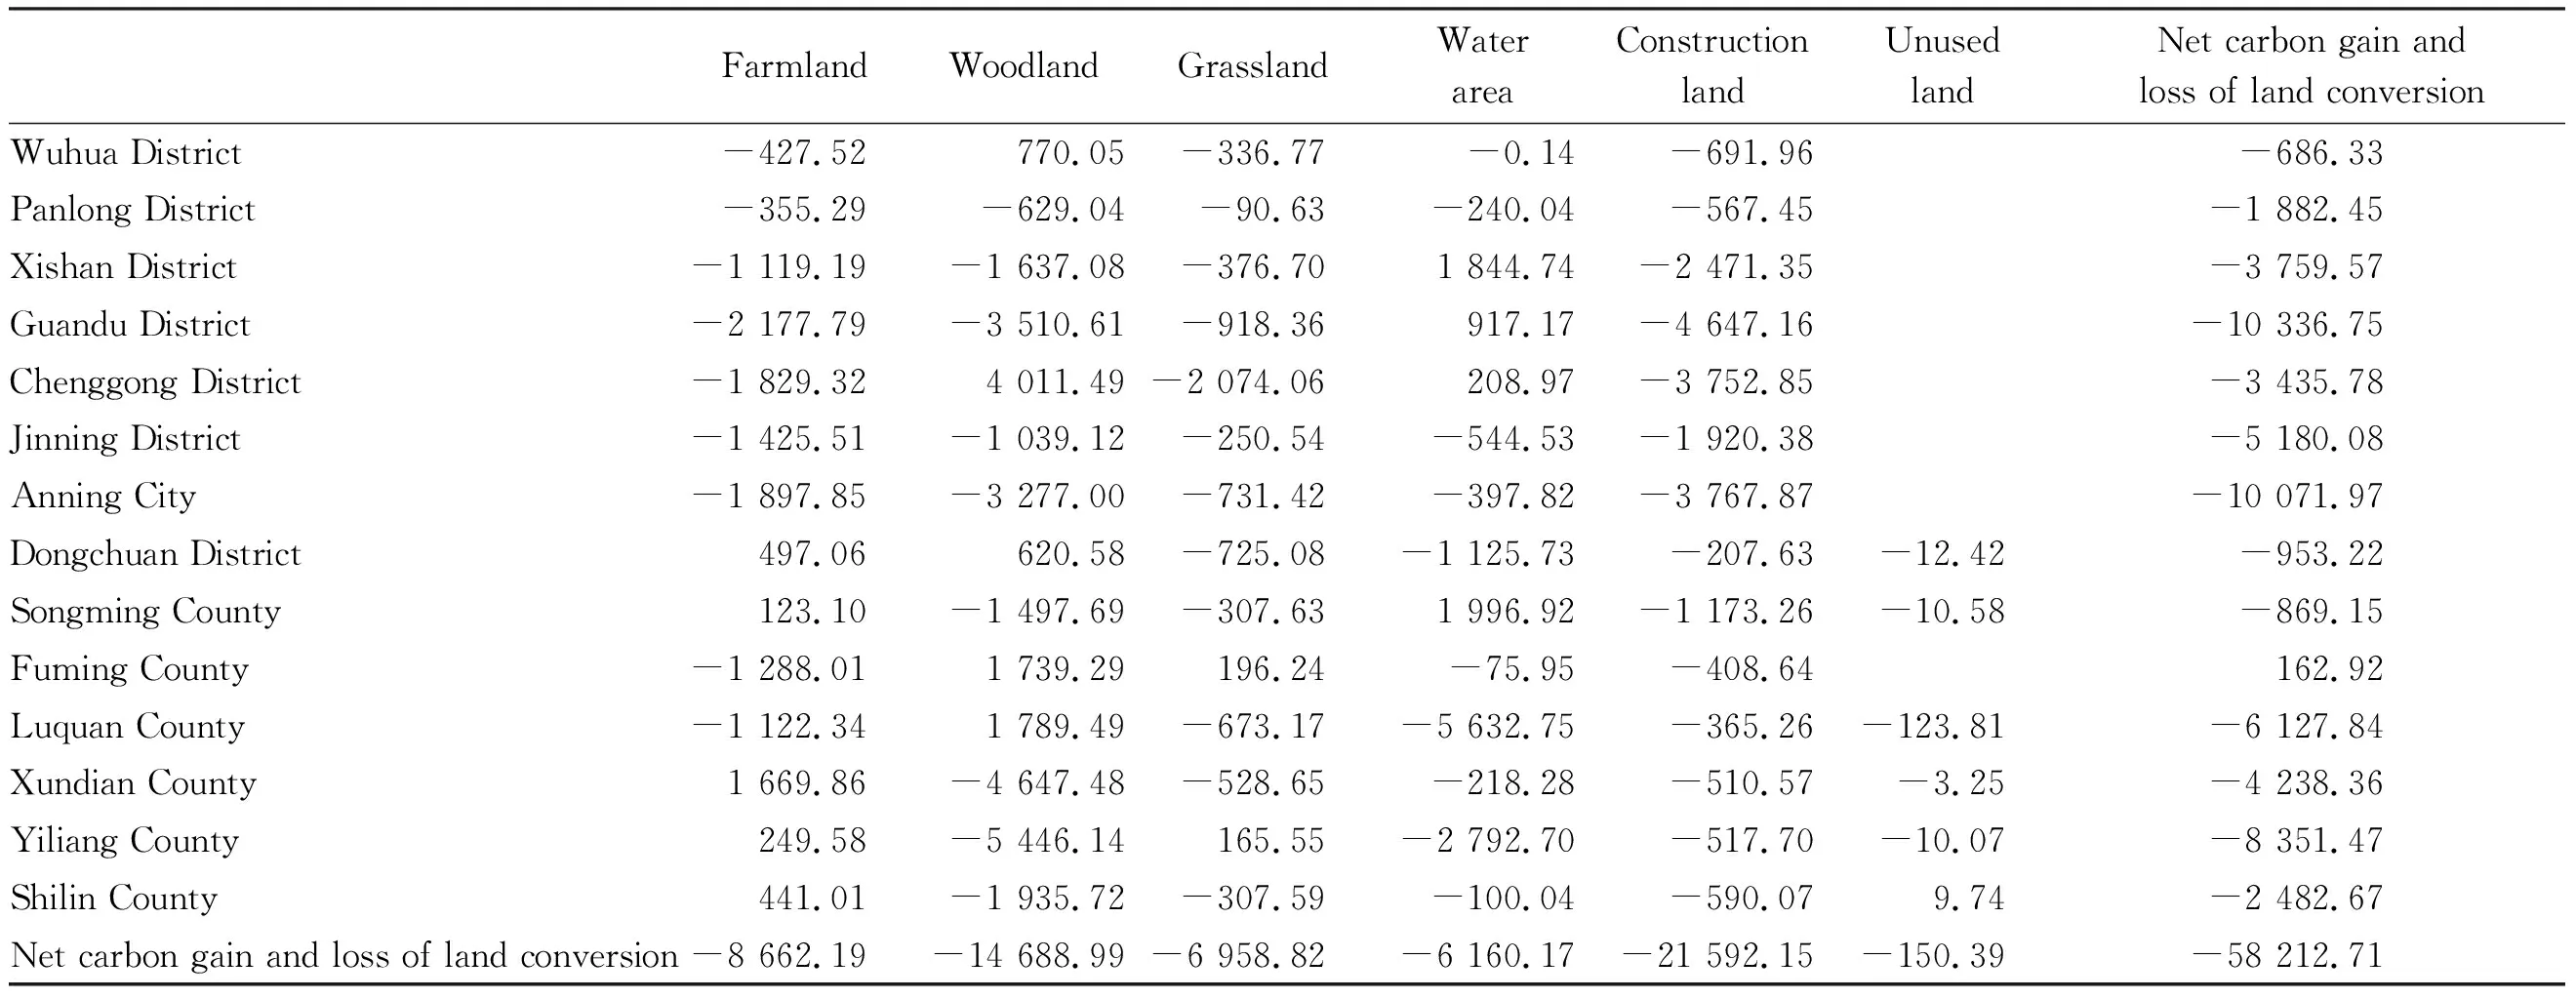
Table 6 Net carbon gains and losses from land conversion in districts and counties of Kunming during 2005-2020 t
4 Conclusions
Taking Kunming City of Yunnan Province as research object, using CASA model and Arcgis technology, based on the remote sensing data of 2005 and 2020, land use data, meteorological data, and soil data, we estimated the annual mean NPP and vegetation carbon sinks for each land use type in districts and counties of Kunming, analyzed the temporal and spatial differences and change characteristics of land use type changes and vegetation carbon sinks, and explored the gains and losses of vegetation carbon sinks during various types of land conversions.
In conclusion, the land use types in Kunming City experienced significant changes, and the area of construction land has increased significantly, with an increase of 710.51 km2. The area of farmland, woodland and grassland was separately decreased by 269.72, 140.20, and 347.03 km2. The vegetation carbon sink losses caused by farmland, woodland, grassland, water area, construction land and unused land in land conversion were 15 941.10, 59 757.83, 24 647.85, 9 827.14, 23 440.76 and 390.17 t, respectively. The vegetation carbon sink gains were 7 278.91, 45 068.84, 17 689.02, 3 666.97, 1 848.60, 239.78 t, resulting in a total of 58 212.72 t of vegetation net carbon sink losses. The acceleration of urbanization has led to a large amount of construction land occupying farmland, woodland and grassland, resulting in a large loss of vegetation carbon sinks. Therefore, in the future, it is recommended to actively implement relevant ecological protection policies such as returning farmland to forests and grasslands while rationally planning construction land, and make farmland, woodland and grassland get the corresponding vegetation carbon sink compensation, which will help to improve the ecological carbon sequestration capacity of Kunming and promote the sustainable development of land resources.
杂志排行
Asian Agricultural Research的其它文章
- Analysis on Value Rationality of Traditional Farm Tools in the Taomin Area
- Techniques and Precautions of Sod Culture in Citrus Orchards in Sichuan Province
- Research Progress in Biological Control of Soft Rot of Amorphophallus konjac
- Treatment of Heavy Metal Pollution in Sediment and Its Resource Utilization in Building Ceramics
- Silage Fermentation Technology and Its Effects on Growth Performance of Local Pigs
- Impacts and Demonstration Effects of Applying Long-acting Slow-release Fertilizer on Economic Yield of Peanut