A simulation method on target strength and circular SAS imaging of Xrudder UUV including multiple acoustic scattering
2023-05-31WenhuanWangBinWangJunFanFulinZhouKaiqiZhaoZhouJiang
Wenhuan Wang ,Bin Wang ,*,Jun Fan ,Fulin Zhou ,Kaiqi Zhao ,Zhou Jiang
a School of Naval Architecture, Ocean & Civil Engineering, Shanghai Jiao Tong University, Shanghai 200240, PR China
b Key Laboratory of Marine Intelligent Equipment and System of Ministry of Education, Shanghai Jiao Tong University, Shanghai 200240, PR China
c Shanghai Acoustics Laboratory, Chinese Academy of Sciences, Shanghai 200240, PR China
Keywords: Multiple acoustic scattering Target strength (TS)Circular synthetic aperture sonar (CSAS)X-rudder unmanned undersea vehicle(UUV)Iterative physical acoustics (IPA)
ABSTRACT Target strength (TS) and circular synthetic aperture sonar (CSAS) images provide essential information for active acoustic detection and recognition of non-cooperative unmanned undersea vehicles (UUVs),which pose a significant threat to underwater preset facilities.To access them,we propose an iterative physical acoustics(IPA)-based method to simulate the multiple acoustic scattered fields on rigid surfaces in high-frequency cases.It uses the Helmholtz integral equation with an appropriate Green's function in terms of the Neumann series,and then incorporates the ideas of triangulation and iteration into a numerical implementation.Then two approximate analytic formulae with precise physical meanings are derived to predict the TS and CSAS images of concave targets,respectively.There are no restrictions on the surface's curvature and the order of multiple scattering.The method is validated against the finite element method (FEM) for acoustic scattering from a sphere segment and against an experiment involving an X-rudder UUV's stern.On this basis,we simulate and analyze the TS and CSAS images of an X-rudder UUV.In addition,the influence of the angle of adjacent rudders on the multiple scattering characteristics is discussed.Results show that this method can potentially predict accurate UUV features,especially the multiple scattered features.
1.Introduction
Unmanned undersea vehicles (UUVs) are widely used in underwater intervention [1,2],naval mine detection [3],oceanographic surveys[4],and other fields.However,the non-cooperative UUV poses a significant threat to underwater preset facilities.An active sonar system is a powerful tool for detecting and recognizing the non-cooperative UUV at a long distance.Besides,UUV generally adopts an X-type rudder for high efficiency and maneuverability.Therefore,analyzing underwater acoustic scattering characteristics of a UUV,especially the multiple scattering from its X-type rudder,is of great significance for obtaining its complete and efficient features,which can be applied to active sonar detection[5],target identification [6]and acoustic stealth technology [7].Most published works on an X-type rudder are mainly concerned with motion control [8-10]and hydrodynamic performance [11],whereas few exist on acoustic scattering.For this reason,the main interest of this paper is to simulate and analyze the scattering characteristics of an X-rudder UUV,especially of its stern.
Some numerical or approximate methods have been proposed to predict the acoustic scattering characteristics of a target with a complex shape.At low frequencies,the numerical methods represented by the finite element method (FEM) [12,13]and the boundary element method (BEM) [14]can be used to predict acoustic fields.They are designed to provide accurate results but very computationally demanding at high frequencies.As the frequency increases,the approximate method based on the Kirchhoff approximation[15,16]and the triangulation of the target surface is an ideal tool for analyzing scattering characteristics.Fawcett [17]derived a time-domain expression for high-frequency pulse scattering from rigid bodies using a hybrid Kirchhoff/diffraction method.Wendelboe[18]calculated the far-field scattered pressure of a plane triangular facet,and Abawi [19]proposed a TriKirch scattered model to estimate the scattered pressure of a nonpenetrable triangular facet.As for the bistatic scattering,Wang[20]developed an improved Kirchhoff approximation to model timedomain echoes based on Shadow Contour Theorem [21].Scattered pressure fields are the sum of scattering from the illuminated triangular facets on a convex surface.The main limitation is that the Kirchhoff approximation treats scattering locally and thus does not account for the multiple scattering from different facets on a concave surface.A modified planar element method was proposed to address this issue that considers occlusion and secondary scattering [22,23].A shooting and bouncing rays (SBR)-based method[24-26]can also be used to predict the scattered field of a concave target when an incident wave is reflected on its surface more than once.However,these methods are restricted to tracing facets along the direction of specular reflection and ignore the contributions of nonspecular scattering from facets,which in some cases can dominate scattered fields.Zhang [27]modified the geometrical acoustic reflection of the original SBR model and turned the reflected ray tube into an expanding ray tube.This way,the contributions of nonspecular scattering from the curved surface are considered.The modified model is successfully applied to predicte the first-order scattered fields of curved surfaces,whereas higherorder scattering from the large curvature surfaces is not solved due to the complicated curvature correction.
An iterative physical optics (IPO) approach [28-30]was proposed in the context of electromagnetics that can calculate multiple scattering from mutually visible facets on a concave surface rather than specular facets.The IPO thus yields higher accuracy than SBR for fully capturing the contributions of nonspecular scattering from curved surfaces.In the context of acoustics,Rudgers[31]derived an analytic expression for the acoustic field of a radiating source with an arbitrary shape through the Helmholtz integral equation,where the Neumann series constructed a Green's function.This method enables the theoretical framework for mutual radiation to be readily extended to encompass multiple scattering of concave surfaces,whereas the means of numerically implementing the expression are not given.
As a popular high-resolution imaging technique of sonar targets,synthetic aperture sonar (SAS) image represents the amplitude,phase,and relative location in both down-range and cross-range of each scattering center on complex targets [32].Specifically,an emerging SAS imaging mode,circular synthetic aperture sonar(CSAS) imaging technology,uses the sonar-mounted platform to make circular motions around an observation target so that it can obtain echo data in all directions of the target[33-37].According to the principle of acoustic reflection tomography [33],the backscattered echoes are coherently processed to obtain the target fullaperture image.Then,CSAS can obtain more comprehensive and richer target scattering information than linear SAS.The CSAS image information is typically obtained using monostatic scattered field data from measurements [33-35]or numerical simulations[36,37].The measured data is accurate but often very costly.It is not easy to access an anechoic tank and a complex measured target model.With the rapid development of computer technology,computational acoustic simulations are often used instead of experimental measurements to obtain scattered data.Fan [37]presented the simulated results of CSAS imaging of a scale benchmark submarine model,where the TriKrich model is used to generate echo signals.Experimental results validate the simulated image.In addition,the simulated image of the cross-rudder submarine projected on thexyplane does not involve modeling multiple scattering.However,for the image of other imaging planes or X-rudder vehicles,scattered fields need to be modeled as a collection of targets’ centers to fully consider the single scattering and multiple scattering.
By referring to the TriKirch model and IPO method,our work incorporates the ideas of triangulation and iteration into a numerical implementation of the relevant expression [31].We then extend it to the case of multiple scattering from a rigid concave target.Hence,an iterative physical acoustics (IPA)-based method for predicting the characteristics of multiple scattering from a rigid concave target is proposed here.No restrictions on the curvature of the target’s surface and the orders of multiple scattering are made.It is noted that the method is designed to approximate the field integral for a rigid target;it is also based on the assumption of a high-frequency approximation to ensure edge effects small enough.Furthermore,a two-dimensional (2-D) Fourier transform is performed to invert the forward IPA model to develop a CSAS imaging model.Wherein two approximate analytic formulae with precise physical meanings are derived to predict the target strength (TS)and CSAS image of the concave target,including multiple scattering effects,respectively.The image generated by the proposed model depicts not only the shape and size of the target but also some prominent features of its multiple scattering characteristics.
The remainder of this paper is organized as follows: Section 2 introduces the Helmholtz integral equation and Neumann series to the computation of scattering from an arbitrarily shaped target,and explains how this equation can be numerically implemented.Furthermore,a CSAS imaging formula with multiple scattering is further derived using a 2-D Fourier transform.In Section 3,one case of a sphere segment is studied to validate the accuracy of the IPA.The other case studies the multiple scattering characteristics of a simplified X-rudder UUV through TS and CSAS imaging simulations.In addition,we discuss the influence of adjacent rudders'angles on the UUV's multiple scattering characteristics.In Section 4,an acoustic scattering experiment involving an X-rudder UUV's stern is conducted and analyzed.Finally,a summary is given in Section 5.
2.Model descriptions
In this Section,we first introduce the Helmholtz integral equation with an appropriate Green's function in terms of the Neumann series[31]and its application to the computation of the scattering of an arbitrarily shaped target with rigid boundaries.Then,we triangulate the surface integral and introduce a simplified Gordon's integral algorithm [38,39]to yield an iterative analytic formula,given by Eq.(11).Based on this formula,the TS of concave targets,including multiple scattering effects,can be well predicted.Finally,a CSAS imaging formula with multiple scattering is further derived by a 2-D Fourier transform of Eq.(11).
2.1. Helmholtz integral equation and neumann series
The harmonic time dependence e-iωtis assumed for acoustic fields and suppressed below,where ω is the angular frequency andtis time.The pressure field at a field position vector r is expressed through the Helmholtz integral equation as
wherep(r′)is the total field at the position vector r on the surfaceS,G(r,r′)is a Green's function.In the Neumann problem,the integral Eq.(1) is made explicit [31].
where ρ is the density of the medium andUn(r′)is the normal velocity of the surface.For arbitrary-shaped surfaces,Rudgers[31]formally obtained Green’s function in terms of the Neumann series,the first term being the free-space Green’s function.Other terms consider multiple interactions of each wavelet scattered by the surfaces.That is
with Ω(r)is an exterior solid angle,andg(r,r′)is the free-space Green's function,
andqdenotes the ancillary function,
andl(j)(r,rj)indicates the operatorl(r,r′)concatenatedjtimes
In addition,the radiation integral Eq.(2)can be extended for the study of scattering from rigid targets,in which case a fictive normal velocity is excited by an incident wave on boundaries,leading to
wherepi(r′)is the incident field given bypi(r′)=exp(ik|ri-r′|)/|ri-r′|,riis a source position vector,andkis the wavenumber of the medium.
Insertion of Eq.(3) and Eq.(9) into Eq.(2) leads to a scattering integral with multiple interactions.
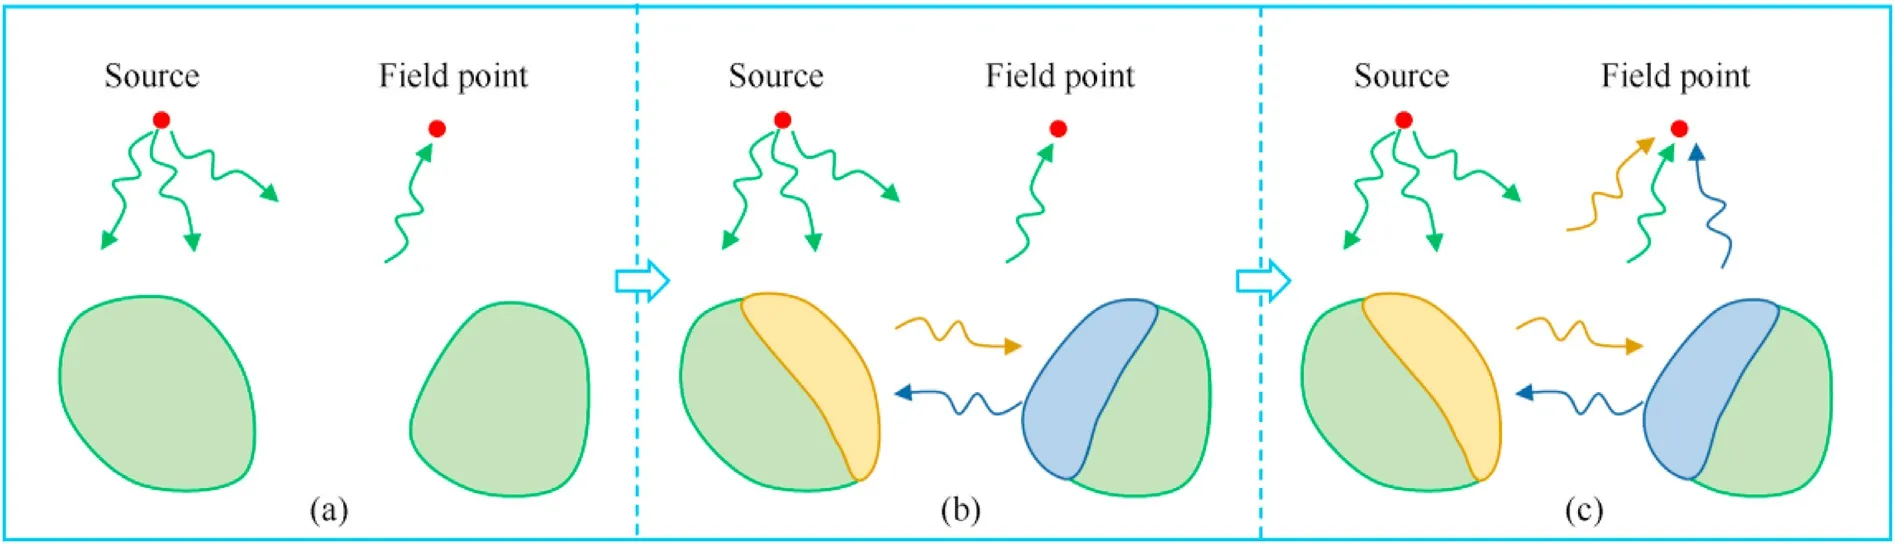
Fig.1.Computation process for two illuminated sub-surfaces and the zeroth-and first-order scattering: (a) The incident sound wave from the source induces the zeroth-order scattering and updates the surface pressures in color;(b) Surface pressures on two sub-surfaces corresponding to the first-order scattering result from the scattered pressures from the other sub-surface;(c) The total scattered pressure at a field point is the coherent superposition of the zeroth-and first-order scattered echoes of the two sub-surfaces.
2.2. Numerical discretization of the integral equation
Suppose that the arbitrarily shaped surface is numerically discretized by elementary triangular facets [17-19].When meshing the surface,the maximum dimension of each flat facet isD=λ/6,where λ is the wavelength of an incident wave.The far-field criterion for each facet isRmin>2D2/λ=λ/18.Thus,a facet falls within the far-field regions of other facets and the field point.Fig.2 shows the interaction between two facetsmandn.Here,the following can be defined.
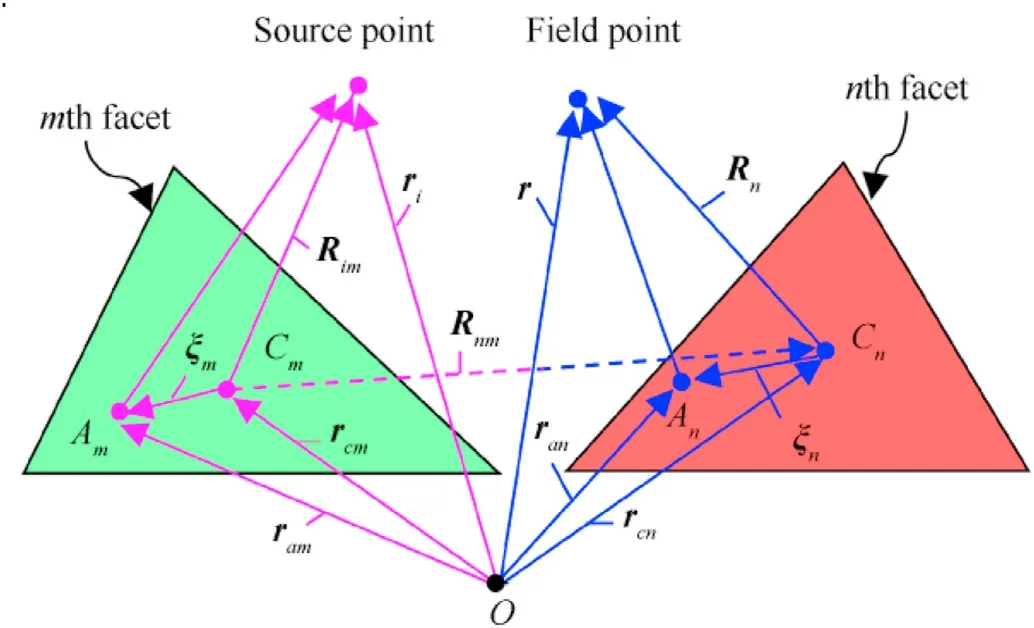
Fig.2.Geometry to calculate the first-order scattered field,resulting from the scattering from the n th triangular facet illuminated by the m th triangular.
(1) ranis the position vector from the originOto an arbitrary pointAnon a facet's surfaceSn,rcnis the position vector fromOto a centroidCnonSn,and ξn=ran-rcn.
(5) Note that the subscript "m" can substitute for "n" to denote the above definitions regarding themth facet.
From Eq.(10),the field scattered fromNfacets constituting the surface andQorders of interaction,ps(r),is approximated as
wheredenotes the surface pressure corresponding to theqth order of interaction,evaluated as detailed in Eq.(11b).
Note that the pressure field is attributed to the calculation of integrals Eq.(12).For a polygonal facet,Gordon [38]reduced a surface integral to an analytically closed expression involving no integration.Furthermore,a simplified Gordon's integral algorithm[39]can be directly used to evaluateIn(Sn)andInm(Sm).It omits the complicated process of transforming global coordinates into local coordinates and moving a local phase center into a global phase center.Then,
where sinc(x)=sin(x)/x,Δavn=a(v+1)n-avnwith aV+1=a1,and Δbvn=(a(v+1)n+avn)/2,in which a1n,…,avnare vertices of the Vpolygon for 1 ≤v ≤V,andV=3 for a triangular facet.
Without considering sophisticated masking corrections,the scattered pressure field of a surface accounts simply for contributions from the illuminated and mutually visible facets satisfyingReaching a sufficiently low threshold σ can halt the iterative procedure,where a suitable convergent condition is given by
The iterative procedure can be continued until the total scattered pressure converges.Interactions among facets that generate higher-order fields are negligible due to the free-space propagation attenuation.Thus,the scattered pressure converges very soon,especially for distant facets.
Urick[40]gives an excellent review of TS definitions referring to the ability of a target to return an echo.The echo can comprise rigid and elastic components.The former mainly contributes to the TS,while the latter may be ignored,which does not change the overall tendency of TS.Thus,in this paper,we only consider the case that the target is rigid,and then the TS [40,41]with the effects of multiple scattering is defined as
2.3. CSAS image reconstruction
With the explicit angular and frequency dependence of scattered fields,we will proceed to the study of CSAS image reconstruction.The transducer-target-receiver geometry is shown in Fig.3,wherexandyrepresent a Cartesian coordinate system with an originOslocated at the scene's center to be imaged by the sonar.The directions of propagation of the sonar transducer and receiver are at azimuth angles of θTand θRto thexaxis,respectively.The circular sonar system effectively projects the target's 3-D target function on the 2-D imaging plane;thezdirection is perpendicular to thexyplane.Then,v(x,y)denotes the 2-D distribution of the amplitude of the echo scattered by the target.The target function v(x,y)and the scattered field are related through a 2-D Fourier transform [42].
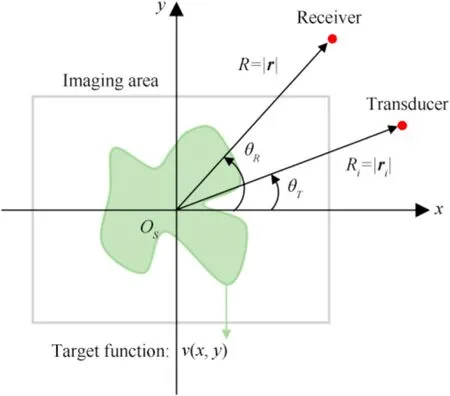
Fig.3.Plane view of the transducer-target-receiver geometry.
The circular sonar system reconstructs an image of the target from projections recorded at all azimuth angles,yieldingkx=k(cos θT+cos θR)andky=k(sin θT+sin θR).This leads,for the JacobianJ=k[1 +cos(θT-cos θR)],to
Usually,the frequency range is limited,thenkmin≤k≤kmax,and Δk=kmax-kmin.The integral domain will therefore be limited,leading to
To numerically discretize the integral Eq.(19),the wavenumber values and azimuth angles are discretized inNkandNθsamples,respectively.The wavenumber sample is denoted aska=kmin+(a-1)δk,where δk=Δk/(Nk-1),anda=1,…,Nk;the azimuth angle sample is denoted as θRb=θRmin+(b-1)δθ,where δθ=2π/(Nθ-1),andb=1,…,Nθ.Then,Eq.(19) becomes
Eq.(20)gives the amplitude of each image pixel on the imaging area.For a given target,we first choose a range window[-Lx/2,Lx/2] and a cross-range window [-Ly/2,Ly/2].Here the zero range and cross-range point correspond to the origin of the target,and [Lx,Ly] are chosen to be approximately twice the dimensions of the target.The image plane is then divided intoNLequally spaced range andMLequally cross-range bins with bin widths δLx=Lx/(NL-1)and δLy=Ly/(ML-1),respectively.The image plane is discretized with grid pointsLxα=-Lx/2 +(α-1)δLxandLyβ=-Ly/2 +(β -1)δLy,where α=1,…,NL,and β=1,…,ML.The bin widths should be chosen to ensure proper sampling in the range and cross-range directions.Then,Eq.(20) becomes
Eq.(21) can be used to reconstruct an image with the multistatic sonar system.Specifically,for a monostatic configuration ofEq.(21) can be expressed simply as
It is noted that,in this paper,a monostatic approximation is made,and then Eq.(21) can be simplified into Eq.(22).Using the expressions of Eq.(13)in Eq.(11),the IPA model,including multiple scattering from a concave target,is obtained.Based on Eq.(11),the formulae for TS prediction and CSAS imaging are given by Eqs.(15)and (22),respectively.
3.Numerical results
In this section,we discuss two cases of the numerical implementation of the IPA targeted toward an application involving multiple scattering effects.The first case is a study of multiple scattering from a sphere segment.Results are compared with those obtained with the TriKirch and FEM to validate the accuracy of the proposed method.The second case focuses on the multiple scattered fields generated by a simplified X-rudder UUV.The IPA is further used to predict its TS and CSAS images.A convergence threshold,σ=10-3,is set for the following simulations.
3.1. Scattering from a concave spherical segment
A simple concave target in the form of a spherical segment is used to test the accuracy of the proposed method,as shown in Fig.4(a).Its width and cross-section radius areWs=0.5 m andRs=respectively;the corresponding central angle χ is 60°.An incident wave illuminates the model with an azimuth angle θ in the θ=0°coordinate plane.The KA representation is applicable in situations where the high-frequency assumption is valid,and its accuracy improves with increasing value of the wavenumberdimension product,ka[43].KA results are good for modeling fish target strength forka>4.07[44].A good accuracy of KA can also be observed forka>5 for the computation of backscattering from curved interfaces [45].Given that the IPA is proposed in the KA framework,the conditionka>4.2 (namely,f>2 kHz forWs=0.5 m) is chosen to cope with the high-frequency acoustic scattering problems here.Fig.4(b) shows a comparison of TS among the IPA,TriKirch,and FEM as a function of frequency at θ=0°.It is noted that the FEM solution converges to the exact solution as long as the discretization of elements is sufficiently fine[46,47].Here,the FEM implementations in COMSOL provide accurate results.In contrast to the TriKirch solution,the IPA solution coincides better with the FEM solution.This is because that the TriKirch model just accounts for the direct scattering and cannot correctly estimate fields in the regions dominated by multiple scattering.These results show that the IPA is better suited to computing multiple scattering from curved concave surfaces than the pure Kirchhoff approximation.Fig.4(c)shows the TS calculated by the IPA in terms of the zeroth-,first-,second-,and third-order scattering.It can be seen that the first-order scattering mainly contributes to the scattered field.Besides,the zeroth-,second-,and third-order scattering that interact with the first-order scattering are also significant.Results show that the high-order scattering is not negligible for modeling acoustic scattering from concave targets.
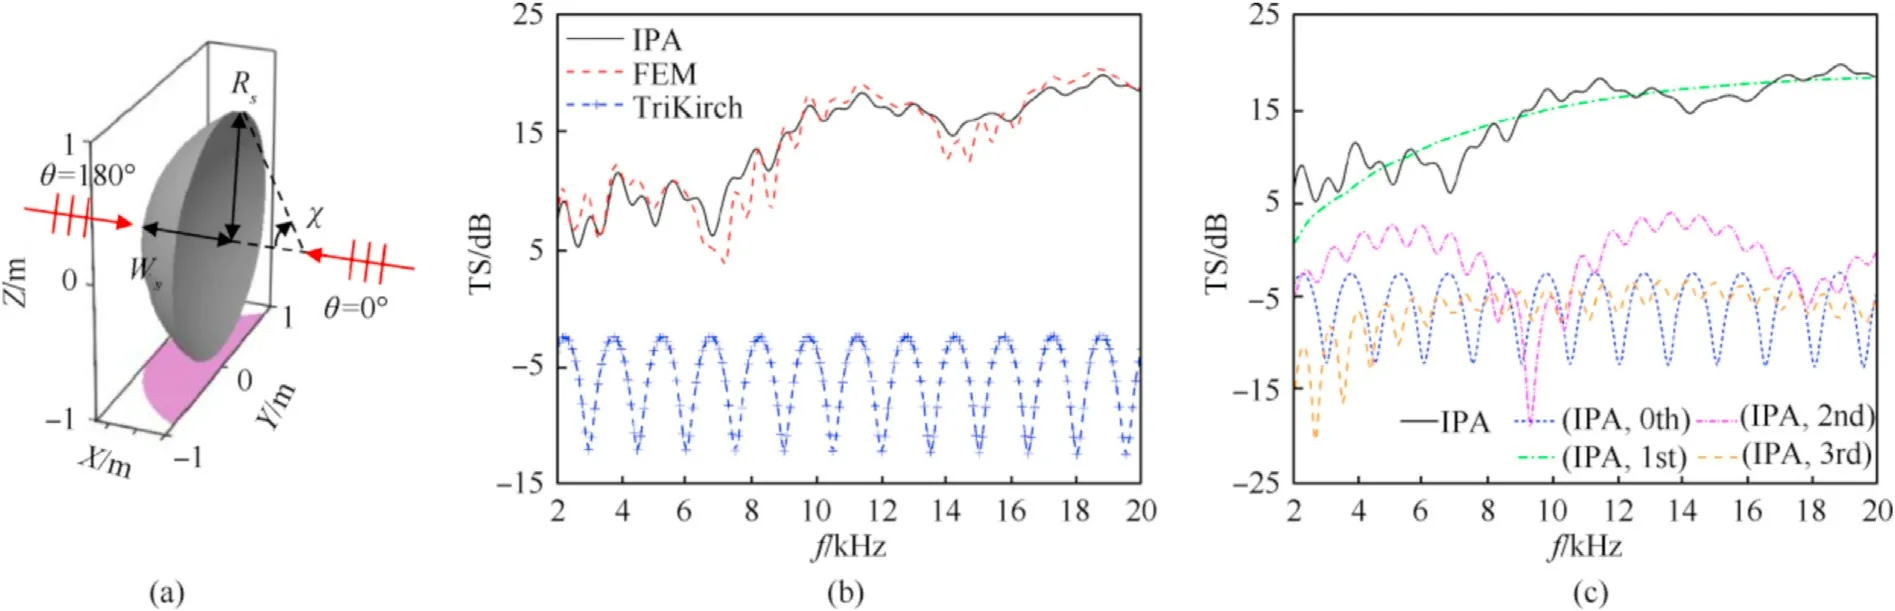
Fig.4.(a)Geometry of a concave spherical segment with a width of Ws=0.5 m and a cross-section radius of Rs= min the rectangular coordinates(x,y,z);an incident wave arriving with an azimuth angle of θ in the xy coordinate plane.Comparison of TS of the concave spherical segment for θ=0° as calculated by(b)the IPA,TriKirch,and FEM;(c)The total,zeroth-,first-,second-,and third-order scattering of IPA individually.
Additionally,the results versus azimuth angle forf=2 kHz,10 kHz,and 20 kHz are depicted in Fig.5.The directivity plots show that the IPA model well predicts the TS in all directions.It has a better agreement with the FEM for θ <40°when compared with the TriKirch model.As expected,the accuracy of the predicted TS increases with frequency.Forf=2 kHz the accuracy decreases but the multiple scattered fields are still predicted.For higher frequencies a satisfactory agreement is obtained between the IPA and FEM results at most azimuth angles.For the rest of the azimuth angles the difference can be attributed to the fact that IPA does not account for the edge diffraction.A detailed comparison of accuracy between the proposed method and the other comparative methods i‖s given in‖ th‖e follo‖wing.The relative error is defined aswhere TSFEMis the TS vector obtained by the FEM,anddenotes vector-2 norm.Table 1 summarizes the relative errors for the above calculations.Results demonstrate that the proposed method can produce more accurate results than the TriKirch model and solve multiple scattering problems regarding concave targets.
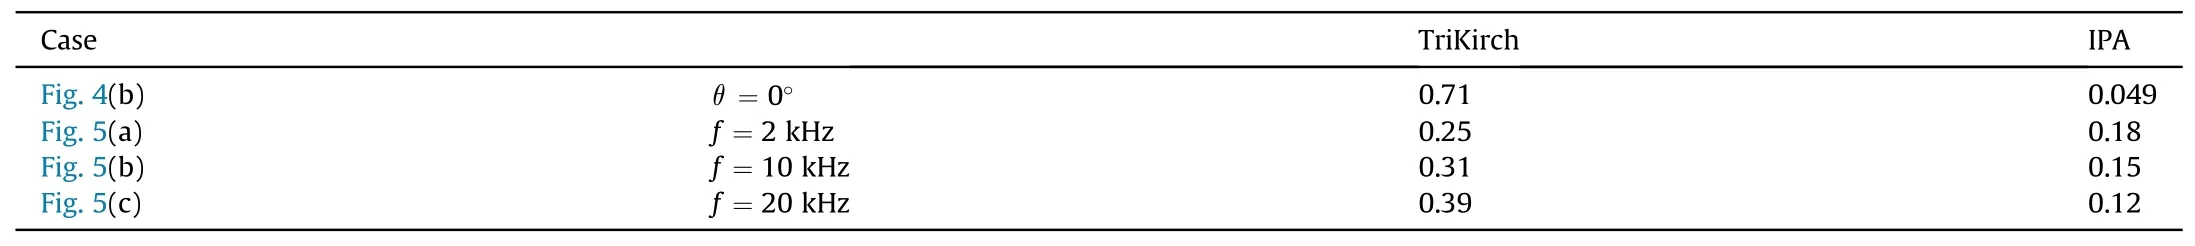
Table 1 Comparison of relative errors for different methods.
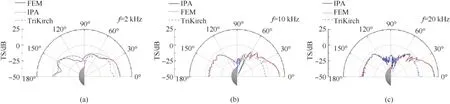
Fig.5.Comparison of TS of a concave spherical segment as calculated by the IPA,TriKirch,and FEM for varying θ at (a) f=2 kHz,(b) f=10 kHz,(c) f=20 kHz.
The IPA scheme is presented as the iterative solution of an approximate Helmholtz integral equation.The threshold σ can be easily monitored to indicate when the solution converges sufficiently [48].In other words,the convergence threshold can determine the end of iterations.We consider the change in the threshold σ for the case in Fig.4(b).The relative error in calculating TS as a function of threshold σ is shown in Fig.6(a).Results show that the relative error decreases as the threshold σ decreases.They also show that the relative error does not decrease when the threshold σ decreases to a certain value.Results explain why we choose σ=10-3in the IPA simulations.The relative error may result from the edge diffraction,so it may continue to decrease when the physical theory of diffraction is incorporated into the study.Besides,the number of iterations required to obtain a convergent result is the same as the order of physical interaction,Q.Nevertheless they depend on the geometry complexity of the target and vary with the frequency and azimuth angle.For complex geometries,the order of interaction may not be easy to guess a priori[48].In terms of the case in Fig.4(b),the order of interactionQversus the frequency for σ=10-3is shown in Fig.6(b).In terms of the case in Fig.5(b),the order of interactionQversus the azimuth angle is shown in Fig.6(c).Fig.6(d) shows the comparison of TS between IPA and TriKirch versus the central angle χ at θ=0°for 10 kHz,in conjunction with the order of interaction.Results show that the order of interaction increases with the increasing frequency and central angle,ae well as the decreasing azimuth angle.For a threshold of σ=10-3there is a max of 5 orders of interaction.The results prove that the IPA method is convergent fast.Because the geometrical shadowing is included to improve the initial approximation.This is based on the premise that convergence of iterative solutions is much more rapid when the initial approximation is close to the final result.

Fig.6.(a)Relative error in calculating TS as a function of threshold σ for case in Fig.4(b).The order of interaction Q;(b) Versus frequency for case in Fig.4(b);(c)Versus azimuth angle for case in Fig.5(b);(d) Comparison of TS between IPA and TriKirch versus central angle χ at θ=0° for 10 kHz,in conjunction with Q.
Next,the CSAS images of the concave spherical segment are produced using Eq.(22),as shown in Fig.7.The scattered fieldpsin Eq.(22) is calculated by the proposed method,TriKirch,and FEM.The imaging simulation parameters are shown in Table 2.Again,to compare the imaging results,we adopt another relative error as the evaluation criterion,defined aswhere VFEMis the image generated by the FEM,andThe relative error between the images generated by the proposed method and FEM is 0.03.And the relative error between the images generated by the TriKirch model and FEM is 0.87.Therefore,it demonstrates that the results of IPA agree with those of FEM.To better visually inspect the image feature,we also overlaid the target's wireframe on the image.The direct scattered feature depicts the outline of the target.Results also prove the viability of IPA use for CSAS image simulations including multiple scattering effects.
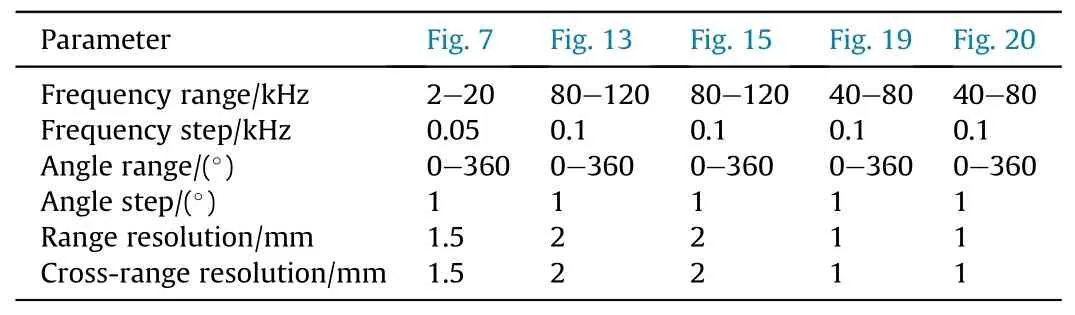
Table 2 Simulated parameters for CSAS images.
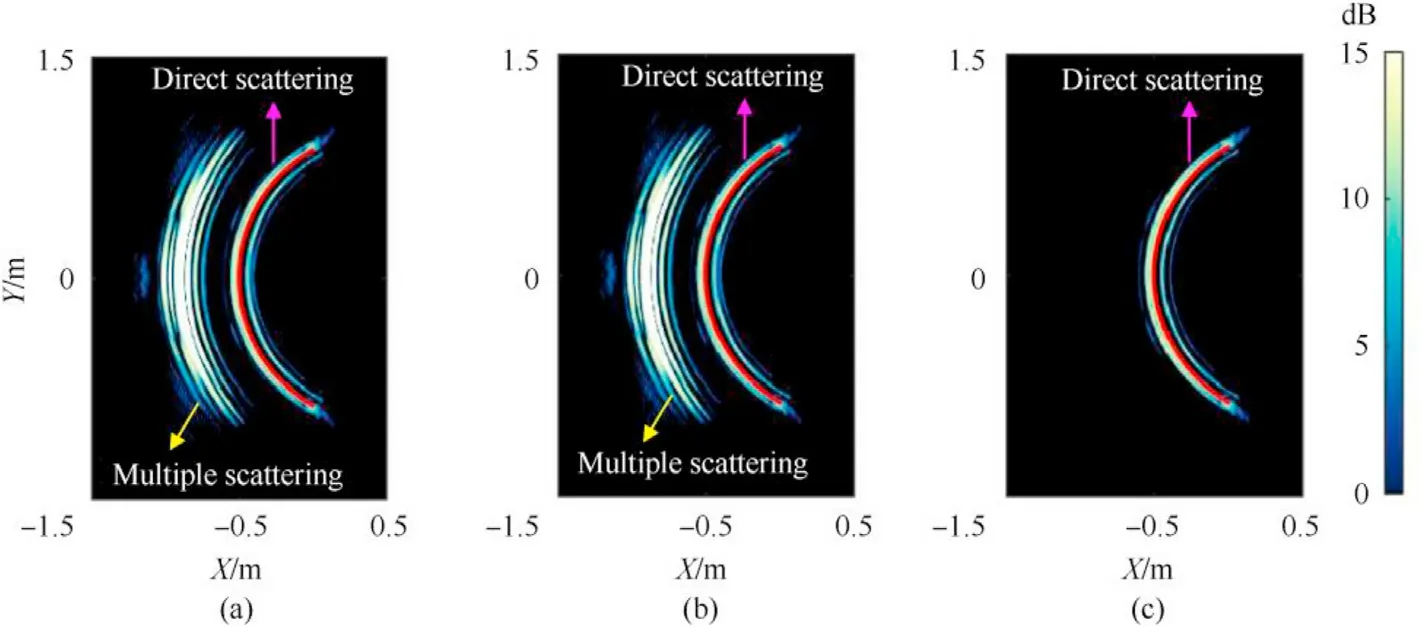
Fig.7.Comparison of CSAS images of concave spherical segment generated by the(a)IPA,(b)FEM,and (c)TriKirch individually.Target's wireframe in red is superimposed on the image.
Fig.8.2-D geometry model of CSAS system in the presence of(a)off-center trajectory error and (b) sinusoidal trajectory error.Imaging results with (c) off-center trajectory error and (d)sinusoidal trajectory error.Target's wireframe in red is superimposed on images.
The ideal CSAS system can form high-resolution images,as shown in Fig.7(a).However,the system would suffer from motion errors in practice,namely in the lake or sea experiment.Motion errors reduce its imaging performance and result in geometric degradation in images where the target may be mispositioned or smeared [49,50].Also,this may lead to errors in the processed images if the sonar is moving during the measurement process.To have a better insight into the effects of these practical factors on CSAS images,a calculation by the IPA is carried out as follows,during which the parameters related to Fig.7(a)are adopted.Fig.8 shows the 2-D geometry model of CSAS system and the corresponding CSAS images.In Fig.8(a),the dotted line denotes the ideal motion trajectory,andRIis the radius of circular trajectory;the solid line denotes the real trajectory with a deviated originO′slocated at (0.5,0.5) m.In Fig.8(b),the solid line denotes the real trajectory with the addition of a sinusoid of amplitude 0.5m.As compared to the image shown in Fig.7(a),we see that there are constant position shifts in the image for the case of off-center trajectory error,as shown in Fig.8(c).The two intersecting arcs are caused by the direct scattering from the inner and outer of the model,however,they are coincident without any trajectory errors.For the case of sinusoidal trajectory error,the image is completely defocused and cannot depict the outline of the model,as shown in Fig.8(d).Moreover,this paper mainly focuses on a short-pulsed CSAS platform.Here,the intra-pulse movement [51]of CSAS can be ignored and a quasi-stationary approach [52]is adopted in the CSAS imaging process.In the above image simulations,the trajectory radius is only 25mand a monostatic approximation can be made.However,when the trajectory radius is expanded to a large value,a bistatic angle seems inevitable from the signal transmission to reception.Assuming that the angular velocity of the CSAS platform is ωs=1 rad/s.To better visualize its effect on images,the trajectory radiusRIis expanded from 25 to 250 m,and then the bistatic angle θsis increased from 2°to 20°.Fig.9 shows the 2-D geometry model of the CSAS system and the corresponding CSAS images.As compared to the image shown in Fig.7(a),there are no noticeable differences for the case ofRI=25 m and θs=2°,as shown in Fig.9(b).For the case ofRI=250 m and θs=20°,it becomes evident that neglecting the platform motion from the signal transmission to reception leads to strong errors that decrease the image quality,as shown in Fig.9(c).Results show that the proposed method can reproduce CSAS images with motion errors or the platform motion during measurements.Meanwhile,researchers have developed various compensation algorithms[53-55]to improve imaging quality.The resulting CSAS images are helpful for the development and evaluation of these compensation algorithms.It is noted that the quasi-stationary approach is no longer effective for a frequency modulation continuous wave(FMCW)technology[51,53].Given that,a CSAS imaging model with intra-pulse motion needs to be further studied.
Fig.9.(a)2-D geometry model of CSAS platform motion from signal transmission to reception.The corresponding CSAS images for the cases of(b)RI=25 m and θs=2°,and(c)RI=250 m and θs=20°.Target's wireframe in red is superimposed on images.
3.2. Scattering from a simplified X-rudder UUV model
Then,a simplified UUV model of dimensions 1.0(L)×0.15(W)×0.15 (H) m,as shown in Fig.10,is used to investigate the multiple scattering characteristics of its X-rudder stern at high frequencies.Fig.11 shows the pressure field distributions on the surface of an Xrudder UUV obtained with Eq.(11b) contributing to the total,zeroth-,first-,and second-order scattering at 80 kHz.At incidence angles of θ=15°and 165°[Figs.11(a) and 11(e)],the direct scattering from the stern and bow mainly contributes to the total scattered field,respectively,with multiple scattering effects being negligible.From Figs.11(b)-11(d),as the incidence angle gets closer to 80°,the mutual coupling between the X-rudder stern becomes increasingly essential to acoustic scattering,which should be considered.In this case,multiple scattering is accounted for up to order 2,implying higher-order scattering effects are ignorable.The direct scattering from the main hull and the multiple scattering from the X-rudder stern are coherently summed to the total scattered field.
Fig.10.Geometry of a simplified X-rudder UUV model with maximum extents in the rectangular coordinates(x,y,z)are 1.0 m,0.15 m,and 0.15 m,respectively;an incident wave arriving with an azimuth angle of θ in the xy coordinate plane.
Fig.12 shows the total,zeroth-,first-,and second-order TS obtained with the IPA,in which the scattered pressures are given by Eq.(11).Contributions from the first and second orders of scattering are summed coherently to get the total TS.The top panels show the TS for varying incidence angles atf=80 kHz,100 kHz,and 120 kHz,respectively.It can be seen that there are three peaks in the IPA (total scattered) curve at around 90°,71°and 80°.The first two match the two peaks of the zeroth-order IPA curve,and the last closely matches the peak of the first-order IPA curve.They correspond to the direct scattering from a cylinder-shaped main hull and a frustum cone-shaped stern,and the multiple scattering from an X-rudder stern,respectively.For increasing θ from 74°to 88°,the zeroth-order (direct) scattering decreases,whereas the first-order scattering increases and mainly contributes to the scattered field.In addition,the first-order scattering makes the most outstanding contribution at around θ=80°.In the vicinity of θ=71°,compared with the zeroth-order TS,the total TS is somewhat lower for 80 kHz and 120 kHz due to the destructive interference between the zeroth and first-order scattering.For 30°<θ <60°,we can observe the complex interference patterns in the total TS.The coherent superposition of the zeroth,first,and second orders of scattering gives rise to rapid oscillations when the differences are relatively small.The bottom panels show the TS as a function of frequency at θ=45°,80°,and 90°.It can be found that the total TS tends to increase with increasing frequency.At broadside incidence (θ=90°),the values of direct scattering strongly affect the total scattered field.For θ=45°,the essential contributions to the total scattering from high to low are roughly the zeroth,second,and first orders of scattering.Furthermore,for θ=80°,the first-order pressure varies as a function of frequency but persists to far greater than the direct over a wide frequency band.They show that multiple scattering is indispensable for simulating an X-rudder UUV.They also suggest that the Kirchhoff approximation would be more robust when incorporated into the multiple scattering mechanisms.
Fig.12.Predicted TS of an X-rudder UUV as calculated by the IPA method versus θ at(a)f=80 kHz,(b)f=100 kHz,and(c)f=120 kHz;versus f at(d)θ=45°,(e)θ=80°,(f)θ=90°.The total scattering comprises the zeroth-,first-,and second-order scattering plotted separately.The inset depicts the scattered geometry.
Fig.13(a)shows the frequency-angle spectra of TS created by the total,zeroth-,first-,and second-order scattering.Again,the narrow bright features at 90°and 71°correspond to specular broadside scattering from the cylinder-shaped main hull and the frustum cone-shaped stern,respectively.Furthermore,the broad bright feature for 74°<θ <88°corresponds to multiple scattering from the X-rudder stern,whereas it becomes relatively narrower at higher frequencies.Fig.13(b)shows the CSAS images of the X-rudder UUV generated from the total,zeroth-,first-,and second-order scattering.The images are simulated by the direct image domain formula Eq.(22) on a 550 × 200 grid using the frequency window from 80 to 120 kHz and angular window from 0°to 360°.The simulation parameters are shown in Table 2.The total scattering image contains essential information on each order of scattering mechanisms.In the zeroth-order image,the apparent features observed are the outline of the UUV.In the first-order image,brighter spots appear near the stern so that the appearance of an Xrudder is enhanced;they are due to the multiple scattering from the X-rudder stern.In the second-order image,the scattering effect appears relatively weak and negligible.Hence,the total image shows the projection of the UUV's geometrical shape as well as the highlights of multiple acoustic scattering on the imaging plane.It is noted that the X-rudder stern feature,which makes up the most distinctive features of the UUV,appears at close range and is focused near the stern.The wave travel path is short for the lack of higher-order scattering,so the scattering highlights gather in the near range.
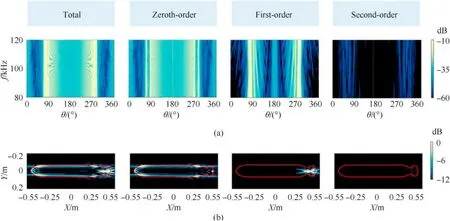
Fig.13.(a)Frequency-angle spectra of TS;(b)CSAS images of X-rudder UUV generated from the total,zeroth-,first-,and second-order scattering individually.All values are in dB.
The angle of adjacent rudders,β,is 90°for a generic X rudder[8],as shown in Fig.10.However,to understand the influence of β on the multiple scattering characteristics of an X rudder,the IPA simulations of an X rudder with varying β [see Fig.14(a)]are conducted.Fig.14(b) with its close-up view in Fig.14(c) shows the results as a function of θ at 80 kHz without an X rudder and with an X rudder of β=70°,80°,90°,100°,and 110°separately.The notable differences among the above occur in the red box and are highlighted in Fig.11(c).They are due to the multiple scattering from an X rudder strongly affecting fields.The peak amplitude in the curve of β=90°at around θ=80°is up substantially compared to the other curves.Also,the curves of β=70°and 110°now roughly match the curve of no X rudder.The multiple scattering from an X rudder of β=90°is the strongest and drastically declines for a non-orthogonal X rudder.As expected,although the deviations from an orthogonal state are not quite large,local peaks'amplitudes are still diminished significantly.These results provide a design basis for an X rudder with a better acoustic stealth performance.
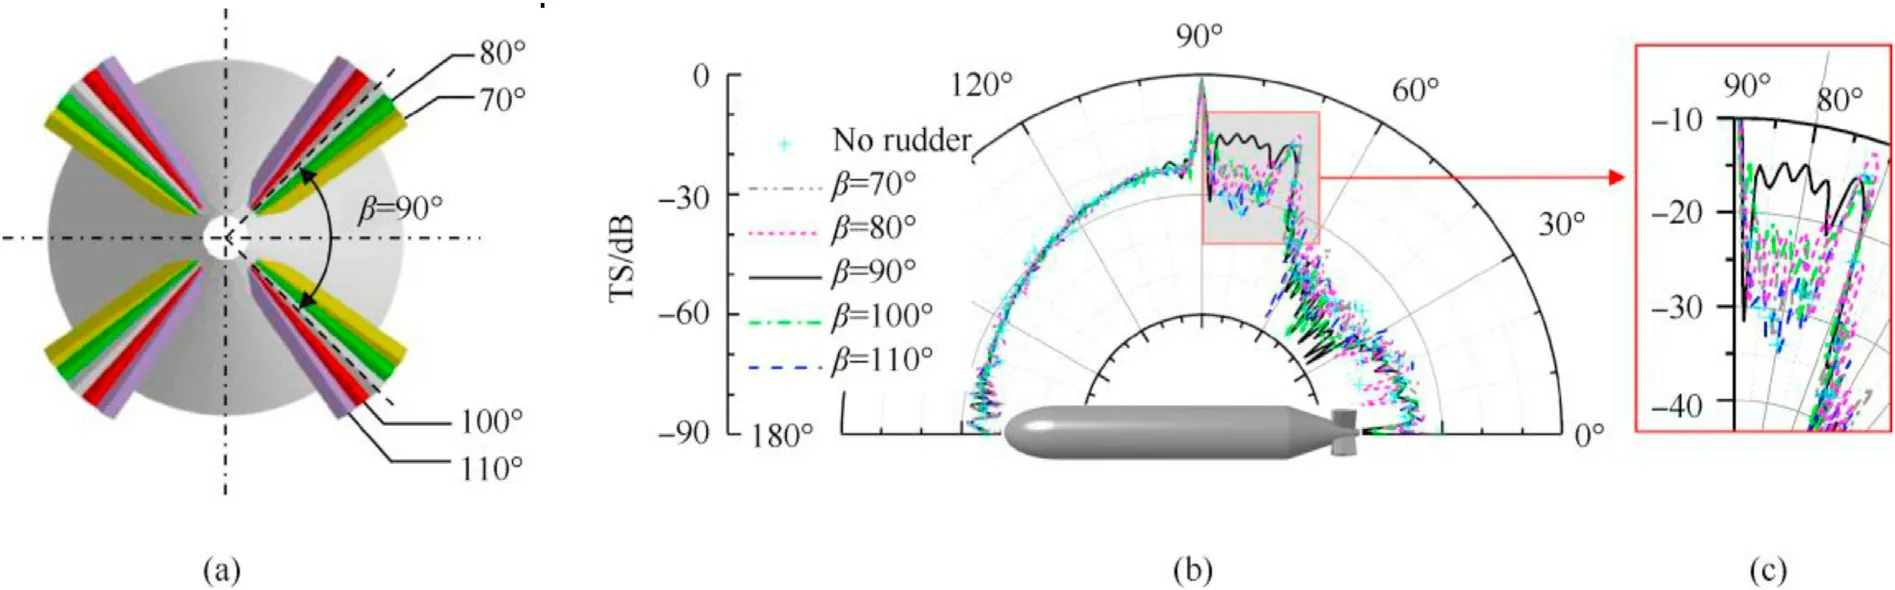
Fig.14.(a)Layout comparison of X rudder with varying β;β denotes angle of adjacent rudders;(b)Comparison of TS of UUV with and without an X rudder as calculated by the IPA versus θ at 80 kHz.Curves of β=70°,80°,90°,100°,and 110° plotted separately;(c) Close-up view of (b).
Fig.15 shows the CSAS images of the UUV with and without an X rudder.The simulation parameters are shown in Table 2.For the UUV with an X rudder,the angle of adjacent rudders varies from 70°to 110°at 10°intervals,as shown in Fig.14(a).By comparison,the significant differences in image features appear at an X-rudder stern,which is no surprise since the multiple scattering effects are sensitive to the adjacent rudders’ angle.As expected from the image set,the X-rudder structure clearly visible in the image β=90°is absent or highly suppressed in the images of the other angles.
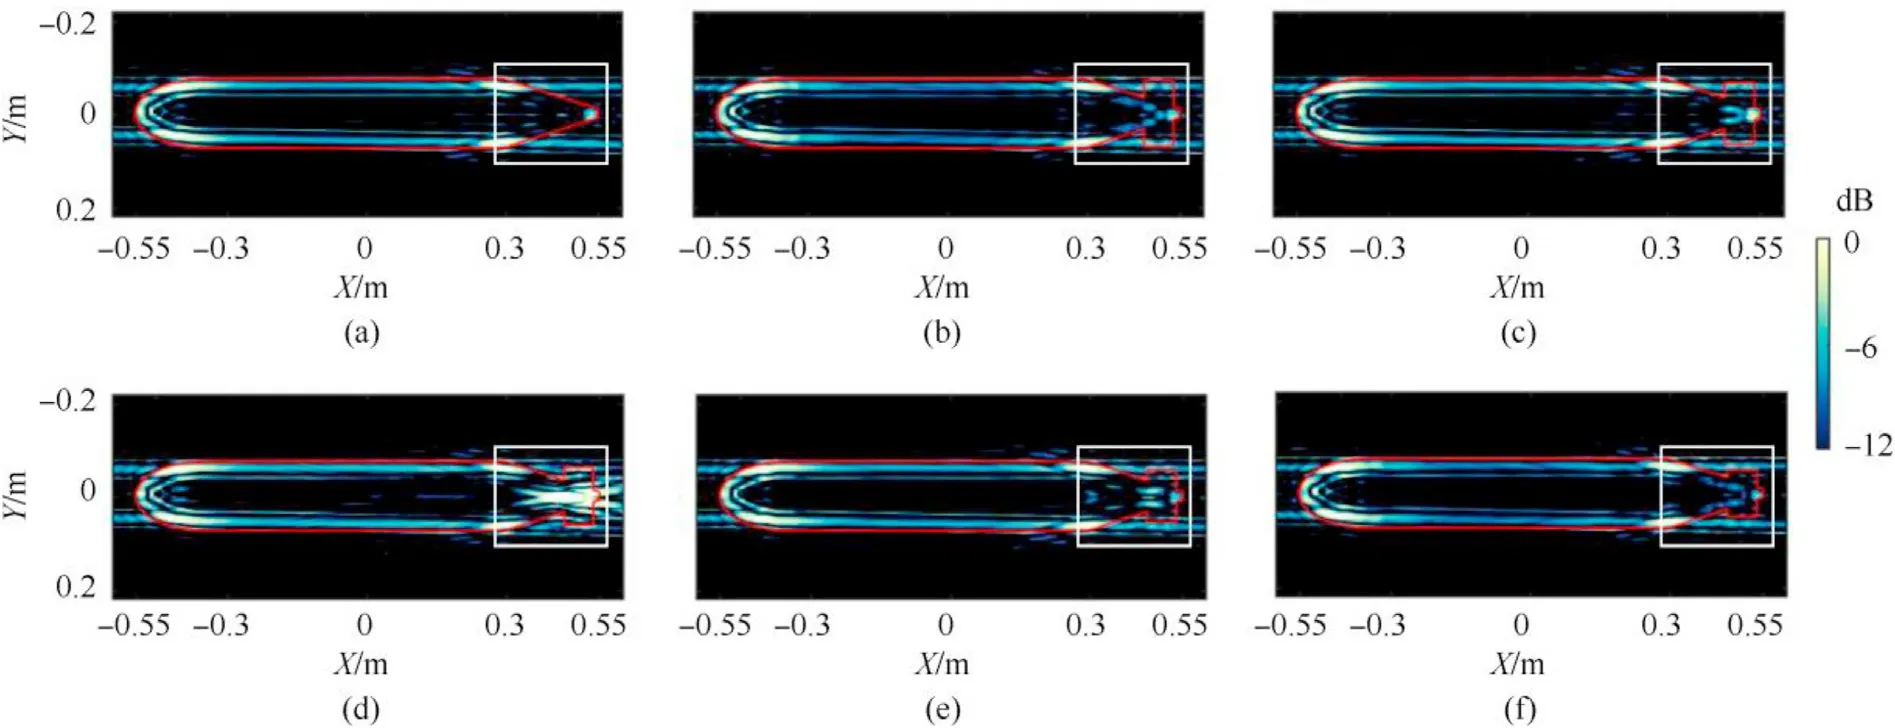
Fig.15.Comparison of CSAS images of UUV(a)without X rudder and(b)-(f)with X rudder for varying angles of adjacent rudders;(b)β=70°;(c)β=80°;(d)β=90°;(e)β=100°;(f) β=110°.The images are generated from the total scattering.All values are in dB.
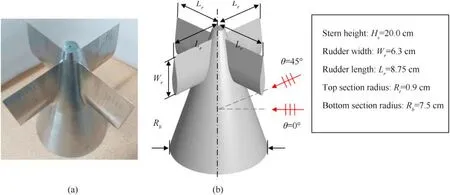
Fig.16.X-rudder stern of UUV: (a) Photograph;(b) Geometric model with principal dimensions.
4.Experimental results
To verify the effectiveness of the proposed method and demonstrate the scattering characteristics of the X-rudder UUV's stern,we conducted an acoustic scattering experiment where the stern model was vertically immersed in a 5 m×5 m×5 m waterfilled tank.Figs.16(a) and 16(b) show the photograph of the experimental model and its principal dimensions,respectively.Fig.17 shows the experimental setup.The experimental model spins around its axis at 0.5°/s in sequence and is controlled by a mechanical turntable,whereas the transducer and receiver are fixed.The transducer's frequency range is 40-80 kHz,and the receiver is a B&K hydrophone type 8103 operating over a frequency range of 0.1 Hz-180 kHz,with a receiving sensitivity of-211 dB re 1V/μPa.An uninterrupted power supply powers the entire measurement system to remove AC interference.The experimental model is made of solid stainless steel,whose reflection coefficient is close to 1 for the cases of high frequencies and most incident angles.The elastic coupling characteristics known to be relatively weak have no significant effects on the echo strength of the model.If one is interested in determining the elastic scattering specifically at low frequencies or certain incident angles,this does present a challenge.However,in this treatment,we are not interested in the elastic coupling characteristics of the model at any particular point.Hence,simulations apply the model in conjunction with rigid boundary conditions.
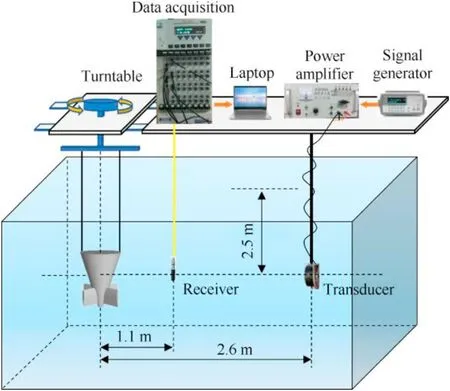
Fig.17.Experimental setup.
The incident wave is constructed as a segment of an LFM signal from 40 to 80 kHz,with a pulse width of 0.2 ms and a burst period of 500 ms,to achieve long and steady-state measurements.Fig.18 compares the TS of the stern model obtained with the simulations,namely the IPA,TriKirch,and FEM,and the experimental measurements at 50 kHz and 60 kHz.The scattering echoes excited by the X-rudder stern have a period of 90°,and then we analyze the case of 0°≤θ <90°for simplicity.For 30°<θ <60°,the TriKirch model also can give an accurate prediction of TS;however,for 0°<θ <30°and 60°<θ <90°,it produces undesirable results.This is because the TriKirch treats the scattering locally and just accounts for the direct scattering components.As expected,the results of the IPA,FEM,and experiment visibly coincide.They show that the IPA can adequately capture contributions of multiple scattering mechanisms,which dominate the scattered field.They also show that the use of IPA is better suited to compute multiple scattering from concave surfaces than convex surfaces.Specifically,in the vicinity of θ=0°and 90°,the effects of multiple scattering are the strongest.The high-order echoes interfere with the direct echoes,so the scattered fields are enhanced at 50 kHz and weakened at 60 kHz.
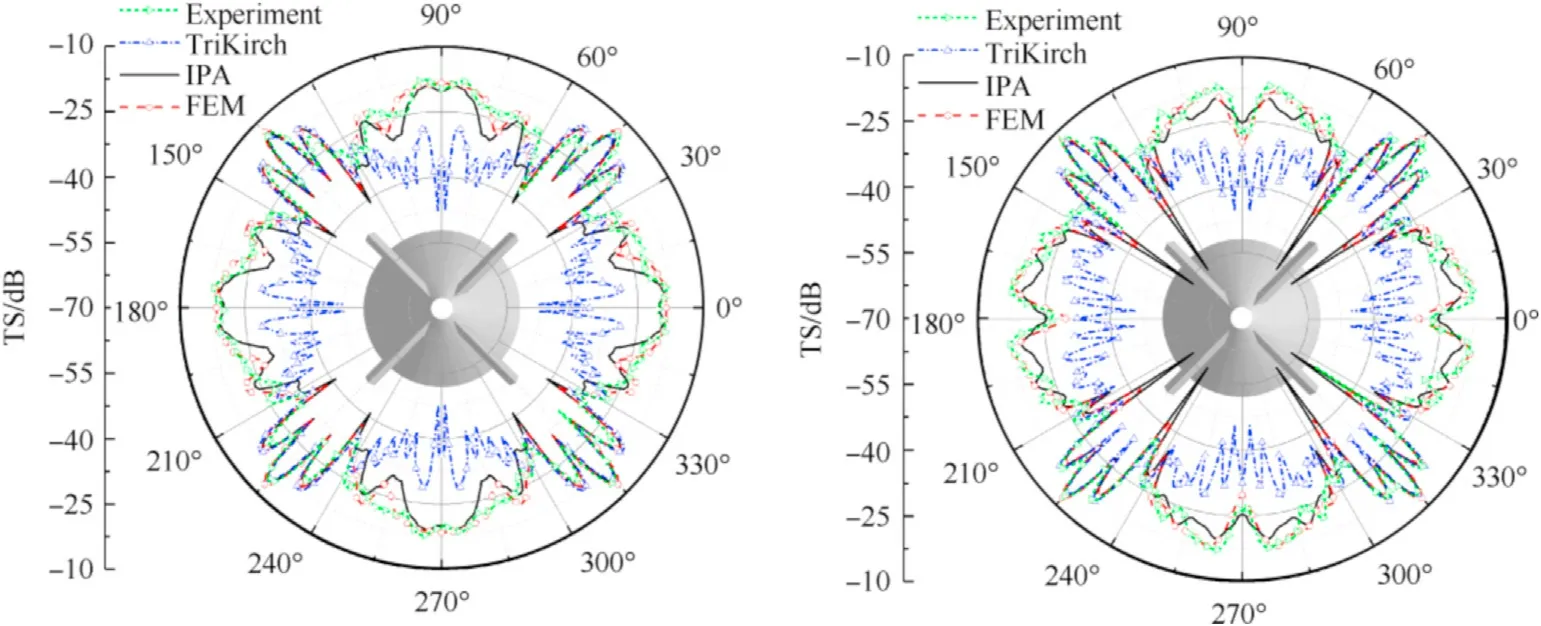
Fig.18.Comparison of TS of X-rudder UUV's stern among different simulations,namely IPA,TriKirch,and FEM,and experimental measurements versus θ at (a) 50 kHz and (b)60 kHz.The inset shows the stern model.
Fig.19 compares the CASA images of the X-rudder stern created from 40 to 80 kHz sonar data and simulations.Fig.19(a)displays the experimental image,and Figs.19(b)-19(d) displays the simulated images corresponding to the total,zeroth-,and first-order scattering.For higher-order scattering images,the signal is too weak to be shown.The simulation parameters are shown in Table 2.Inspection of Figs.19(a)and 19(b)shows that the prominent features of the images generated from measurement and simulation are consistent.The discrete bright spots represented by the four rudders are prominent,as is the specular reflection from the boundary that coincides with the outer rim of the stern.Another acoustic highlight observed at the circle’s center is associated with the small end face of the truncated cone.The above acoustic highlights are attributed to the direct scattering contributions.Furthermore,the multiple scattering effects of the X-rudder stern contribute to the broad ring feature around the circle’s center.The differences between the experimental and simulated results may be because the transducer,receiver,and stern model centers are not aligned.
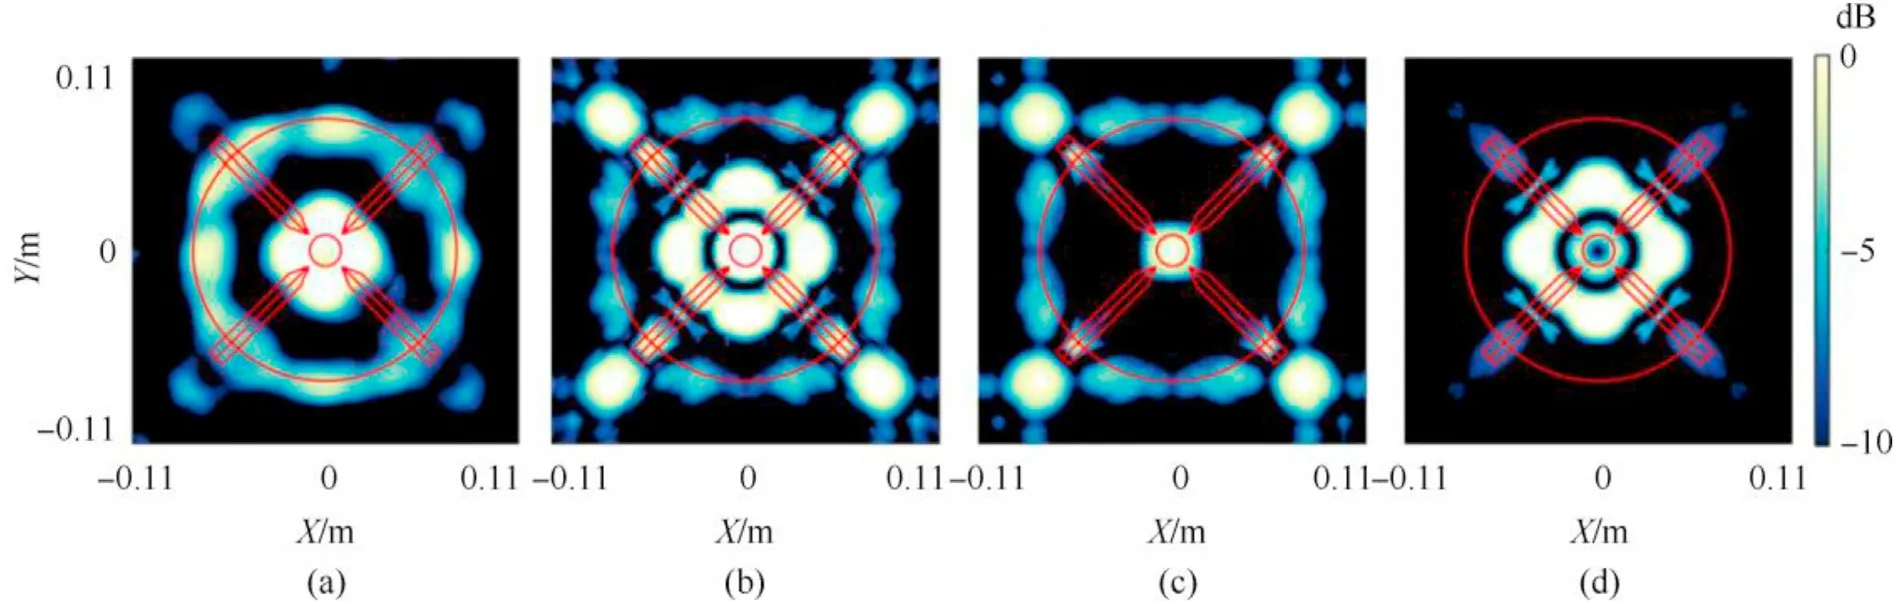
Fig.19.Comparison of CSAS images of X-rudder stern generated from(a)experimental measurements and(b)-(d)simulations corresponding to the total,zeroth-,and first-order scattering,respectively.All values are in dB.
Here,we proceed with the IPA simulations to generate the CASA images of the sterns with adjacent rudders angle β not equal to 90°.Owing to the geometric symmetry,we just consider two cases of β=100°and 110°.The simulation parameters are shown in Table 2.The CSAS images of two kinds of sterns generated by the total,zeroth-,and first-order scattering are shown in Fig.20.As expected,the CASA images can still outline the figure of the stern and even distinguish the adjacent rudders angle.However,for the images of β=100°and 110°the notable broad ring features are highly suppressed,in contrast to images of β=90°.Together with Fig.19,these results prove that a non-orthogonal X rudder stern has a good acoustic stealth performance.
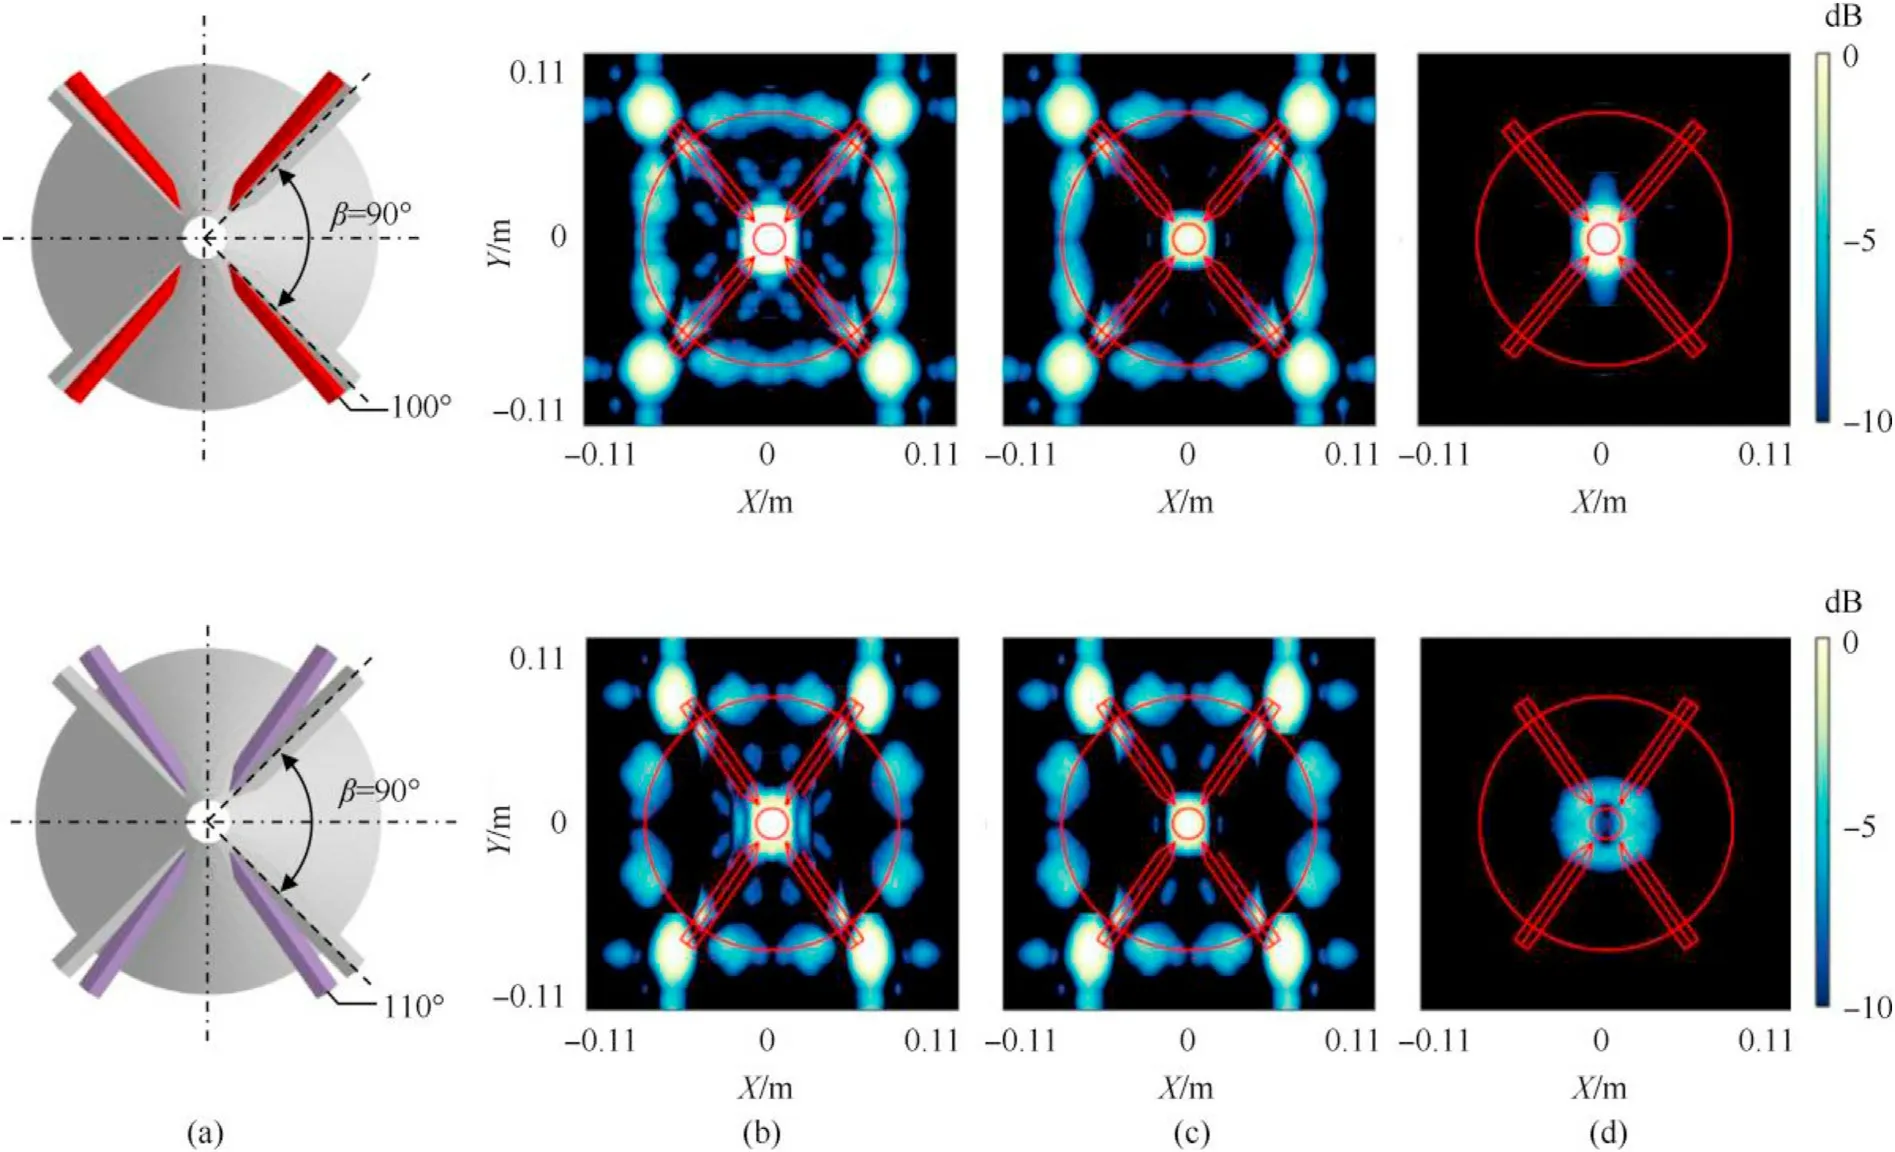
Fig.20.(a) Layout comparison of stern with orthogonal and non-orthogonal X rudders.CSAS images of non-orthogonal X-rudder stern generated from IPA simulations corresponding to the (b) total,(c) zeroth-,(d) first-order scattering.Two cases for β=100° and 110° are shown in the top and bottom panels,respectively.
5.Conclusions
This study proposes an IPA-based method to calculate the multiple scattered fields of a rigid concave target with an arbitrary shape.Two approximate analytic formulae with precise physical meanings are derived to predict a concave target's TS and CSAS images,including multiple scattering effects.Multiple scattering is accounted for by coherently summing the contributions of both triangular facets making up the target's surface and successive iterations of surface pressures until an acceptable convergence accuracy.No restrictions on the curvature of the target’s surface and the orders of multiple scattering are made.The proposed method shows excellent agreement with FEM by taking an example of a rigid concave spherical segment.
On this basis,we can simulate the TS and CSAS images of an Xrudder UUV model,including the multiple scattering effects through IPA simulations.Again,we validate the accuracy of the numerical modeling by conducting an acoustic scattering experiment of an X-rudder stern.Its essential conclusions are as follows.
(1) At a high-frequency range,TS has a broad bright feature corresponding to multiple scattering from the X-rudder UUV for 74°<θ <88°.However,it becomes relatively narrower with increasing frequency.In the vicinity of θ=80°,TS of the first-order scattering is from 10 to 20 dB above that of the zeroth-order scattering.These results show that modeling multiple scattering is indispensable to achieving accurate results.In other words,the Kirchhoff approximation would be more robust when incorporated into the multiple scattering mechanisms.
(2) CSAS images show the projection of the UUV’s geometrical shape associated with direct scattering as well as the brighter highlights of multiple acoustic scattering from its X-rudder stern on the imaging plane.The latter appear at close range and are focused near the stern.They may provide distinctive features for active sonar detection and target identification.
(3) Multiple scattering effects of the stern are sensitive to the adjacent rudders’ angle.Hence,the X-rudder structure clearly visible in the image of β=90°is absent or highly suppressed in the images of the others.These results may provide a design basis for the shape of an X rudder with a better acoustic stealth performance.
(4) By comparing the simulated and experimental results,we can again affirm the multiple scattering contribution of an Xrudder stern,which generates the broad ring feature around the center of the stern on the CSAS image.Results show that the IPA is well implemented.
Declaration of competing interest
The authors declare that they have no known competing financial interests or personal relationships that could have appeared to influence the work reported in this paper.
Acknowledgments
This work was supported by the National Youth Science Foundation of China(Grant No.52001211).The data was obtained with the help of Yefeng Tang.We wish to thank the reviewers for their constructive and helpful comments.
杂志排行

Defence Technology的其它文章
- Deep hybrid: Multi-graph neural network collaboration for hyperspectral image classification
- Mesoscale study on explosion-induced formation and thermochemical response of PTFE/Al granular jet
- A new Ignition-Growth reaction rate model for shock initiation
- Effect of interface behaviour on damage and instability of PBX under combined tension-shear loading
- Sensitivity analysis and probability modelling of the structural response of a single-layer reticulated dome subjected to an external blast loading
- Tailoring conductive network Zn@NPC@MWCNTs nanocomposites derived from ZIF-8 as high-performance electromagnetic absorber for the whole X-Band