Maintenance Strategy of Multi-Component System Due to Degradation and Shock
2023-05-20YijieChenandJianTian
Yijie Chen and Jian Tian
(Basic Department, Software Engineering Institute of Guangzhou, Guangzhou 510900, Guangdong, China)
Abstract:The proposed maintenance strategy uses component grades and survival signature to describe and update system structure.A system dynamic stress-strength reliability(SSR)model was established to describe component failure processes because of internal degradation and external shock.Besides, a corrective maintenance rule and two-level preventive maintenance rule made up the proposed maintenance strategy.The former combined sequentially minimal repair and corrective replacement(SMRCR)based on system structure updating.The latter considered group importance measure based on the system dynamic SSR and preventive maintenance cost.Further, a cost model was developed by the proposed strategy, and the optimal decision variables were found by genetic algorithm.Finally, using a case system to illustrate the above strategy improved system and reduced maintenance costs.
Keywords:survival signature; system structure updating; system dynamic stress-strength reliability; group importance measure
0 Introduction
In a complex system, there are three common types of dependencies: economic dependence, stochastic dependence and structural dependence[1].Initially, economic dependence was widely considered in maintenance strategies, while the other two dependencies were rarely mentioned.In these years, Birnbaum importance measure is introduced to effectively consider the system structure, but it does not take the influence of maintenance group into consideration[2-3].To solve it, a group improvement factor was proposed to formulate a multi-level predictive maintenance[4].But it did not provide a specific corrective maintenance(CM)rule for component failure.So Ref.[5]proposed an SMRCR rule, but it does not consider component failure accelerates the degradation of other components, i.e., stochastic dependence[2].Gradually, different maintenance strategies were formulated for the degradation processes and degradation state-rate interactions of components[6-7].Further,Refs.[8-9]proposed degradation-threshold-shock(DTS)models and stress-strength models(SSM)based on degradation and shock.For the DTS models, the effects of degradation and shocks have been analyzed and different maintenance strategies have been formulated[10-12].For the SSM, a large number of research results on reliability have appeared based on two different situations.First, when stress and strength are not related, Ref.[13]estimates stress-strength reliability(SSR)and both stress and strength obey gamma distribution; Ref.[14]estimates SSR when both stress and strength follow exponential Weibull distribution.Second, when stress and strength are related, Ref.[15]analyzes a component SSR based on a general two-dimensional distribution; Ref.[16]uses the copula function to describe the dependence between strength and stress and establishes a dependent SSM.However, the above research based on SSM is limited to single-component systems and rarely used for reliability modeling of complex systems.
In response to the above problems, based on Ref.[4], an improved maintenance strategy is proposed.Firstly, system structure is described by component grades and is updated by survival signature.Secondly, considering degradation and shock, SSM and survival signature are introduced to establish a dynamic SSR.Moreover, using group importance measure designed by system dynamic SSR and PM cost, a two-level preventive maintenance(PM)rule is formulated.Finally, a corresponding maintenance strategy model is established, which is optimized by using simulation and genetic algorithm(GA).Further, using a numerical example, this study demonstrates that the developed strategy is useful and effective.
1 System Reliability Modeling
1.1 System Description
K(K≥2)types ofncomponents make up a monotonous and coherent system.At initial moment, the system works normally and its components are all new.Let all components status vector bex=(x1,x2,L,xn)∈{0,1}n.xi=1 indicates thei-th component is in working status.Defineφ=φ(x):{0,1}n→{0,1} as system structure function.φ(x)=1 indicates the system works normally in view ofx.Survival signature is introduced to defined system survival probability, which is rewritten as[17]
(1)
wheremkis typekcomponent number,lkis the number of typekcomponents that work normally withk=1,2,L,K, andSl1,l2,L,lKis the set of the status vector of components.A 10-component system is used to explain how the survival signature is used.Refer to Appendix for detailed explanation.
As the change of the component status affects the grades of the system component and ultimately affects the system structure, the four component grades defined in Ref.[5]is used to represent the system structure.The set of the four component grades are critical component set(CCS), temporary critical component set(TCS), failed component set(FLS)and non-critical idle component set(NCIS), respectively.Among the four component grades, the component in CCS will be repaired immediately after failure and the maintenance time is negligible, so it is considered that the components in the grade will not be transferred to other grades.To better exhibit the mutual transformation relationship of the other three component grades, the paper discusses the failure of any componentiin the three component grades at timet(Fig.1).t+is the time just after timet.Refer to Section 2.1 for detailed description of Fig.1.
1.2 Degradation and Shock Modeling of System
Ref.[8]proposes an SSM for components due to degradation and shock.In the SSM, component strength and component stress are two random variables.Component strength refers to the inherent strength for component itself and component stress refers to the external shock, which are denoted byXandY, respectively.At this point, the dynamic SSR of system or component is defined as the strength greater than the stress, and its mathematical expression is as follows:
R=P(X>Y)
(2)
Eq.(2)reflects the possibility(probability)that the system or component can fully perform their intended function when they work under specified environmental conditions.However, in the field of engineering systems, the strength of some components and systems may deteriorate with time under random stress(such as corrosion, aging, etc.), and the effect of random stress on components and systems may be a cumulative process.So, it is very important to study the multi-system dynamic SSR.The following are the basic assumptions:
1)The initial strengthXand random stressYof the component obey the exponential distribution with parametersαandβ, respectively;
2)System components only bear one kind of random stress;
3)Each time a component is subjected to stresses, its strength will degrade bybunits andb=0.4.So, when the component is subjected tojcycles of stressYj=Y, its corresponding strength isXj=X-jb, andj=1,2,L.
4)In interval(0,t], the random stress arrival numberN(t)acting on the system obeys Poisson distribution with the parametert/u,u=0.2 is a parameter that number of random stress cycles obey the Poisson distribution.
Based on above assumptions, the cumulative distribution functions(CDF)of related variables are obtained:
FX(x′)=1-exp(-αx′),x′>0
(3)
FY(y)=1-exp(-βy),y>0
(4)
(5)
wherex′ is an arbitrary real number,yis also an arbitrary real number.
Theorem1LetTsysbe the life of the system, then the system dynamic SSR expression at timeTsys=tis

(6)
ProofLetT'be the life of the component,σj(y)indicates an event that the component has not failed afterjcycles of fixed stressY=y.So the reliability of the component after bearing fixed stress ofjth cycle is
ri=P(σ1(y)∩σ2(y)∩L∩σj(y))=
P(X-jb>Y)=P(X>jb+y)=
exp(-α(y+jb))
(7)
WhenYis unknown, the reliability of the component after bearing random stress ofjth cycle is

(8)
Combining Eq.(5), component SSR at timeT′=tcan be obtained, namely,

(9)
Using Eq.(9)can calculate the SSR of the typekcomponents at timeT′=t, namely,
(10)
In a monotonous and coherent system,survival signature can be used to describe the working status of the system, and the system structure can be separated from the probability model that describes component random failure.So, survival signature is widely used to calculate the system reliability, i.e.,

(11)
Based on Eq.(1)and Eqs.(10)-(11), the system dynamics SSR at timeTsys=tcan be obtained, namely,
(12)
The proof is completed.
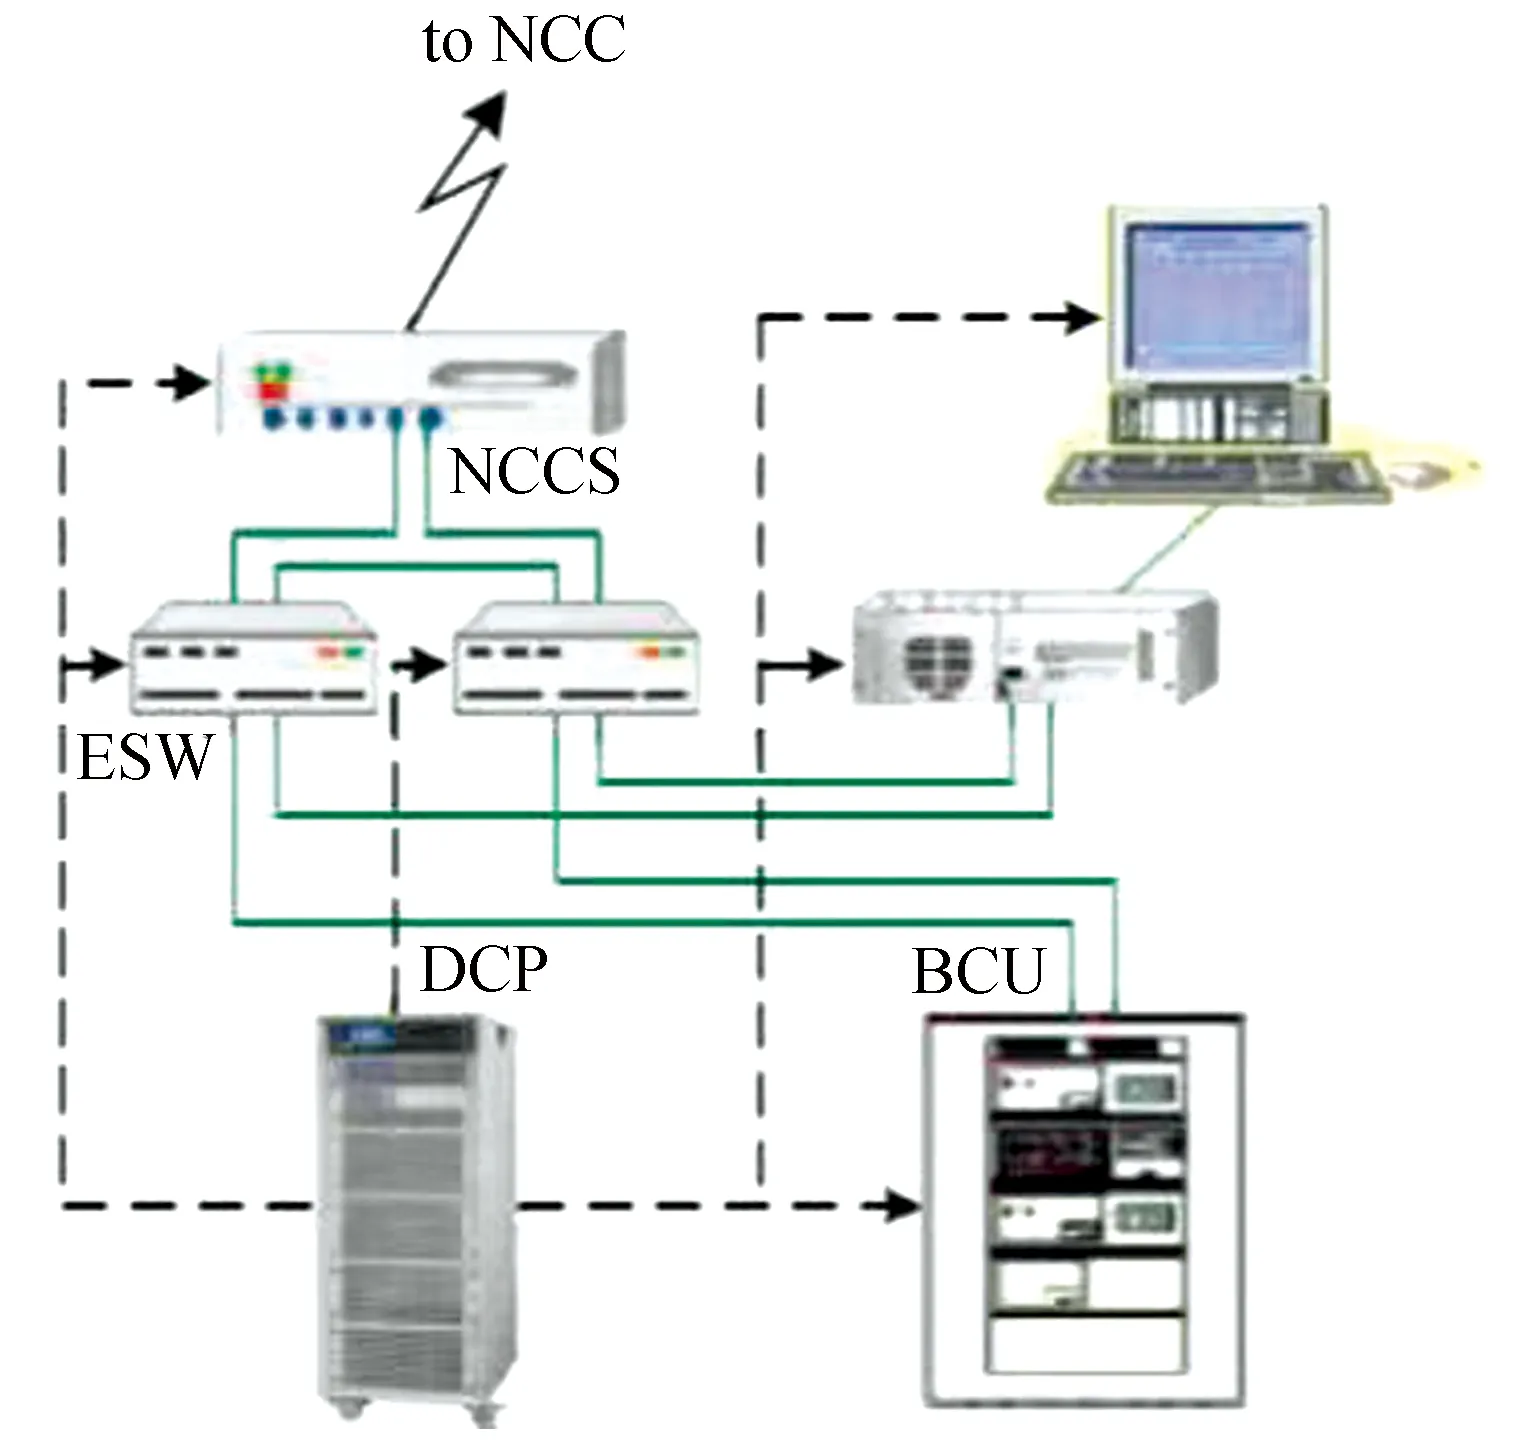
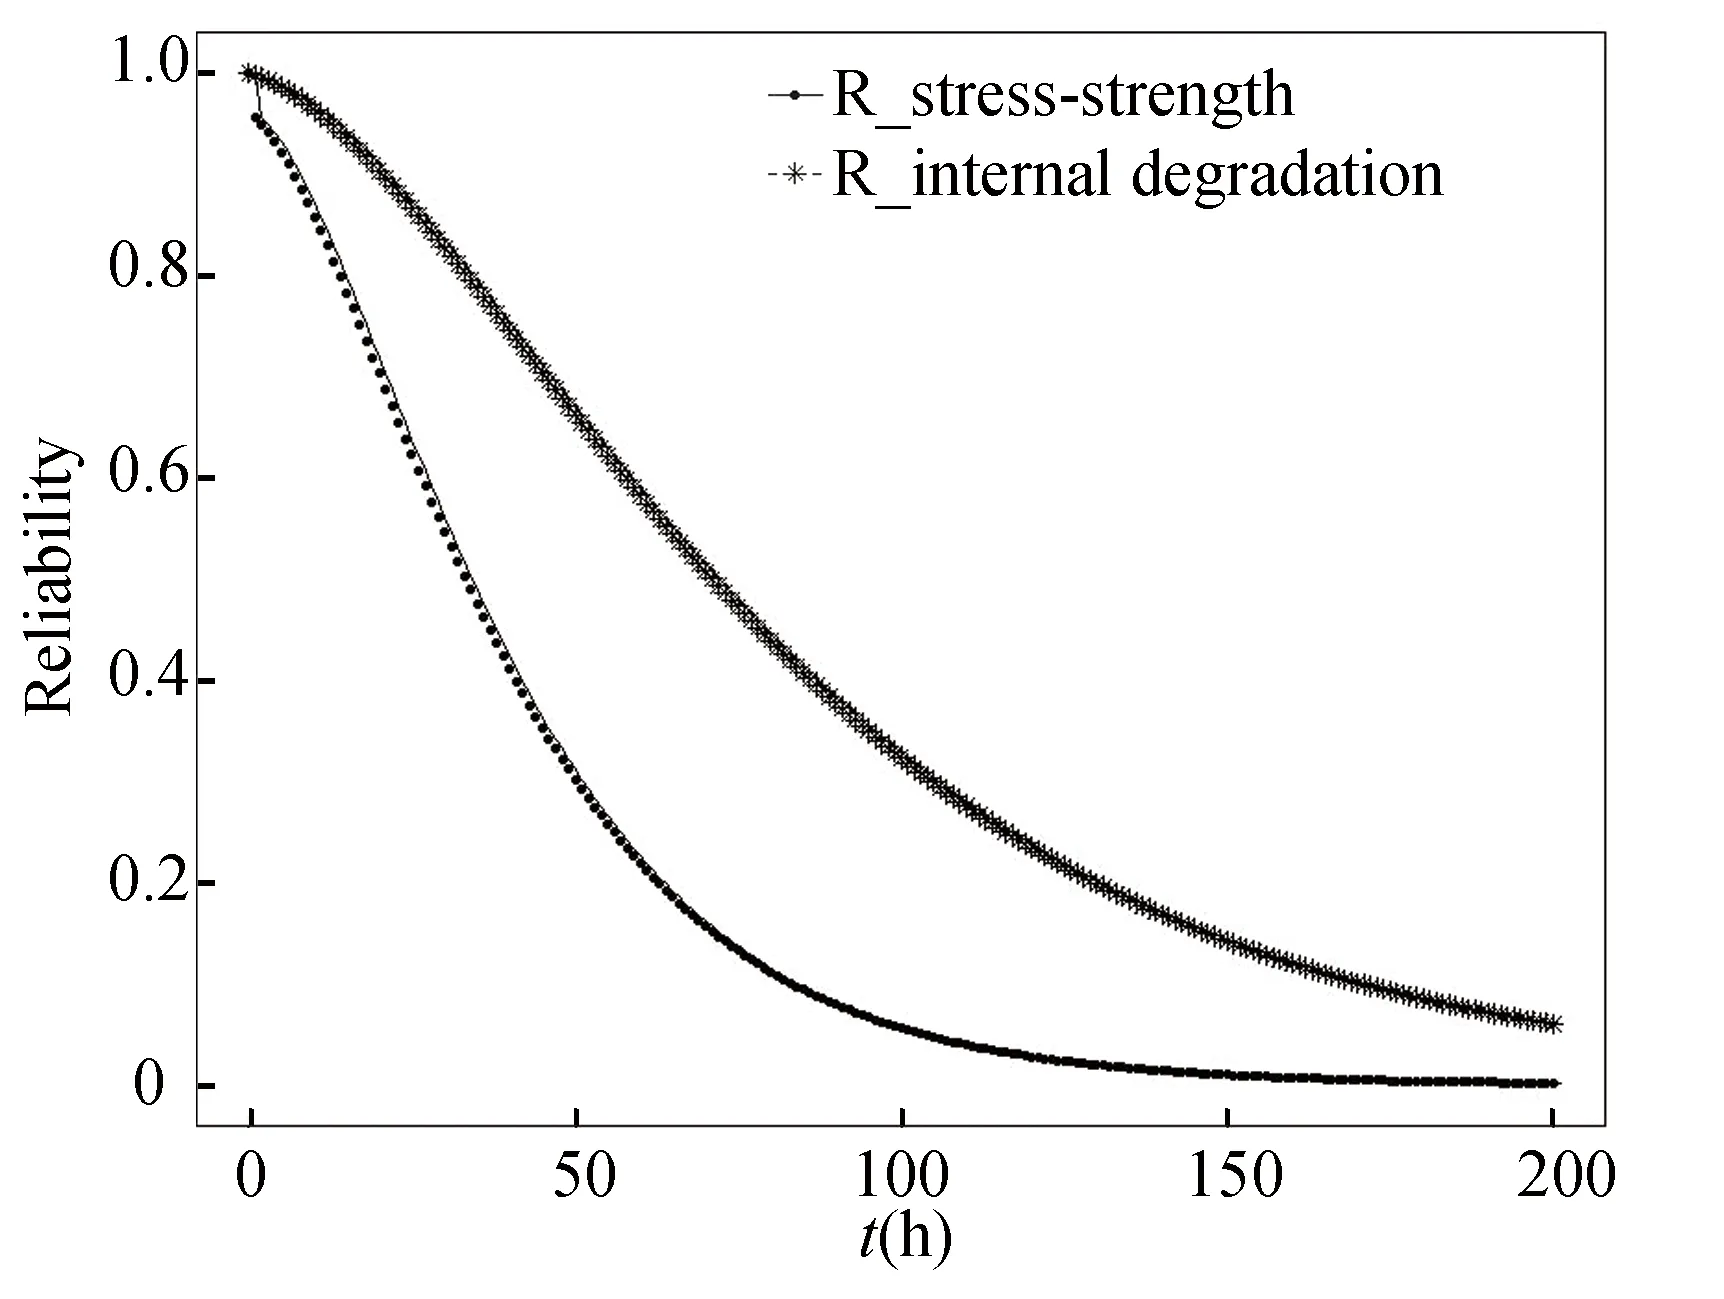
The following takes the substation system[18]as an exampleto analyze the system dynamic SSR by comparing it with the system reliability that only considers the internal degradation of the components.Their topology and configuration are given, as shown in Fig.2 and Fig.3.The substation system relevant data are listed in Table 1.

Table 1 Substation system parameter data

Fig.2 Topology of a substation system

Fig.3 Reliability block diagram of substation system
The calculating result of the two system reliabilities are shown in Fig.4.The results indicate both system reliabilities decrease with time, but the system dynamic SSR decreases faster, because for the system dynamic SSR, it takes into account internal degradation and external shock.Obviously, the results are realistic.

Fig.4 Comparison of system reliability
Fig.5 and Fig.6 show sensitivity analysis result with parametersbandu, respectively.Fig.5 shows whenbincreases, the system dynamic SSR also increases.Because the larger the value ofb, the larger the degree of strength degradation becomes, and ultimately the smaller the system survival probability becomes.Fig.6 shows whenuincreases, the system dynamic SSR decreases.Because whenuincreases, the arrival frequency of external shock is reduced, which makes the number of the component subjected to external shock reduce.

Fig.5 Sensitivity analysis of b

Fig.6 Sensitivity analysis of u
The analysis indicates that it is meaningful to establish the system dynamic SSR.The following applies the dynamic SSR to system maintenance strategy.To simplify the subsequent related model, the following assumptions are made:
1)At a certain moment, only one component fails;
2)Preventive maintenance and corrective replacement are the replacement of an original component with a brand new one, while minimal repair is the repair of the original faulty component;
3)Maintenance durations of system components are 0;
4)Necessary maintenance resources are always available.
2 Maintenance Strategy
Internal degradation and external shock will cause system component failure, which affects the system structure.So, an SMRCR is formulated.In addition, to reduce maintenance cost, a preventive maintenance rule is formulated considering the group importance measure.
2.1 System Structure Updating
LetStru(t0)be system structure at timet0.The dependency relationship of system structure and component grade sets is given at timet0, namely,
Stru(t)=[CCS(t),TCS(t),NCIS(t),
FLS(t)]
(13)
Based on Eq.(13), a component failure leads to component grade updating, which ultimately leads to system structure updating.Next, the system structure updating process with component failure is given based on Fig.1.
Firstly, a status-survival matrix is defined based on the survival signature at timet0, i.e.,
Mat(i,t0)=(Sl1,l2,L,lKΦ(l1,L,lK))x=(x1,L,0i,L,xn)
(14)
Mat(i,t0)reflects the status vector when componentifails at timet0.Then, a function is defined as follows:
(15)


(16)
wheren0[i]is the number of consecutive minimal repair of componenti.Let SE(tfw)be a set of failed components, and when any component in SE(tfw)is restored to working status, the failed system can be restored to working status at timetfw.


(17)
2.2 SMRCR rule
Minimal repair(MR)reduces cost and corrective replacement(CR)improves system reliability.Considering their advantages, this subsection proposes an SMRCR rule by updating system structure.When componentwfails at timetfw, three cases are discussed:


2.3 Group Importance Measure Based on System Dynamics SSR
In the existing PM rules, it is rare to take into account the importance measure of several components together.So group importance measure is designed as follows:
(18)
where

(19)
For the typekcomponents outside groupGz, their SSR are obtained based on Eq.(10), i.e.,
(20)

2)CGzis PM cost forGz.
(21)
whereI{ }is an indicator function.I{ }=1 if { } is true andI{ }=0 if not.Gzis defined as a critical group when the failures of one or more components inGzcause system failure.cs(|Gz|-1)is set-up cost saving because of positive economic dependence(PED)between components.

is planned shutdown cost saving owing toGz.
2.4 Two-Level PM rule
A two-level PM rule is executed at timeTr=rT,r=1,2,L, which considers group importance measure.The two-level includes system level and component level.
2.4.1Systemlevel
2.4.2Componentlevel

(22)
2.5 Maintenance Strategy Model
Based on the proposed maintenance strategy, cost-rate is defined as follows[3]:
(23)


(24)

(25)


(26)

(27)
Consequently, from Eqs.(23)-(27), CR(T,R0)is calculated.Finally, by minimising cost-rate, the optimal values(T,R0)is found, i.e.,
(28)


(29)

3 Numerical Example
This section takes the substation system of Fig.2 as an example to optimize and evaluate the proposed strategy.Finally, the paper analyses parameter sensitivity.The relevant cost parameters are listed in Table 2.

Table 2 Substation system relevant cost parameters
3.1 Optimization of Maintenance Strategy Model
The maintenance strategy model in Section 2.5 is very complex, so the strategy is optimized by simulation analysis and GA[3].
Firstly, to prove the convergence of the cost-rate, a simulation-analysis method is used by supposingT=40 andR0=0.6.To eliminate the chance of the simulation results and make it more convincing, the simulation is repeated five times.The result is shown in Fig.7.It shows when the planned maintenance period number is big enough, five curve difference is small enough.So, it can infer the cost-rate is convergent when planned maintenance period number is big enough.

Fig.7 Cost-rate convergence based on proposed strategy

3.2 Optimal Strategy Evaluation
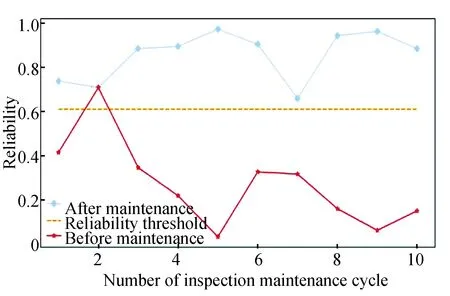
Optimal strategy is evaluated based on system reliability and maintenance cost.


Fig.8 System reliability before and after maintenance
Then, to verify the impact of the optimal maintenance strategy on maintenance cost, it is compared with another strategy[4].Finally, the cost-rate analysis result is shown in Table 3.It shows the proposed strategy cost-rate is smaller than comparative strategy cost-rate.Because proposed strategy optimal PM maintenance period is less than that of the comparison strategy and the proposed strategy optimal reliability threshold is larger than that of the comparison strategy, this makes PM activities in the comparison strategy frequently executed.Finally, comparison result shows the proposed strategy can reduce maintenance costs by

Table 3 Cost analysis of different strategies
3.3 Sensitivity Analysis


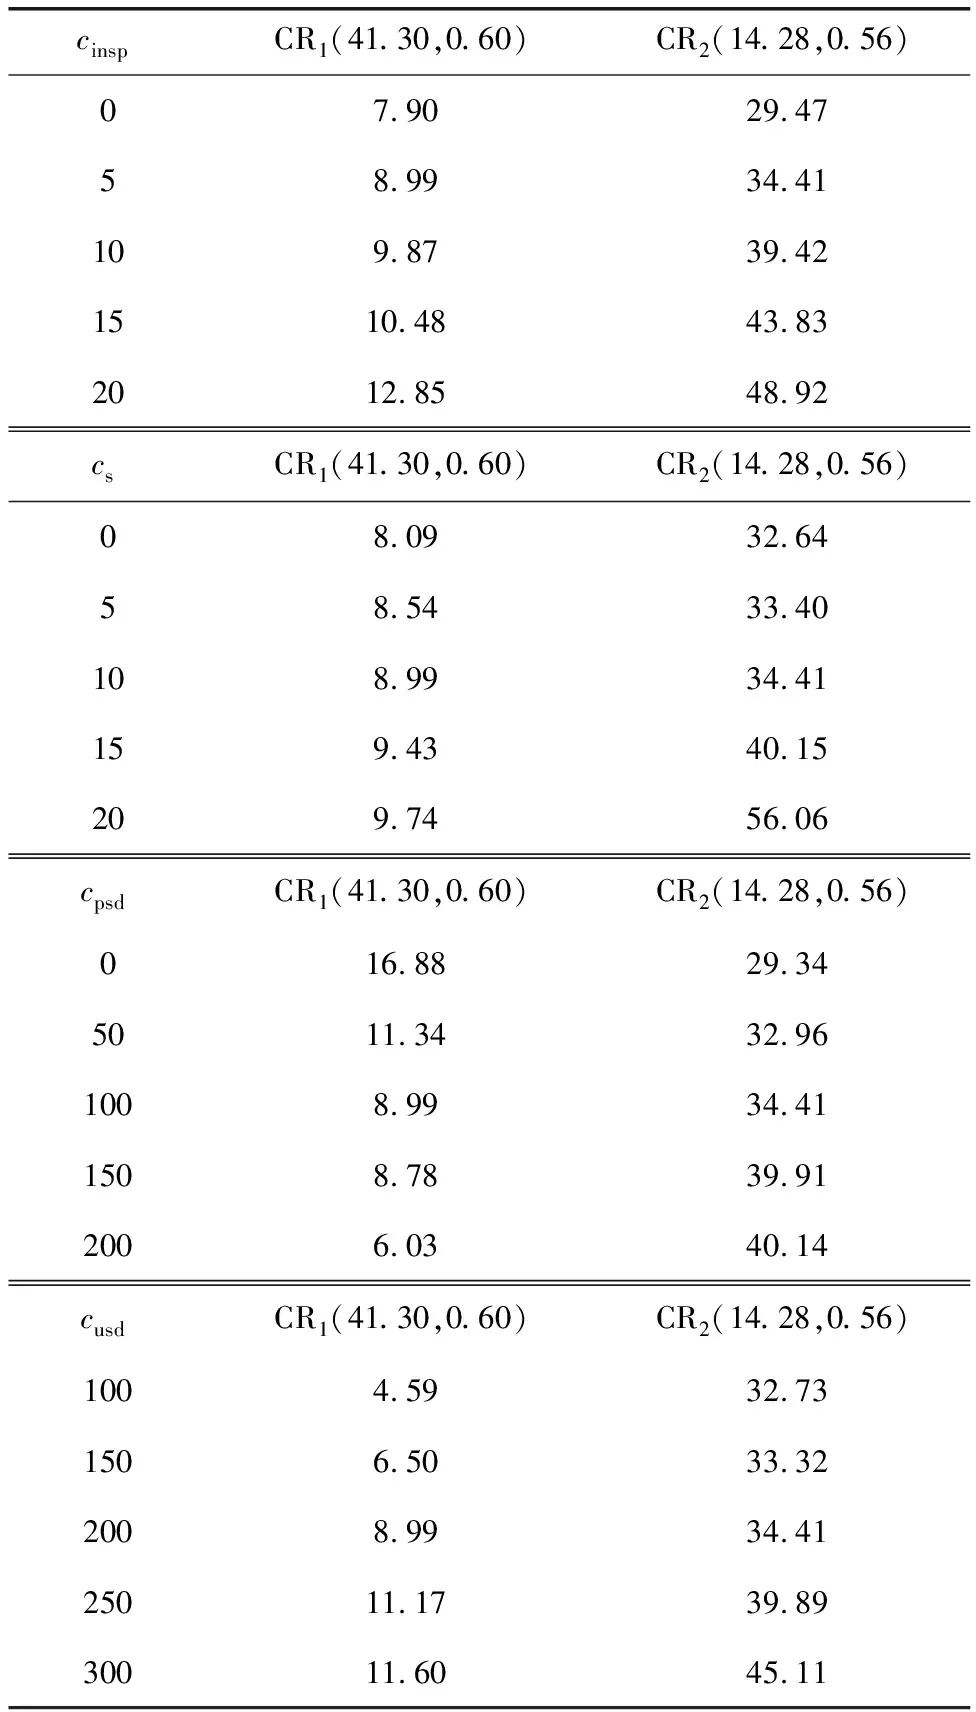
Table 4 Sensitivity analysis of cost parameters
1)cinspranges from 0 to 20 with 5 cost unit increments while other parameters remain unchanged.Whencinspis higher, cost-rate is higher.However, the proposed strategy cost-rate is always lower than comparative strategy cost-rate.So,cinspis positively related with two maintenance strategies, respectively.
2)csranges from 0 to 20 with 5 cost unit increments while other parameters remain unchanged.Whencsincreases, cost-rate from two strategies also increases, but comparative strategy increases relatively faster.This is because in the optimal PM period, the comparison strategy is relatively small, so that the comparative strategy must frequently execute PM, and ultimately the cost-rate increases relatively quickly.
3)cpsdranges from 0 to 200 with 50 cost unit increments while other parameters remain unchanged.Based on Eq.(21),cpsdis saved maintenance cost owing to groupGz, which is positive or negative value.Obviously, the cost-rate saved bycpsdis a positive value for the proposed strategy, but the cost-rate saved bycpsdis a negative value for the comparative strategy.In other words,cpsdis positively related to the comparative strategy and is negatively related to the proposed strategy.
4)cusdranges from 100 to 300 with 50 cost unit increments while other parameters remain unchanged.Whencusdis higher, maintenance cost-rate is higher.So,cusdis positively related to two maintenance strategies, respectively.
4 Conclusions
Firstly, the proposed maintenance strategy introduces a stress-strength model to depict component failure process because of internal degradation and external shock, and the system dynamic SSR is obtained in combination with the survival signature.Compared with the system reliability based on internal degradation, the system dynamic SSR is more realistic.Then, applying system dynamic SSR to system maintenance, an SMRCR rule considering the system structure updating and a two-level PM rule considering the group importance are formulated.Finally, using numerical example shows that the proposed maintenance strategy can effectively increase system reliability and reduces maintenance cost by 73.87%.
Appendix
To better illustrate survival signature definition, this section takes the 10-component system shown in Fig.A1 as an example for detailed explanation, in which components “1” and “2” belong to the same type 1, and components “3”, “4” and “9” belong to type 2, components “5” and “10” belong to type 3, and components “6”, “7” and “8” belong to type 4.The results of the survival probability of the system are shown in Table A1, in which all rows with survival probability 0 and 1 in the table are deleted.

Fig.A1 10-component system reliability block diagram
Takel1=2,l2=1,l3=0,l4=2 as examples to explain the results in Table A1.This situation indicates that two components of type 1 are all working properly, a component of three components of type 2 is working normally, two components of type 3 are faulty, two components of three components of type 4 are in normal operation.At this time, all possible results of the component state vector are

Table A1 10-component system survival signature
so
In the 9 possible results, there are only two combinations that components “1”, “2”, “3”, “6”, “8” and components “1”, “2”, “3”, “7”, “8” are all working properly to make the system work, i.e.,
Finally, the result is
杂志排行
Journal of Harbin Institute of Technology(New Series)的其它文章
- Application of Optical Visualization Method in Observing Flow Field Around a Cylinder
- Review: Measurement-Based Monitoring and Fault Identification in Centrifugal Pumps
- Two-Dimensional Images of Current and Active Power Signals for Elevator Condition Recognition
- Spray Characteristics of Non-Circular Nozzle in Air-Assisted Injection System
- Optimization of AWJM Process Parameters on 3D-Printed Onyx-Glass Fiber Hybrid Composite
- Earthquake Emergency Response System of High-speed Railway by Least Square Method
