Application of Optical Visualization Method in Observing Flow Field Around a Cylinder
2023-05-20HongboWangandChaoheChen
Hongbo Wangand Chaohe Chen
(1.Naval Architecture and Ocean Engineering R & D Centre of Guangdong Province, South China University of Technology, Guangzhou 510641, China; 2.School of Civil Engineering and Transportation, South China University of Technology, Guangzhou 510641, China)
Abstract:In this paper, a free-surface synthetic schlieren(FS-SS)method was performed to detect the free surface disturbances.It is a purely optical method that uses refraction of light to reconstruct the height changes of water surface.The theory was developed based on Moisy’s research, but has mainly been used in small-scale applications like painting and coating industry.Based on the methods and theories of the literature review, an in-depth investigation was conducted to optimize the FS-SS method and verify its feasibility on a relatively large-scale(e.g., wake region of shallow flow).The experimental setup was simplified which is approachable in most laboratories.Through proper experimental setting and an optimized post-processing routine, the quality of image was highly improved and ensured the accuracy of results.A drop test was performed proving the continuity of FS-SS method in the time domain.Also, a comparison test with flow around a cylinder at two speeds showed the ability of FS-SS method to reconstruct the irregular water surface in relative large-scale flow structures.
Keywords:FS-SS; flow around cylinder; water height detection
0 Introduction
Tidal energy is a form of hydroelectric power that harnesses the elevation changes of the semi-diurnal tides.It is a clean and renewable energy source and, like wind energy, can be captured with turbines.Typically, turbines are installed behind the sluice gate of tidal lagoons to harness tidal energy while protecting the local environment.Tidal stream is created by controlling the sluice gate.The application of tidal lagoons was first developed in Swansea Bay and Severn Estuary in Cardiff, as the west coast of the UK has one of the largest tidal ranges in the world[1].
The flow field around the sluice gates deserves attention because this type of flow structure can not only affect the living conditions of the inhabitants but transport large amounts of sediment, and may increase the risk of flooding.As the scale of tidal lagoon becomes larger, more effective visualization methods need to be developed to monitor the tidal lagoon flow field.
The traditional method to observe wavefields is to place probes at discrete locations, by which only one-dimensional data will be collected, so it is difficult to make connections and visualize the entire field.In addition, equipment setup of this method is complex and expensive.The invasion of the probes will also affect the flow field and the accuracy of the results.However, the free-surface synthetic schlieren(FS-SS)can solve these problems.Although this technique is still in the research stage, its application in the tidal energy industry will be very promising.
FS-SS is a purely optical method and mainly uses the refraction of light to detect the free surface disturbances.It is a new research method for reconstructing the water surface, but the study of surface slope measurements began in the mid-20th century by Cox[2]and Zhang[3].The basic principles of the FS-SS method were developed in 1998 by Torczynski et al.[4], who used an array of microlenses with a diameter of 200 μm that acted as a random dot pattern.Instead of collimated light, other researchers used a scattered light source[5].In 2009, the now-standard FS-SS method was first officially used by Moisy for density-varying fluids[6].Compared with the traditional collimated light method, FS-SS method has many advantages as it does not require complex optical setup and careful calibration procedures.
Studies with similar principles of FS-SS method have been performed in recent years.In 2018, Engelen et al.[7]presented an image-based reconstruction technique, which also uses the light of refraction.A sub-millimeter accuracy can be reached for steady surface shapes, but is suffered from highly dynamic flows.Li et al.[8]used a single-camera synthetic schlieren to make measurement of free liquid surface without the need of knowing the height.
This paper optimized the process of the FS-SS method, and its feasibility for irregular surface shapes like flow around a cylinder was analyzed.As the wake region are well known, it could bring more confidence when compared with developed numerical models or published 1D experimental results in the future.The experimental setup was further simplified to better suit the actual application.Correspondingly, a post-processing routine was developed in this paper to effectively improve the image quality and accuracy of results by eliminating uneven distributed illuminations and possible noise.Drop test was also performed to check the continuity of the FS-SS method in time-resolved analysis by comparing the phase velocity of the main circular wave.
1 Methodology
1.1 FS-SS Method
FS-SS is a branch of the particle image velocimetry(PIV)method.Unlike PIV, which uses laser beams to track the motion of pulsed particles.FS-SS is a purely optical method and mainly uses the refraction of light to measure the free surface disturbances.After applying a digital image correlation(DIC)algorithm, it can detect the displacement field between the refracted image when the surface is randomly deformed and a reference image when the surface is flat.Then, a least square inversion of the gradient operator is used to reconstruct the water surface.FS-SS method has the advantage of not affecting the original flow field and can make 2D measurements.Also, it is able to provide relatively high spatial resolution with low computational cost.The most common configuration for positioning the pattern, fluid and camera is to set the camera directly above the water surface and the pattern below.The schematic diagram can be found in Fig.1.

Fig.1 Schematic diagram of FS-SS method for flat and random deformed interfaces
In Fig.1, arrows represent the path of light ray and a cartesian frame is established with the vertical optical axiszcrossing the originOand cameraC.Pattern is placed atxyplane.Dis the diaphragm diameter of the camera,βis the paraxial angle,iis the incident angle,His the pattern-camera distance andhpis the pattern-surface distance.M′,B′ ,M″ andB″ are virtual points corresponding to the original pointM.
There are two computational procedures in the FS-SS method.In the first step, the digital image correlation(DIC)algorithm is used to compute the displacement fieldδr, which can be derived by determining the position of the virtual pointM′ with the flat interface andM″ with the deformed interface.The second step uses a least square inversion of the gradient operator to find a relationship between the displacement fieldδrand the surface gradient ∇h.
Based on the law of refraction and suitable approximations(paraxial approximation, weak slope approximation, and weak amplitude approximation; details are explained in Section 2.1), the key equation linking the displacement fieldδrand the surface gradient ∇hcould be established, whereh*is the reference height(Eq.(1)).It shows that the displacement is simply proportional to the surface gradient when the paraxial angleβ, the surface gradient ∇hand the relative surface deformation are of first order.

(1)
whereδris the displacement field,αis the coefficient of height of virtual pointB′ and is defined as 1-n/n′,nandn′ are corresponding coefficients of refraction, the value ofαroughly equals to 0.24 for an air-water interface,hpis the pattern-surface distance, andHis the pattern-camera distance.
In the paraxial approximation and real practice, the pattern-camera distanceHis much larger than the field sizeLand also the height of virtual point,αhp, so 1/His much smaller than 1/αhp.Hence,h*can be simplified asαhp.
1.2 Toolbox OpenPIV and PIVMat
In this paper, two toolboxes were chosen for computation.One is the OpenPIV developed by Taylor et al.[9], and the other is PIVMat developed by Moisy.OpenPIV is used to generate displacement fields of dot pattern based on the loaded image.The main function of PIVMat is to reconstruct the water surface by applying the DIC algorithm.
The output of OpenPIV contains three lists of files, two text files and one file in the form of ‘vec’.This paper focuses on the data in ‘txt’ format.The output text file contains five columns of data, the coordinates ofxandy, the velocity inxandydirections, the signal to noise ratio and the size of the PIV field.The velocity given by output file is not the velocity of the flow, but the displacement field of the detected moving random dot pattern divided by the time step of each frame.With suitable modifications, the output file from OpenPIV can be imported into PIVmat and converted into required structural data.
PIVMat is a PIV post-processing and data analysis toolbox.PIVMat contains a set of command-line functions for importing, post-processing, and analyzing vector fields from PIV techniques such as stereo PIV, DIC, synthetic schlieren(SS), or background-oriented schlieren(BOS).In this paper, the least-square interpolation function named ‘surfheight’ is mainly used to reconstruct the water surface based on the ‘velocity’ field obtained from OpenPIV.The running speed of the PIVMat toolbox could be optimized by vectorization applied directly to arrays of fields.
2 Experiment Setup
2.1 Optical Configuration
According to Moisy’s theory, three approximations must be made for the standard FS-SS method, and the three approximations depend mainly on three parameters, the paraxial angleβ, the surface slopeγand its relative surface deformation.
The first one is the paraxial approximation.It defines that the pattern-camera distance is much larger than the field size, leading to a maximum paraxial angle.
(2)
whereβis the paraxial angle,Lis the field size,His the pattern-camera distance.

The third is the weak amplitude approximation.The surface heighthcan be expressed as follows:
h(x,y)=hp+η(x,y)
(3)
where amplitude|η|should be small compared with the mean heighthp.
Considering the frame size and camera resolution, pattern-camera distance was set as 592 mm.The screen size was 424 mm×237 mm, and a linear 720 p mode was selected for the camera.After calculation, the paraxial angle was 0.5064 and 0.2835 respectively, which satisfied the paraxial approximation.Approximation 2 and 3 were achieved by controlling the flow speed.When the water flows around the cylinder, the slope and amplitude of the induced wave became small enough, especially in the wake region.In addition to the above approximations, there was a constraint to be avoided called the invertibility condition(IC).It stated that the focal length associated with the surface curvature of the camera should be greater than the distance between the pattern and the surface.If this condition could not be satisfied, ray-crossing and caustics would occur when the surface curvature or water depth was large.The necessary condition to obtain an accurate displacement field based on the cross-correlation algorithm from the refracted image is that the image on the camera must come from the corresponding point of the pattern.If the light rays cross, this necessary condition cannot be satisfied.The scheme of ray crossing is shown in Fig.2.

Fig.2 Ray crossing induced by large curvature of the interface
To satisfy the condition of invertibility, the critical distancehp,cmust be defined.The crossing of rays can be avoided if Eq.(4)is satisfied.In this experiment, the water depth was controlled to be 30 mm to reduce the magnitude size of strain.
(4)
2.2 Water Tank
A water tank was used to build a recirculating system to produce a steady, shallow water flow.The schematic diagram is shown in Fig.3.There were three pipes which control the flow of water, namely inlet pipe, outlet pipe and pipe served for the recirculation system.The frame designed to settle the camera was 600 mm high and the actual distance between the pattern and the camera was 592 mm.Glass balls were designed to filter impurities and reduce air bubbles that could cause unnecessary vibration.A sluice gate at the end of the tank helped to regulate the water level.The circular cylinder was placed in a suitable location so that the wake area can be captured by the camera.
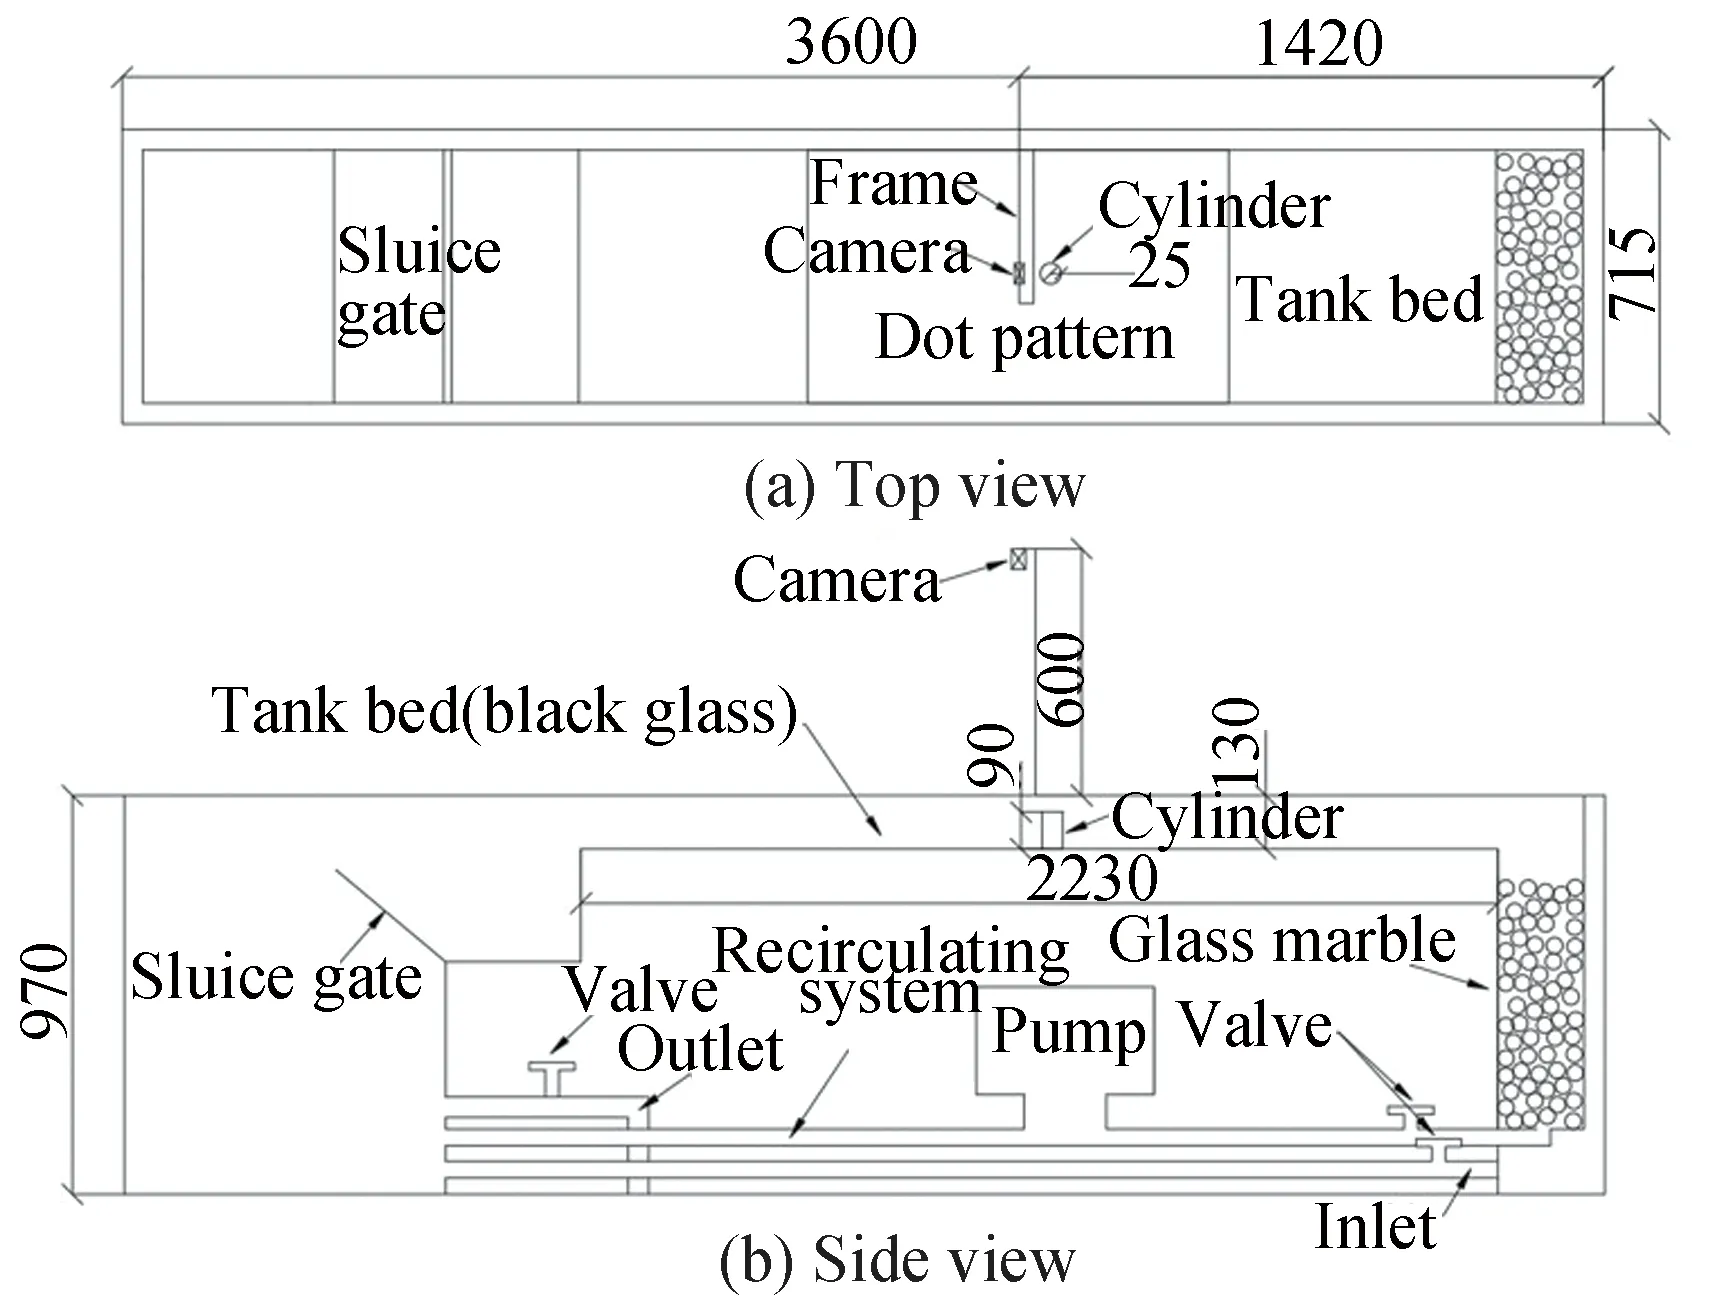
Fig.3 Top(a)and side(b)view of the water tank(mm)
2.3 Dot Pattern
The dot pattern played the role of a medium that provided the camera with information about the change in surface slope through the reflection and refraction of light.Different from the method used by Moisy[6], where the light source(light plate)is located below the dot pattern, an attempt was made in this paper to test the feasibility of external light sources(beyond the interface).
The intensity and diameter of dots should be carefully chosen to ensure that the displacement field can be unambiguously reconstructed by the DIC algorithm with high spatial resolution.Both the surface gradient and the camera resolution should be considered.Theoretically, the size of each dot should not be smaller than 1 pixel, otherwise the camera may have difficulty in detecting it correctly[10].Moreover, dots were randomly distributed to avoid occasional coincidences and reduce similarities in space.To match the camera used in this work, a pattern of 640000 dots with a diameter of 1 mm was created on A1 paper.
2.4 Camera
The experimental setup was simplified, so was the camera.In this article, the GoPro Hero 5 Black was chosen to capture the displacement of flow pattern and was proved fully competent for this task.The specifications of this camera in detail are shown in Table 1.

Table 1 Specifications of GoPro Hero 5 Black
The GoPro supports remote control, and also has a powerful anti-shake algorithm that can help reduce noise caused by vibration.In addition, the camera can be controlled by smartphones via WIFI.With the help of live preview and parameter settings, videos can be shot without touching the camera so vibrations can be further reduced.Since the frame rate in video mode can be up to 240 Hz, high-frequency waves can also be recorded.With the wide-angle lens, this camera can capture more information of field so that the behavior of the field can be captured from a more macroscopic view.GoPro provides several resolution options, but it does not mean that a higher resolution will lead to a better result.A higher resolution only means more information on the screen and a wider field of view.To find out which setting options can provide more detail for the interested area, several combinations were tested.A checkerboard was divided into 9 squares on thex-axis and 6 squares on they-axis.Each black and white square had a length of 25 mm.The checkerboard is shown in Fig.4.

Fig.4 Checkerboard used for correlation
Table 2 shows the number of pixels per square on the checkerboard collected by GoPro using different resolution.From Table 2, it can be seen that the last two setting combinations have the highest true resolution.However, for this experiment, the 720_240_narrow setting was chosen.The reason is that a higher frame rate is preferred to capture high frequency waves or eddies in the wake region.Also, using a narrow view instead of a wide view could help avoid the distortion effect.

Table 2 Actual resolution for different video settings of GoPro(mm)
2.5 Light Source
The light source is the prerequisite for the camera to receive the information about the displacement of the dot pattern.Since the light source is not a light plate below the dot pattern in Moisy’s method, the position of the external light source must be carefully determined to keep the brightness of the focused area as uniform as possible to avoid information loss.Contrast group was set which only used the laboratory’s illumination system, i.e., several modulator tubes on the ceiling.However, due to the paraxial angle of lightings, strong shadowing behind the obstacle and light reflections at the interface occurred, which can significantly affect the quality of the video.The second group added two additional light sources on each side of the water tank at a suitable oblique angle.The schematic diagram and captured image for the two contrast groups are shown in Fig.5 and Fig.6 respectively.

Fig.5 Schematic diagram of light source setting for two contrast groups
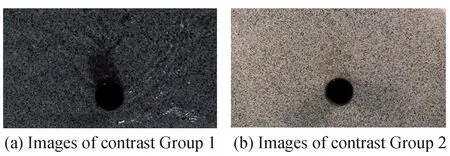
Fig.6 Images captured by camera for two contrast groups
3 Post Processing Analysis
3.1 Processing Routine
Post-processing is essential to the experiment, as it guarantees the accuracy and precision of the result.In order to recover as much information as possible from the raw data, an image processing routine was developed and tested.The entire process routine is shown in Fig.7.

Fig.7 Flow chart of the whole imaging process routine
At first, the raw video recorded by the camera was cut into frames with required time interval.Then, the images were calibrated to eliminate the optical distortions.In the next step, an adaptive adjusted algorithm based on the 2D gamma function was applied to balance the brightness of the image.The RGB images were then converted to grayscale for next steps.Noise and illumination effects can be eliminated by applying the minimum filter, mean filter and subtraction operations.The last step was to binarize the image by calculating a global threshold, which can facilitate the calculation of the movement of dot pattern applying the DIC algorithm.
3.2 Correlation of Lens Distortion
Due to the optical design of lenses, the experiment was subject to optical distortion, also called lens distortion, which resulted in deformation of the images.The wide-angle lens of the GoPro used in the experiment usually causes barrel distortion in the image.As shown in Fig.8, barrel distortion behaves as if straight lines are bending inward and looks like a barrel.The real reason for barrel distortion is that the field of view of the lens is much larger than the size of the image sensor, so it has to be squeezed to fit in.

Fig.8 Barrel distortion
Since FS-SS method focused on the displacement of tiny dots that are 1 mm in diameter.Lens distortion could lead to large inaccuracies and distort the reconstructed water surface.In this work, the camera calibrator in Matlab was used to obtain the lens distortion parameters for removing the distortion.
The checkerboard mentioned in Section 2.3 was again used for calibration to determine the relative position between the camera and checkerboard pattern.In this work, 48 calibration patterns were added to estimate the lens distortion parameters.The overall mean reprojection error was about 0.33 pixel, which was low enough to ensure accuracy.In addition to the narrow view mode, the fisheye effect of the camera was also considered.A series of images of the checkerboard pattern in wide-angle mode at 4 K resolution were also taken and added to the camera calibrator.From Fig.9, it can be seen that the mean error can be as high as 0.68 pixels.This proves that the wide-angle mode is unnecessary and can lead to larger uncertainties.
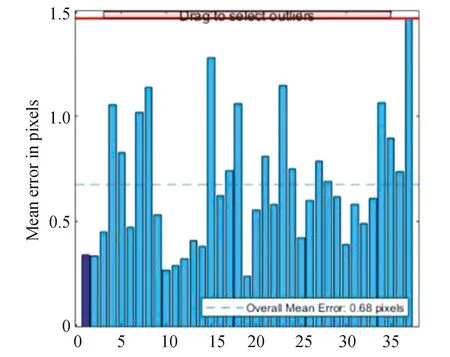
Fig.9 Mean reprojection error in the fisheye model
3.3 Elimination of Illumination Effect and Noises
Although the light source has been improved, the elimination of illumination effect and noise were still the biggest concerns.It was difficult to find a global threshold for image binarization when the brightness of the image was not uniform due to the complexity of the environment and the instability of the lighting conditions.This may result in key information not being magnified or even obscured.Therefore, two methods were selected to solve this problem:
1)Adaptive adjustment algorithm based on 2D gamma function.
2)Subtraction method based on the minimum and mean filter.
3.3.1Adaptiveadjustmentalgorithm
The adaptive adjustment algorithm was first introduced in the work of Liu et al.[11]It can not only preserve the original image information, but also detect more details in dark areas and adjust the uneven illumination to improve the visual effect.It uses multiple Gaussian functions to extract the illumination component, and adjusts the parameters of 2D gamma function according to its characteristics to correct the image.Based on the modern imaging model, a digital image can be viewed as a 2D function with the brightness value at the corresponding positions.
f(x,y)=i(x,y)r(x,y)
(5)
wherei(x,y)is the illumination component, andr(x,y)is the reflection component.
The illumination component needs to be extracted from the 2D function.It could be estimated by performing a convolution between the Gaussian function and the original image.The expression of the single Gaussian function is shown below:
(6)
wherecis a scale factor, andλis normalization constant, which satisfy the normalization condition ∬G(x,y)dxdy=1.
Then, the estimated illumination component can be obtained, and the expression is shown in Eq.(7):
I(x,y)=F(x,y)G(x,y)
(7)
whereF(x,y)is the input original image,G(x,y)is gaussian function.
The scale factorcin the Gaussian function decides the acting range of the convolution kernel.Ifcbecomes larger, the global feature will become more obvious.Otherwise, the local feature will become more significant.In order to achieve a balance, multiple-dimension Gaussian function is applied.
(8)
whereωis the scale factor.In this paper, there are 3 dimensions with value of scale factor 15, 80 and 250.All the factors weighed equally.
After the illumination components were extracted, the 2D gamma function was used to adaptively adjust the brightness according to the distribution characteristics of the illumination components.Eq.(9)shows the expression of the gamma function and Fig.10 shows the effect after applying the adaptive algorithm.

Fig.10 Comparison of images before and after applying the adjustment algorithm
(9)
whereγis the index for enhancing the brightness, andmis the mean of brightness in the illumination component.
3.3.2Subtractionmethodbasedonminimummeanfilter
The second method is quite traditional, but effective in removing noise and highlighting key components.From Fig.7, it can be seen that the operations of gray filter, minimum filter, mean filter and subtraction were applied in sequence.The minimum filter and mean filter aimed to obscure the original image, so that the background information could be extracted.Noise was also reduced in the averaging path.Then the images ready for the binary process were obtained by subtracting the original images with background and noise.Fig.11 illustrates the whole process of the method in real images.

Fig.11 The whole process of how illumination effect and noises are filtered out
Huge improvements were observed after filtering in binary images.Since the DIC algorithm in OpenPIV was quite sensitive, the differences shown here could be directly reflected in the results and affect the accuracy.
3.4 Reference Picture
The DIC algorithm used to calculate the displacement field was based on the comparison between a reference image and the corresponding refracted image.The interface between water and air should be flat when taking the reference image.In this work, when capturing the reference image, the circulation pump was turned off until the water settled down.The length of the video must be at least 5 s to get enough samples for the frames to be averaged.Most of the tiny disturbances caused by vibrations could be averaged out because the period of these high frequency waves did not exceed 5 s.Therefore, the processed reference image can be considered as pure flat.
4 Results and Discussion
4.1 Drop Test
A drop test was performed to verify the continuity of FS-SS method in complex situations by visualizing the propagation of circular waves.The circular wave pattern was generated by releasing a plastic ball from a height of 10 mm above the water surface.The diameter of the plastic ball was 20 mm and the water depth in this test was 30 mm.The camera mode was selected 720p_240 Hz in a narrow view with a size of 720×1280 pixels.Fig.12 shows the circular wave pattern at two time points.

Fig.12 Circular wave pattern at two timesteps
In Fig.12, the main wave pattern can be clearly observed.The wavelength had a magnitude of 74 mm and from the video shot by camera, the period of the circular wave was about 0.14 s.Based on wave theory, the wave generated by the drop of plastic ball was intermediate wave asd/λ=30 mm/74 mm≈0.41, which is smaller than 0.5 and larger than 0.05.Hence, for intermediate waves, the phase velocity can be calculated based on Eq.(10):
(10)
whereTis the wave period,dis the water height andλis the wavelength.
After calculation, the phase velocity of the main wave was about 0.217 m/s.In addition, the phase velocities can also be estimated as the position of wave crest and wave trough was clearly defined within the given time interval.In this case, the vertical velocity perpendicular to thex-axis was taken as reference.This value is close to the phase velocity calculated based on wave theories, which has an order of 0.195 m/s.From this point of view, the results of the drop test gave the author confidence in the routine of post-processing and proved that the method FS-SS is able to perform the time series analysis.
4.2 Adjustment of dt
As mentioned in Section 1.1, PIVMat can only calculate the gradient of water surface.In order to reconstruct the water surface including the real water height, the scale of the “velocity field”(displacement field of dots)needs to be carefully determined by setting an appropriate value for dtin the OpenPIV toolbox.Therefore, the calibration process(different from the one in Section 3.2)is necessary to correct the value of dtand connects the estimated results to real condition.
4.2.1Methodandprocedure
If each dtcorresponds to a surface height field, the value of dtcould be derived inversely given a known height in reality.On this basis, a reference test was performed.Three water heights were set as reference values, which were 30 mm, 40 mm and 50 mm.The images were taken when the water surface was steady and flat at these heights.Each case combined any two images from these three.Therefore, three cases were generated, namely 30_40, 30_50 and 40_50.In the reference test, dtwas set to 1 by default, which means it had no effect on the displacement field.In this case, the displacement field was equal to the velocity field.
Although the water surface was flat at each water height change, the software assumed that the shifts in the dot patterns were caused by waves.This is because the distance between the pattern and the camera was not large enough, so the lights moving toward the camera were not vertical except at the optical center.However, FS-SS method assumed that the camera was high enough and the lights propagated vertically.This results in a radial pattern that appeared on the displacement field.
Based on the displacement field with a radial pattern, the corresponding reconstructed surface looked like a smooth upside-down bowl as shown in Fig.13, with the crest of the wave exactly coinciding with the optical center in the radial pattern.This can be checked by finding the highest point in the reconstructed height field.

Fig.13 Reconstructed surface for case 30_40 in reference test
The problem is that the water surface is flat in reality, but not in the simulation.Therefore, it is necessary to discuss which height of the simulation result could correctly reflect reality.The answer is the crest of the wave, and the principle is clearly explained in Fig.14.
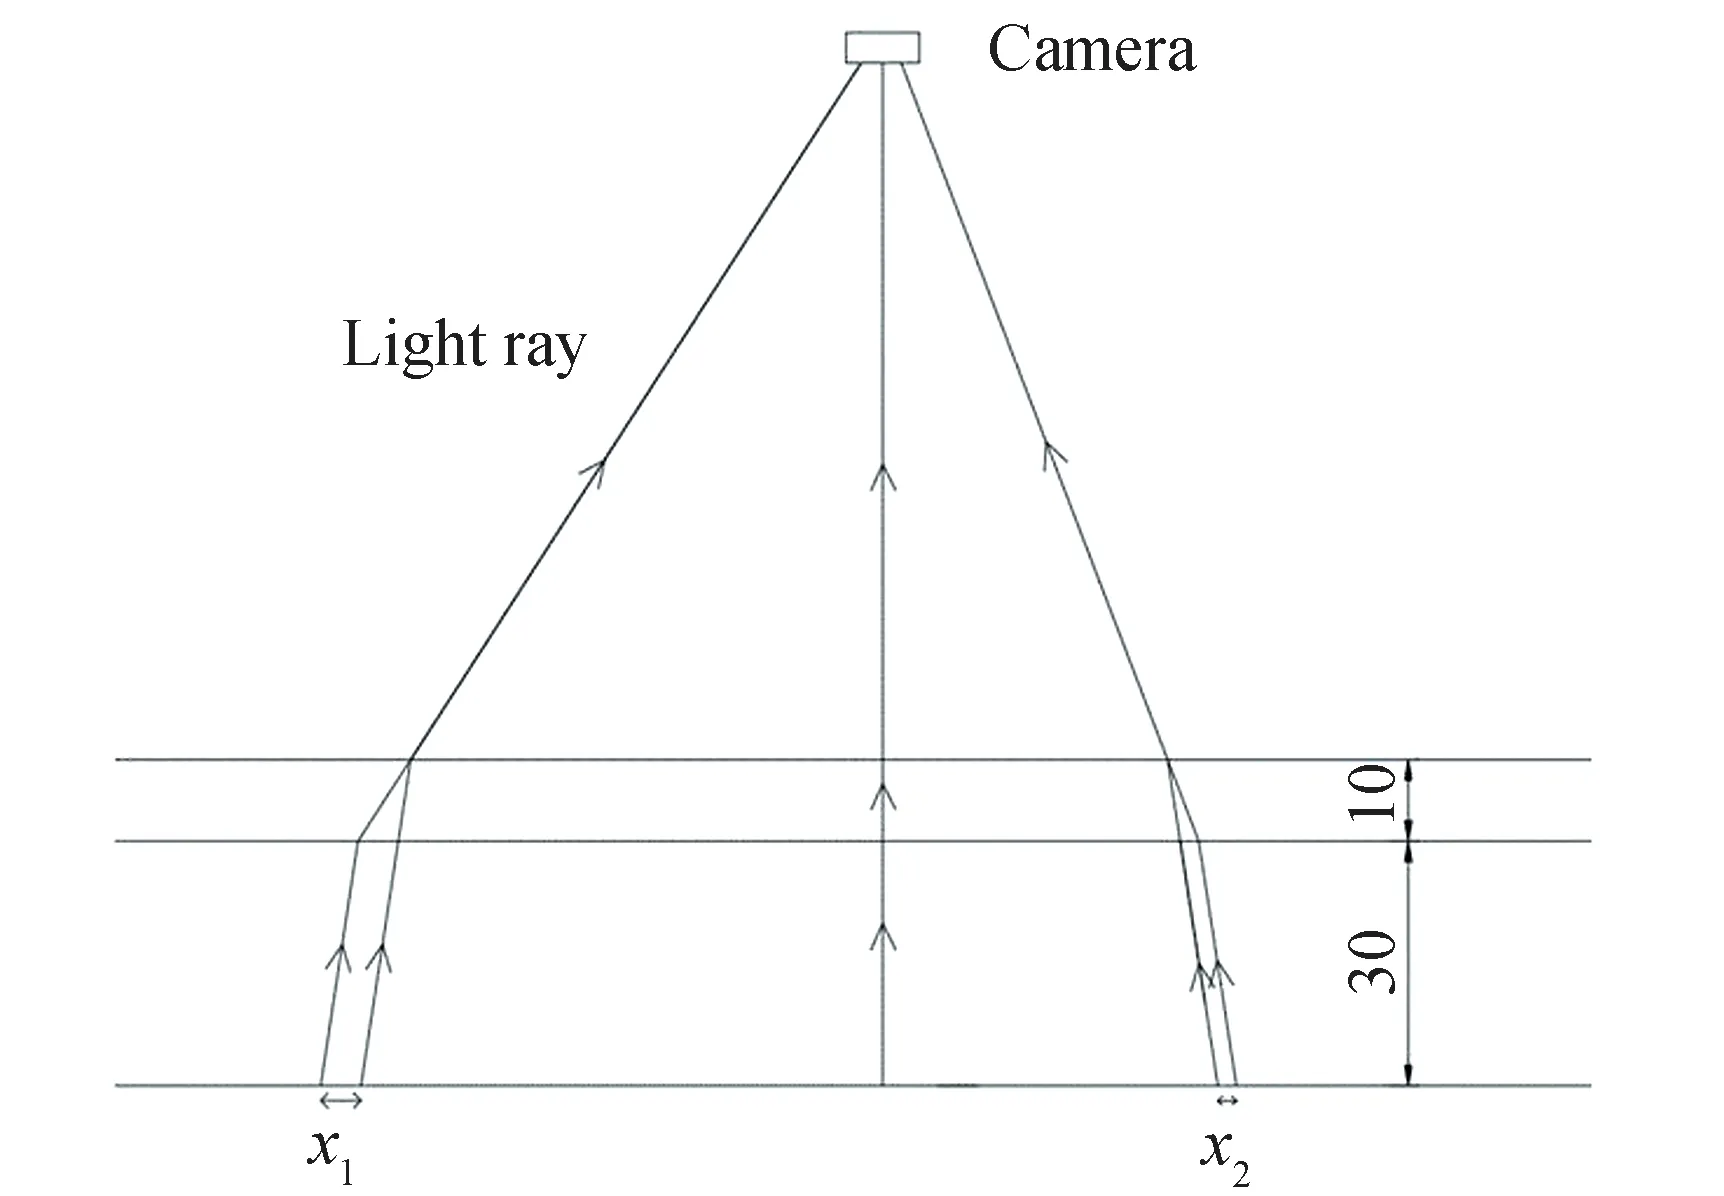
Fig.14 Path of light ray in the reference test(mm)
It could be clearly seen that the displacement of the dot pattern between two reference images is caused by the oblique angle of the light rays.Moreover, the displacement is smaller for light rays with smaller angle asx1is longer thanx2.The limit for this trend is the zero shift for vertical light rays, which means that the estimated height at the optical center always reflects the real state, and this is exactly the point where the wave crest is located.Therefore, the wave crest in the reconstructed surface profile can represent the water height in reality.
4.2.2Erroranalysis
Following the procedure of reference test in the above section, a series of results are collected in Table 3.

Table 3 Results of reference test(unit:mm)
where dtis the time difference,Hris the real water height,Hsis the simulated water height, dhris the real water height difference, dhsis the simulated water height difference, dtnis the adjusted parameter that connects the simulation and reality.
From the results, a relationship between the simulated height difference, real height difference and time difference was found out as
(11)
whereβis the coefficient of the relationship between dhrand dhs.It was first calculated by substituting dt=1, then dtwas adjusted in order to cancel the coefficient.Hence, a direct connection between dhrand dhscould be built.
From Table 3, the range of adjusted dtis from 0.00090 to 0.00147.The value of dtcould be taken as 0.00105(±0.00015)within the range of water height from 30 mm to 50 mm.The possibility of deviation for this estimation was approximately 14.29 %, which is acceptable.
4.3 Reconstructed Water Surface of Flow around Cylinder
Two flow cases were analyzed in this paper.The first case used a relatively smaller flow rate of 0.001647 m3/s, while in the second case, the flow was faster and more turbulent with an average flow rate of 0.001963 m3/s.The stability of the flow could be classified through Reynolds number.After calculation, the values of the Reynolds number for these two cases were 2810 and 3343, respectively.Therefore, the observing flow was in transition state as both of the Reynolds numbers were between 2100 and 4000.
4.3.1Velocityfield
Fig.15 shows the “velocity” field for the case of lower flow speed.The red circle marks the place where the cylinder was placed.Blue arrows demonstrate the mean flow direction of each interrogation window, the length of the arrow represents the magnitude of the “velocity”.However, the “velocity” is only the overall displacement of dots in each interrogation window, not the flow speed.The magnitude of the “velocity” relates to the surface gradient.

Fig.15 Velocity field for the case with lower flow rate
From Fig.15, characteristics of flow pattern could be observed.The velocity in front of the cylinder is larger than surroundings.Moreover, pattern of vortexes could also be observed in the wake area, where large displacements converge at one point and forms a series of circle propagating to far end.Velocities at the edge of the field will also become larger because the flow hit the sidewall of the tank.Hence the surface slope here will be sharper than water in the middle(outside the wake area).All of these patterns observed here will be further verified in the reconstructed height field.
Fig.16 shows the velocity field for the case of higher flow speed.The water surface with higher flow speed will be more turbulent, and estimated velocity field reflects these changes clearly.Compared with Fig.15, velocities, especially the ones at the upfront side of the cylinder become larger, the wake area is enlarged and the waves become steeper as velocities vary faster than the flow with lower speed.The picture is in good agreement with the actual situation as shown in Fig.17.Moreover, as more high-frequency waves are created and in the wake region, the whole filed shows more symmetry than Fig.15.

Fig.16 Velocity field for the case with higher flow rate
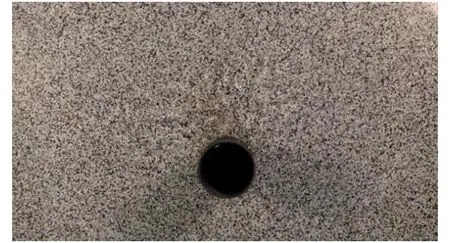
Fig.17 Video screenshot of the same frame as Fig.16
Fig.18 shows the time series analysis by proceeding each pair of images captured from high-frequency videos.The original frequency of video was 240 Hz, which means the time step was only 0.0042 s.The difference between each result was too tiny in such a short time.Hence, in order to better show the changes here, every 24 images were picked to proceed.The new time step is 0.1 s, and the flow trend could be easily observed.

Fig.18 Time series analysis with time step of 0.1 s for Case 1
4.3.2Reconstructedwatersurface
After obtaining the velocity field, reconstructed water surface could be calculated based on least square integration.An example of the reconstructed water surface of the flow field for Case 1 is shown in Fig.19.
The field of water height can be divided into 4 zones.Zone 1 is the upfront area of the cylinder where the depth is greater than in other areas.Zone 2 is the area where the cylinder is located.Since the velocity in this area has been set to zero, the slope here is almost zero.The simulation cannot show the actual elevation of this area, it can only be considered as a transition area.Zone 3 is the wake area, the height here is lower than that in the surrounding area.Wave crests and troughs are also clearly visible.Zone 4 is an area where the profile bends downwards.This is mainly caused by the side wall of the tank and the paraxial angle of the light.
In Case 2, as shown in Fig.20, the reference water height was well controlled, so the bending effect was not significant and the edge of reconstructed water surfaces looks flatter.Moreover, the pattern of height field shows a larger wake area.
In order to make the visualization of water surface more straightforward, 3D view was plotted based on the height information of each interrogation window in the field.An example of reconstructed water surface in 3D view is shown in Fig.21.
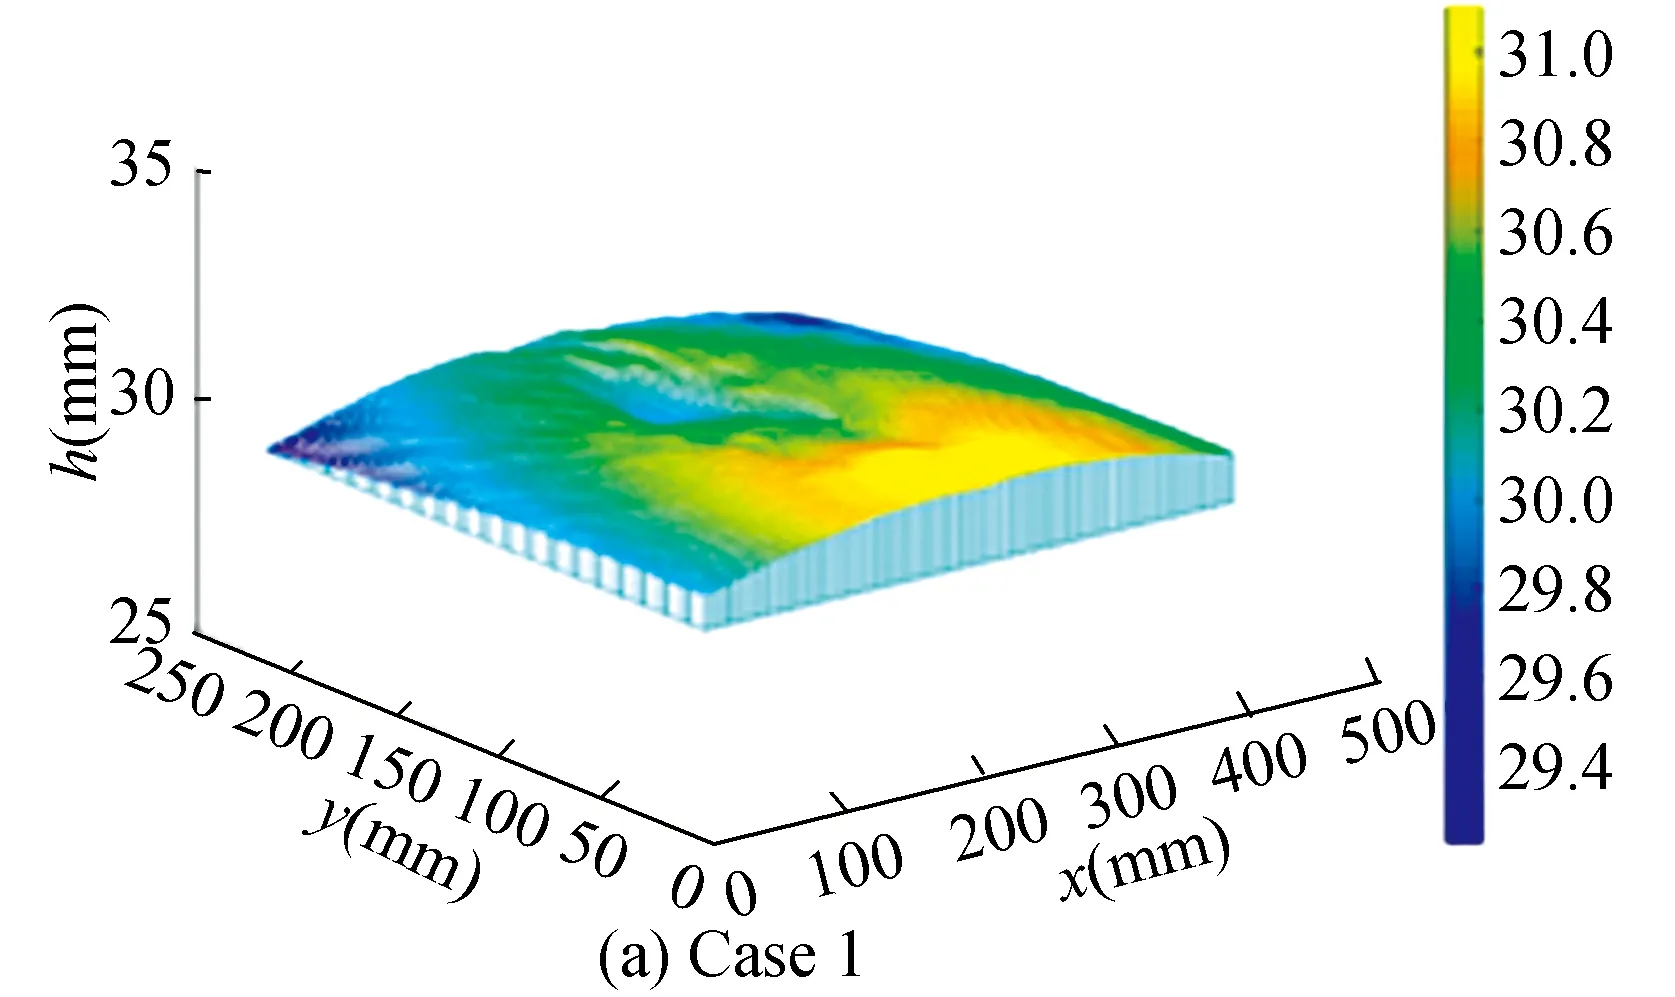
Fig.21 Reconstructed water surface in 3D view
4.3.3Oscillatingflowmechanism
Based on the time series analysis, the flow field for Case 1 has shown features of the oscillating mechanisms, which could be described by a dimensionless number, Strouhal number(St).The general form of Strouhal number is shown below:
(12)
wherefis the frequency of vortex shedding,Lis the characteristic length, which in this case is the diameter of cylinder,Uis the flow velocity.
Normally, for a uniform flow around a cylinder with Reynolds number between 8×10²and 2×10⁵, the large-scale instability will be dominant in the wake area and a value of St around 0.2 could be obtained[12-13].From the results of time series analysis for Case 1, the full vortex generating period was found out to be 1.6 s.After calculation, the value of St for Case 1 was about 0.34, which was slightly higher than 0.2.This is because the value of 0.2 was summarized in deep flow conditions, while the flow condition in this paper was shallow water.This can be accounted for the fact that the waterbed load in shallow water was significant and destroyed the coherence of the oscillating mechanism.
4.4 Validation of Flow Pattern with Dye
In order to verify the FS-SS method’s detail restoration of the flow field, the application of dye has been performed to visualize the flow pattern of the wake region[10].In this case, the periodic flow pattern was generated by two identical barriers as shown in Fig.22, which is easier for comparison and visualization and can be regarded as the simplified case for sluice gate of the tidal lagoon.

Fig.22 Double barriers for the obstacle setup
When compared with the image of dye and reconstructed water surface by FS-SS method, identical flow structure of vortex shedding can be found behind the obstacle.Fig.23 shows the flow pattern in the wake region visualized by two methods.
5 Conclusions
In this paper, the FS-SS method was further developed by observing the flow around a cylinder on a relatively large scale.The experimental setups were optimized.Instead of the overhead transparency and the light source below the pattern, a simpler experimental setup with external light sources was used, which is possible in most general laboratories.
In order to effectively eliminate unevenly distributed illumination and possible noise, this paper develops a new post-processing routine for images.Within the routine, the adaptive adjustment algorithm method based on 2D gamma function has been applied to optimize the image quality.Image processing is an essential part for the FS-SS method, as the image quality can be easily affected by external light sources, thus affecting the accuracy of the results.
Calibration, drop test, and control test were then performed at two flow rates.During the calibration process, a parameter dtwas found in the OpenPIV toolbox to relate the simulated water height to the real height.After collecting data from the reference test, 0.00105(±0.00015)was set as the value of dtwith a possibility of deviation of 14.29% for water height between 30 mm and 50 mm in reality.In the drop test, the method FS-SS gave the same order result for the velocity of the main wave as detected by the camera.This proves the effectiveness of the post-processing routine and the ability of the method FS-SS to perform time series analysis.Finally, visualization of the flow around the cylinder at two flow speeds showed different patterns in the wake region, which reflects the flow pattern of the real flow condition recorded by camera.Hence, it is sure that the FS-SS method is feasible for complex flow conditions.
Although the FS-SS method has recently been used primarily in small-scale research in shallow streams, it has the potential to be used on a relatively large scale as well.However, the main challenge to overcome is the IC conditions due to ray crossings and caustic, which may impose some limitations on practical applications.
杂志排行
Journal of Harbin Institute of Technology(New Series)的其它文章
- Review: Measurement-Based Monitoring and Fault Identification in Centrifugal Pumps
- Two-Dimensional Images of Current and Active Power Signals for Elevator Condition Recognition
- Spray Characteristics of Non-Circular Nozzle in Air-Assisted Injection System
- Optimization of AWJM Process Parameters on 3D-Printed Onyx-Glass Fiber Hybrid Composite
- Maintenance Strategy of Multi-Component System Due to Degradation and Shock
- Earthquake Emergency Response System of High-speed Railway by Least Square Method
