Assessment of Mg(OH)2/TiO2 coating in the Mg-Ca-Zn alloy for improved corrosion resistance and antibacterial performance
2023-03-24LeonrdoHernndezJesRmSierrMontserrtSoriCstrongelBelisGeonelRodrguezGttornoElizethOrtizzquezGloriAost
Leonrdo Hernández ,Jesús Rmón-Sierr ,Montserrt Sori-Cstro ,Ángel Belis ,Geonel Rodríguez-Gttorno ,Elizeth Ortiz-Vázquez ,Glori Aost
a Applied Physics Department,Center for Research and Advanced Studies of the National Polytechnic Institute (CINVESTAV-IPN),Carr.Ant.a Progreso km.6,C.P.97310,Merida,Yucatan,Mexico
b Tecnológico Nacional de México/Instituto Tecnológico de Mérida.Av.Tecnológico s/n Km.4.5 ant.Carr.Mérida-Progreso,C.P.97118,Mérida,Yucatán,México
c Facultad de Química,Universidad Nacional Autónoma de México (UNAM),Av.Universidad 3000,C.P.04510,Coyoacán,CDMX,México
Abstract The high activity of metallic magnesium and alloys limits its potential in biomedical applications;in recent years,extensive efforts have been devoted to modulating this reactivity.In this work,we present Mg(OH)2 and TiO2 barrier coatings to reduce the degradation of magnesium alloy (Mg-Ca-Zn)surfaces.These coatings were deposited by the anodization method and the spin-coating technique,respectively.The anodized layer was coated with TiO2 generated from the hydrolysis of 3% weight of TTIP (Ti[OCH(CH3)2]4,Titanium(IV) isopropoxide)in 2-Propanol deposited by the spin-coating method.Studying the degradation in Ringer’s solution by electrochemical impedance spectroscopy and OCP revealed a 98% reduction in pittings in uncoated samples after 14 days of immersion.The pH measurements revealed that the TiO2 coating reduced the alkalization of the physiological environment,keeping the pH at 6.0 values.In vitro studies of two types of bacteria (E.coli and S.aureus) exhibited zones of inhibition in the agar and activity bactericidal (kill time test).The mechanisms behind the improved degradation resistance and enhanced antibacterial activity are presented and discussed here.Surface modificatio with Mg(OH)2/TiO2 coatings is a promising strategy to control the biodegradation of magnesium implants for bone regeneration.
Keywords: Magnesium alloy;EIS;Mg(OH)2;TiO2;Antibacterial coatings.
1.Introduction
Magnesium (Mg) and its alloys are the lightest metallic structural materials and are widely used in industries (medical implants,communication systems,fuel-efficien vehicles,battery components,etc.) due to their advantages,which include low density,high specifi strength,good castability,processability,and recyclability [1–5].In addition,the mechanical properties of magnesium alloys and the human bone are similar.Specificall,the elastic modulus of magnesium alloys(45 GPa)is relatively close to that of human bone(3–20 GPa)[6–8].This similarity can reduce external stress and enable magnesium to be the main component of bioimplants.Therefore,as a biomedical material,magnesium alloys are ideal for bone fracture repair [5,9,10],and it is suggested that they can be used to repair cartilage [11].Although magnesium alloys have many excellent properties,they are chemically active and susceptible to corrosion when exposed to humid environments or chloride-containing media.This disadvantage occurs because of their low standard potential (−2.36 V),which limits their potential applications [2,5,10,12-14].Therefore,research on these metals is focused on improving corrosion resistance,and the most effective way to do so is to isolate the surface from the corrosive environment.This is achieved by preparing a stable protective layer between the matrix and the corrosive medium through different methods [1,2,15-21].
Given that the aim is to isolate the surface,it should be considered that Mg and its alloys always form a natural fil consisting of MgO and Mg(OH)2[15,22].Therefore,these film can be applied as protective coatings because they are nontoxic and biocompatible [23].Typically,Mg(OH)2structures are prepared by hydrothermal [23–25],sol-gel [26],solvothermal [27],microwave-assisted synthesis [28],and anodization methods[15,21,29].The anodizing method is one of the most popular processes [30].In several cases,Mg anodizing is also referred to as a micro-arcing process,since sparks are produced in the bath during the process.However,this process is still an anodization reaction between the Mg substrate and the bath electrolyte.Anodized magnesium coatings may be porous or non-porous depending on the conditions[21,30-32].When the anodizing technique is employed,the electrolytes used and the operating conditions must be controlled to form a uniform,stable,and less porous coating[15].The anodizing current density,voltage,substrate microstructure,electrolyte composition,and concentration can influenc the stability,thickness values,porosity,and corrosion resistance performance of the anodized fil [15].All the above parameters must be carefully selected and controlled to obtain a good coating.
As mentioned,porosity is an important factor to consider when exposing these types of coatings to aqueous solutions rich in Cl−ions.If you have a coating that is too porous,ions can penetrate the substrate/coating interface and initiate the substrate corrosion process.This will increase pH and mechanical strength degradation,leading to local inflamma tion and destruction of surrounding tissue,which could limit the use of this and other types of porous coatings in medical applications [33–37].Additional film can improve corrosion resistance by reducing the number of pores in the anodized film Studies of a double layer or more,for example of Mg(OH)2/Mg-Al hydroxide and on their layers of organic/inorganic silane chains have been reported[38–40].In addition,layered double hydroxide film have been fabricated on AZ31 anodized magnesium alloy [41].
When manufacturing materials that can be used as implants,it is important to be aware of the possible negative effects they could have on the human body.These effects are why it is preferable to use coatings that can be biocompatible with the human body.There are several types of such coatings.One that can be used is titanium dioxide (TiO2).This oxide has great potential for use on the surface of Mg alloys,as a TiO2passive layer has demonstrated anti-corrosive and biocompatible properties when used in a biological environment [42–47].Coatings of TiO2film as protective layers on magnesium alloys have been reported using different preparation methods,such as Sol-gel,electrodeposition,and dip-coating processes [44,46,48-52].The advantage of a TiO2coating is that it offers excellent bone-like apatite formation capacity [49,53,54].
In this work,we have explored the combination of anodization and spin coating techniques to protect the metallic magnesium with an Mg(OH)2/TiO2interphase,which allows for a delay in the initial corrosion and modulation of the degradation.The key advantage of these alloys is the delay of the corrosion process,and not its complete interruption[52,55].In addition to excellent osseointegration of the coatings,bacterial disinfection must be ensured,since the possible instability and/or loosening of the implant can be harmful to the bone regeneration process.Microbial infection,mainly byStaphylococcus aureus,can initiate or accelerate implant failure [46,56].Therefore,this work also evaluates the antimicrobial activity of coatings againstStaphylococcus aureusandEscherichia colibacteria.
2.Materials and methods
2.1.Samples and solutions preparation
The Mg-Ca-Zn alloy was fabricated by the Magnesium Innovation Center (MagIC) in extruded bar form.By weight,the alloy’s the chemical composition (%) was Al (0.01),Cu(0.0014),Mn (0.0034),Fe (0.0023),Zn (0.95),Ca (0.15),Si(0.0032,Ce(0.00272)and Mg(balance).The circular samples of Mg-Ca-Zn alloy (1 cm2of area and 3 mm of thickness)were abraded with 1200,1500,2000,and 200/4000-grit SiC sandpaper using 2-propanol as a lubricant,sonicated in an ultrasonic bath BRANSON 2800 with 2-propanol,and dried in air at room temperature.
The alkaline solution was prepared using NaOH (40 gL−1,Sigma-Aldrich,≥99.5%) and deionized water (18 MΩ) as reported by Mizutani et al.[57];the solution registered a pH of 13.5±0.5.
The TiO2coating was obtained by the sol-gel technique from a mixture of TTIP (3% weight) in 2-Propanol.These two precursors were vigorously mixed with a magnetic stirrer at 300 rpm for 10 min,at room temperature.The mixture had a pH value of 5.0,as obtained with ALDRICH test strips.
The electrolyte employed in the test was Ringer’s physiological solution,which was prepared by mixing analytical reagents from Fermont (8.36 g of NaCl,0.3 g of KCl,and 0.15 g of CaCl2in 1000 mL of deionized water) following the ISO 16,428:2005 standard [58].The value of the pH was 5.0,as tested with pH test strips (Aldrich) at a temperature of 25 °C.
2.2.Anodizing process
The anodized layer was obtained using a Teflo cell as shown in Fig.1.The exposed surfaces were 0.8 cm2,delimited by a circular rubber ring using 30 mL of the alkaline solution,a saturated calomel electrode (SCE) as a reference electrode,a platinum wire as a counter electrode,and the Mg-Ca-Zn samples as the working electrode.The potentiostat/galvanostat (reference 3000,Gamry Instruments,Philadelphia,PA,USA) was used to apply a current density of 10 mA/cm2in an anodic direction using two-time variables: T1(1200s) and T2(2400s).During the application of direct current (10 mA/cm2),the electron fl w dissolved the anode surface (Mg alloy),generating Mg2+ions (E.1),that were combined with hydroxide ions (E.2) in the electrolyte solution to form magnesium hydroxide (E.3) [59].After the anodizing process,the samples were rinsed with distilled water and dried at room temperature.
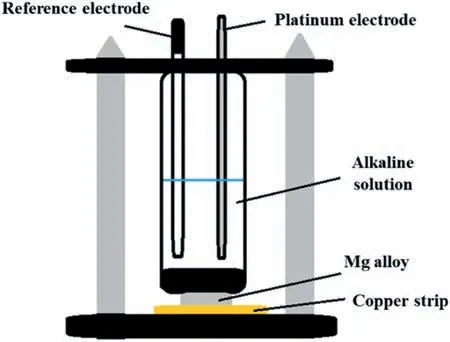
Fig.1.Diagram of Teflo cell used in the anodizing process.
2.3.TiO2 coating deposition
The diagram in Fig.2 depicts the TiO2depositing step,the T2 samples were fi ed with a circular strip of adhesive Velcro to a magnetic stirrer.The samples were set to rotate at 150 rpm and 10 μL of the TTIP/2-Propanol mixture was poured over the surface.A waiting time of 3 min was allowed for the 2-Propanol to evaporate and the surface to dry.This was repeated ten times,giving a total of 100 μL poured and an accumulated deposition time of 30 min.Subsequently,the agitation was stopped and the samples were removed and stored in Petri dishes for their respective analyses.During the whole deposition process,the TTIP/2-Propanol mixture was always kept in agitation at 300 rpm and room temperature.These samples were called T2-C.
When a metal alkoxide is used during a sol-gel process,macromolecular networks containing oxygens can be obtained through hydrolysis (E.4) and condensation (E.5) reactions,(Fig.3).These reactions can be expressed as follows [60,61]:
In this work,hydrolysis and condensation will be carried out on the surface of the Mg(OH)2coating,since water is expected to be present on its porous network.In addition,water may be acquired from the environment due to the humidity present during the deposition process.
2.4.Immersion and electrochemical test
The uncoated and coated(T1,T2,and T2-C)samples were immersed in Ringer’s physiological solution for 14 days.The exposed surfaces were 0.8 cm2and delimited by a circular rubber ring using a similar configuratio to Fig.1 but without a copper strip.The volume of Ringer’s solution was 40 mL,given that the minimum ratio (volume solution/exposed area)should be 10 mL/cm2[58].
The electrochemical behavior was determined using the register of the value of OCP (open circuit potential) and EIS(electrochemical impedance spectroscopy) measurements for 14 days using a surface exposed of 0.8 cm2and 40 mL of Ringer’s solution with a similar configuratio to Fig.1.A potentiostat/galvanostat (reference 3000,Gamry Instruments,Philadelphia,PA,USA) was used for the impedance measurements,applying a disturbance potential of ± 10 mV around the OCP,in a frequency range from 105to 10−2Hz,with 10 points per decade.The Gamry Echem Analyst graphing and analysis software (version 7.1,Gamry Instruments,Inc.,Philadelphia,PA,USA) was used for modeling and analyzing the impedance spectra.A suitable equivalent electrical circuit was chosen to get impedance parameters for the evaluation of the corrosion process of the samples immersed in the Ringer’s solution.
2.5.Microstructural characterizations
Scanning electron microscopy and energy-dispersive X-ray spectroscopy (SEM/EDS) were used to morphologically and chemically characterize the sample’s surface,the precipitates,and the thickness measurement (cross-section).The images were acquired using a JEOL JSM-7600F microscope and a low-angle backscattered electron (LABE) detector,working at 15 kV.
The K-Alpha Surface Analysis equipment from Thermo Fisher Scientifi was used in this study.The Kαradiation source has a dual-focus,180° hemispherical analyzer,and a 128-channel detector with a base pressure of 0.002 bar.The X-ray gun uses the aluminum single-chromium Kαline(1486.6 eV) at 12 kV and 40 W power in an oval area of 400 μm diameter and is incident on the sample at a relative angle of 30°.In this study,the sample surface was sputtered with a beam of argon ions accelerated to 3 kV,with a power of 30 W,incident on an area of 1×2 mm concentric to the X-ray beam.The neutralizer generated a cloud of argon ions of about 0 V energy over the analyzed area.The XPS spectra were obtained in two conditions: in broad overall scans (general analysis) (0–1350 eV) with 1 eV/step,step energy 100 eV,and small window mode (single elements)with 0.1 eV/step,step energy 50 eV.Measurements were performed on non-sputtered and sputtered surfaces for comparison and to determine if the anodized fil reacted with the atmosphere.The C 1s carbon peak signal (C=C) was fi ed at 284.5 eV for all samples to correct the binding energy shifts.
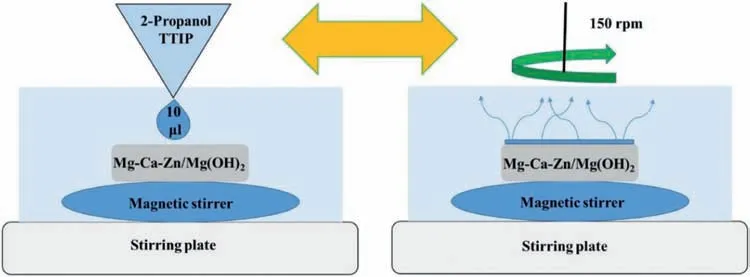
Fig.2.Schematic diagram of deposit TiO2 layer.

Fig.3.Illustration of the titanium hydrolysis and condensation process for the formation of the TiO2 layer.
The phases formed at the sample’s surface before and after of immersion test were identifie by the X-ray diffraction(XRD) technique under the following conditions: grazing incidence 1θ,2 s step time,0.02 step size,and Cukαradiation with 34 kV and 25 mA using the Siemens D-5000 Diffractometer.
2.6.Bacterial test
Bacterial strains and inoculum preparation:Escherichia coli(Gram-negative) andStaphylococcus aureus(Grampositive) bacteria were cultured in LB (Luria Bertani broth),and incubated at 37 °C for 24 h.The strains were preserved at −80 °C to avoid genetic variation [62].
Agar diffusion test:The antimicrobial tests were performed according to the method described by Balouiri et al.,2016 [63];bacterial strains were grown in a Mueller-Hilton medium for 12 h at 37 °C.Therefore,the inoculum was adjusted to 0.5 on the McFarland scale;equivalent to 1×10⁸CFU/mL.The colonial suspension was then diluted to 1×10⁶CFU/mL to perform the test.For antimicrobial activity in plate diffusion samples,T2 and T2-C were evaluated.Then the cultures were incubated at 37 °C for 24.Amoxicillin was used as a positive control.All samples were tested in triplicate.The inhibition zone around each sample was determined from the halos formed in the agar.
Time-kill test (time-kill curve):Bacterial strains were grown overnight in Mueller-Hilton medium and diluted in NaCl solution (0.85%) to obtain a fina optical density at 600 nm (OD600) of approximately 1.NaCl solution with bacteria was adjusted to get a fina bacterial OD600of approximately 0.5 McFarland scale,which is equivalent to 1×10⁸CFU/mL.Then,the samples T2 and T2-C were added to the tubes with the bacterial suspension.Finally,the samples were incubated at 37 °C and the OD600of the samples was evaluated each hour in the range between 0 and 6 h and at 8 and 24 h.Subsequently,an aliquot of 100 μL was extracted and diluted with 10 mL of sterile broth.The obtained suspensions were poured into Petri dishes with Mueller-Hilton medium and incubated for 24 h at 37 °C.The viability of the microorganisms was assessed by the presence of colonies on the plates [64].
3.Results and discussion
3.1.Anodized layer
During this research,different systems were evaluated that would allow us to have the entire surface of the alloy in contact with the alkaline electrolyte.Fig.1 shows the optimal arrangement used for the anodizing process of samples T1 (1200s) and T2 (2400s).Before the anodization process,the OCP values were recorded for 120 s.The values obtained were around 1.8 ± 0.05 V using the saturated calomel electrode (SCE).The anodic current density applied was 10 mA/cm2,and the surface area of the working electrode(Mg alloy) was 0.8 cm2.
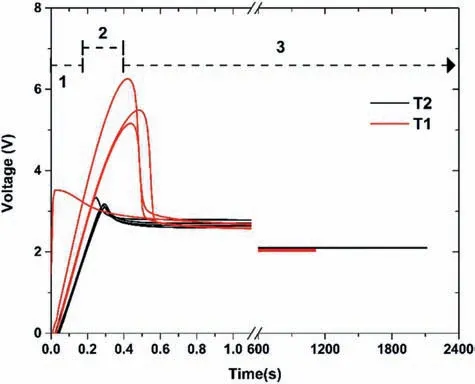
Fig.4.Typical anodization process curve (V vs t) for samples T1 and T2.
Fig.4 shows curves with the typical shape of an anodizing process [65],with three clearly define zones.The anodizing curve of the T1 samples (red line) shows that for zone 1,the time range was between 0 and 0.37 s.On the alloy surface,it was observed that the anodized layer started to appear with a slight release of oxygen gas,while on the Pt (cathode)surface,fin H2bubbles were released.During this time,a color change from a gray to a golden color was observed on the surface.In zone 2,there was a decrease in the ionic resistance where pores could be forming.This zone passes very quickly,occurring from approximately 0.15 to 0.45 s.The voltage changed from 3.5 to 6.26 V at the highest peak.This may have been due to a small variation in the surface of the samples,since they are very reactive to the presence of O.The natural oxide may have formed on the surface before interacting with the alkaline solution,forming MgO,which increases the ionic resistance on the surface.Zone 3,which starts from 0.45 s to the end of the process,is known as the equilibrium zone.During this period,the small pores fuse to continue generating the anodized thickness.The voltage in this zone remained close to 2 V,with many oxygen bubbles.Although the voltage in zone 2 was different for the T1 samples,this did not influenc the surface appearance obtained.
After the experience gained through the previous anodizing,it was proposed to use a process that was twice as long(2400s).The dependence between time and thickness was expected to be linear,i.e.double thickness with double time(2400s).Fig.4 shows the anodization curves (black lines) for the T2 samples.Three characteristic zones of the anodization process are also observed in these curves.The only observable difference concerning the anodization at 1200s was that the maximum voltage obtained in zone 2 was lower (3.5 V)than the 6.2 of sample T1.This could be because the surface oxidized less while they were placed on the anodizing platform,and/or because of the sensitivity of the equipment used.The onset times for zones 1,2,and 3 were similar.In addition,zone 3 for the T2 samples had a trend of 2 V with many oxygen bubbles,similar to the T1 sample.
3.2.Microstructural characterization
3.2.1.SEM-EDS: cross-section
Random samples were selected to determine the anodized thickness,which was encapsulated in transparent epoxy resin and cut in half (cut perpendicular to the surface).The crosssections were subjected to linear EDS analysis,and an SEM image was obtained at 2000x magnificatio to measure the thickness of the anodizing and to determine the distribution of the elements found (Fig.5).
Fig.5a)shows the cross-section of sample T1 with a thickness of 6.05 μm.It is worth mentioning that the surface,although homogeneous at firs sight,obtained a thickness with a Gaussian-like shape,with the maximum thickness in the center and a thickness of 5.4 μm at the ends.Fig.5b) shows the cross-section of sample T2 with a thickness of 10.1 μm.At the edge,there is a reduction of about 1 μm near the nonanodized areas.The EDS analyses for both samples show a distribution of C,O,and Mg.The C belongs to the resin and the O and Mg to the Mg(OH)2of the anodizing layer.Fig.5c)shows the cross-sectional image of the T2-C sample,in which the average thickness of the TiO2coating was approximately 4.5 μm.In the linear EDS analysis,the green line shows the variation of Ti along the y-axis.It can be observed that the TiO2coating is porous.He lack of material in some areas may be mainly due to cracks formed during deposition and possible detachment of material during the process of cutting and polishing.
3.2.2.Surface characterization
This section shows the results obtained before and after the 14-day immersion in Ringer’s solution using the SEMEDS technique with magnification of 500 and 2000x.Fig.6 shows the surface of the uncoated sample (reference),where the lines of the polishing process(Fig.6a)and white particles,which are 1.47 μm long and 0.86 μm wide,can be observed(Fig.6b).Fig.6c) and 6d) shows the surface of the uncoated sample exposed to 14 days in Ringer’s solution.The 500x magnificatio (Fig.6c)shows surface damage with pitting and corrosion products characteristic of this metal after exposure to Ringer’s solution.EDS analysis(wt.%)in crystals(red line)shows that O is the major element on the surface,followed by Mg and small traces of C.In Fig.6d),the surface can be seen at a magnificatio of 2000x.EDS analysis of the surface showed that there was a large amount of O,followed by Mg and C.Traces of Zn were also detected in the alloy.
Fig.7a) and b) show SEM images of the surface morphology of sample T1.As can be seen,the fil is rough and cracked (0.75 μm cracks).These cracks are a characteristic of Mg oxide-hydroxides;they lose water by evaporation that modifie the original morphology of the freshly anodized and wet surface.EDS elemental analysis of the surface showed that the major components were O and Mg.Fig.7c) and d)show the surface of sample T1 after 14 days of immersion in Ringer’s solution.Here,only rod-like morphology is observed in the corrosion products,with approximately 6.18 μm wide.The general analysis of the surface (500x-Fig.7c) and the specifi zones at 2000x (marked with arrows in Fig.7d)show that the main element is O,followed by Ca,Mg,and C.In addition,there are traces of Na and Cl.
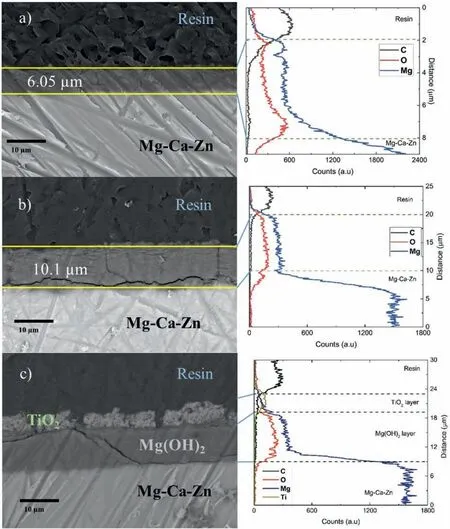
Fig.5.Selected cross-section SEM micrographs of the anodized Mg-Ca-Zn alloy and its corresponding linear-compositional analyses from EDS: a) T1,b)T2,and c) T2-C.
In Fig.7(e and f),SEM images of the surface morphology of sample T2 are presented.As can be seen,the fil is rough and cracked (cracks of about 1 μm).Some spots can be associated with pores (orange arrow).EDS elemental analysis of the surface showed that the main components were O and Mg.Fig.7 (g and h) shows the surface of sample T2 after 14 days of immersion in Ringer’s solution.In Fig.7g) a surface with rod-shaped crystals and some lumps and cracks can be seen.EDS analysis showed a low concentration of Mg and C for the crystals (yellow arrow),along with a high concentration of Ca and O.In Fig.7h),a magnificatio (2000x) of the surface can be seen.In this figure the EDS analysis on the lumps shows a high concentration of Mg and O.
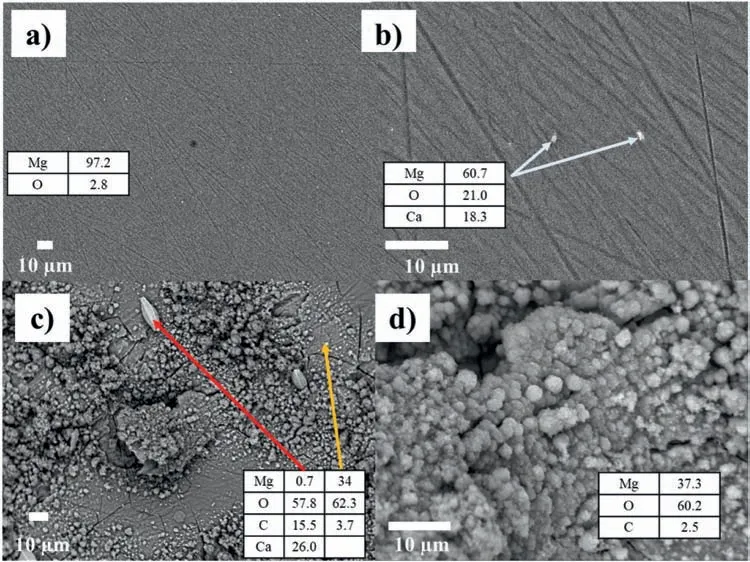
Fig.6.The uncoated sample with the SEM-EDS technique: without immersion (a and b) and after 14 days of immersion (c and d),using magnification 500x and 2000x.
Fig.8 (a and b) shows the surface of the T2-C sample.This surface can be considered homogeneous because it does not have agglomerations of material and shows cracks similar to those obtained on the anodized surface,due to the evaporation of the 2-propanol when the layer was deposited.In addition,one can observe two types of morphology: small crystals (green and yellow arrows) and porous material (red arrow,Fig.8b).This layer is rich in O and Ti,followed by Mg and a small amount of C.
Fig.8c) shows the surface of the T2-C sample exposed for 14 days in Ringer’s solution (200x).The surface showed no apparent damage (cracks and/or pitting).However,on the 7th day,some samples presented 1 or 2 holes associated with pitting that were perceptible to the naked eye,with fin columns of H2bubbles.These holes can be caused by the cracks observed in the Mg(OH)2layer and the porous TiO2layer.These cracks can allow the diffusion of Cl−ions,generating the corrosion process between the substrate/Mg(OH)2and/or Mg(OH)2/TiO2interface.Fig.8d)shows the surface at a magnificatio of 2000x,in which the beginning of the formation of corrosion products and/or material deposits can be seen in some areas near the cracks (green arrow).
Fig.9a) shows the surface of the samples not exposed with 6x magnificatio (Xiaomi camera,13 MP f/2.2).It can be observed that the samples are homogeneous without agglomerates.Fig.9b) shows the surface of the samples after 14 days of exposure in Ringer’s solution with a magnificatio of 6x.This figur shows the maximum damage received on the surfaces.Many instances of pitting and corrosion products can be observed in the uncoated sample.For the T2 sample,the pitting is reduced by approximately 96%,and for the T2-C sample,by 98%.This percentage was calculated with GIMP (GNU Image Manipulation Program)software.
3.2.2.XRD analysis
The X-ray technique was used to determine the crystal phase composition of the anodized layer and to compare the behavior of the surfaces before and after the immersion process (Fig.10).The XRD patterns of the sample before the immersion tests were analyzed with the X’Pert HighScore software using the PDF database.Bar plots correspond to references #01–074–220 for Mg(OH)2,and #01–089–5003 for metallic Mg.
Fig.10a) shows the pattern of the sample without anodization (uncoated).The analysis shows only metallic Mg reflec tions.MgO or Mg(OH)2peaks were not detected and if were found,they would form a thin enough layer not detected by X-rays.The main reflectio of metallic Mg is at 2θ∼36.52nd is observed in all anodized samples.The main peak of Mg(OH)2appears at 2θ∼18.4 with varying relative intensity for the coated samples.It does not exist in the uncoated sample.Other Mg(OH)2peaks were also detected with low relative intensity.These may have been related to the thickness of the anodized film which was of the order of microns in the substrate,or to a low degree of crystallinity in this phase,which was also expressed in the half-widths of the reflections The blue line in Fig.10a)indicates the analysis of the samples with the Mg(OH)2/TiO2(T2-C) coating before the exposure test was presented in which the main peaks observed were metallic Mg.On the other hand,Mg(OH)2peaks were found close to the main peaks.The peaks found corresponding to metallic Mg and Mg(OH)2could not be as well define due to the interference caused by amorphous TiO2coating,interfering with the interaction of the Mg(OH)2layer,which prevented its detection.

Fig.7.Select SEM micrographs of the samples to compare their morphology after 14 days of exposure to Ringer´s solution: T1 sample without exposure (a and b) and 14 days’ exposure (c and d),and T2 sample without exposure (e and f) and 14 days’ exposure (g and h).
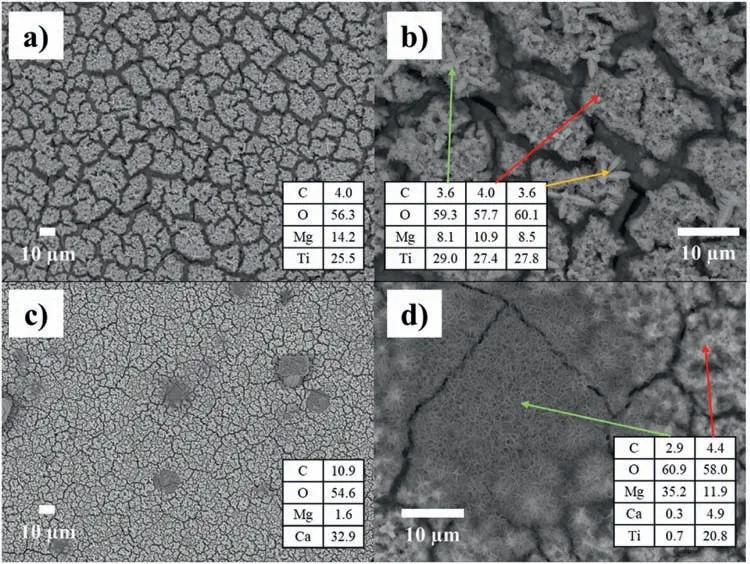
Fig.8.SEM micrographs of morphological analysis of the surface of the T2-C sample: without exposure (a and b) and at 14 days’ exposure (c and d).
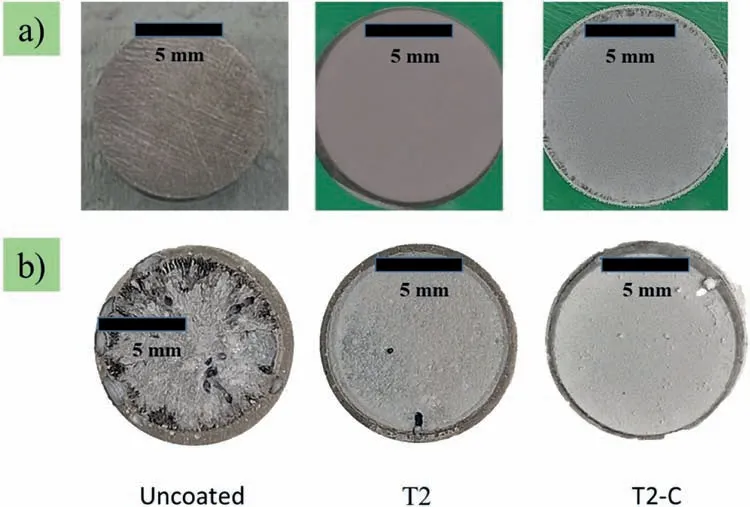
Fig.9.Samples photographs at 6x magnification a) without exposure and b) exposed in Ringer’s solution for 14 days.
Fig.10b presents the patterns of the samples T1 and T2 after the 14-day immersion,in which the phases corresponded to aragonite (CaCO3),Mg(OH)2,and Mg.In this case,all the samples showed the main peak of Mg at 2θ∼36.5,of Mg(OH)2at 2θ∼18.6,and of CaCO3at 2θ∼26.1.The presence of CaCO3was mainly due to the contribution of Ca from the alloy and the ions present in Ringer’s solution.The carbonate came from the environmental CO2hydrolysis in Ringer’s solution.The spectrum for the 14 days of exposure of the Mg(OH)2/TiO2coating (T2-C) is shown in Fig.10b with a blue line.Here the main peak is still that of Mg,at the value of 2θ∼36.6.Other low-intensity reflection were detected at 47.8 and 57.4.Reflection for CaCO3,Mg(OH)2,and TiO2were not detected,as they were close to the data acquisition limit of the equipment.An important detail is that at 14 days,no large-scale corrosion products were detected in contrast to the uncoated samples.These corrosion products were only identifie in the SEM-EDS analysis in a specifi area (Fig.8),which could indicate that the surface is being protected with this coating (Fig.9b).

Fig.10.XRD patterns for all samples (uncoated,T1 and T2,and T2-C) analyzed with the X’Pert HighScore software: a) without immersion and b) after 14 days of immersion in Ringer’s solution.
3.2.3.XPS analysis
XPS analysis was carried out in two ways to determine the elements present in the anodized and titanium dioxide-coated surface.The firs one was a general analysis of the sputtered surface with argon gas,and the other was an individual analysis of the elements of interest (Mg,O,and Ti).Fig.11 shows the overall XPS analysis of the surface for samples T1,T2,and T2-C.For all samples,the carbon signal was fi ed at 284.5 eV.The XPS spectra were similar for T1 and T2 samples,with peaks of Mg (1s),O (1s),Mg (2p),and Mg (2s).All previous peaks and the Ti (2p) peak,at 460 eV,for the T2-C sample.
Fig.12a) shows the Mg (1s) deconvolutions for the Mg(OH)2and TiO2-coated layers.The OriginPro 9.0 program with the GaussAmp option (Gaussian multi-peak analysis) was used in the deconvolution.The data acquired from the fi is presented in Table 1,where the binding energy of the Mg1speak is at 1303.6±0.6 eV for samples T1 and T2 and at 1304.2 eV for T2-C,corresponding to metallic Mg.Another important signal for Mg is that corresponding to 2p(Fig.12b),whose binding energy has the value of 50.1 eV for sample T1.This value is slightly higher (Table 1) than those reported for Mg(OH)2(49.5±0.3 eV).This shift can be attributed to the presence of MgO.The binding energy for sample T2 is 49.63 eV,which is similar to that reported for Mg(OH)2.Sample T2-C has a value of 50.5 eV.This value isslightly higher and can be attributed to the presence of TiO2,Mg(OH)2,and MgO.
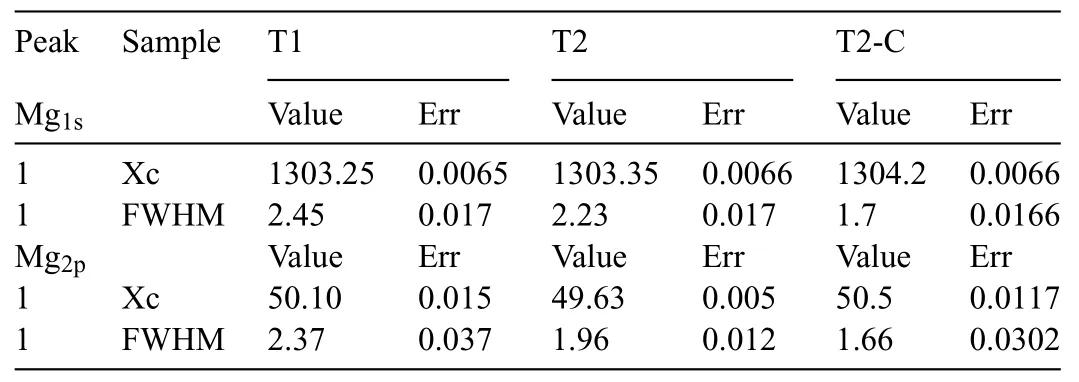
Table 1 Xc (B.E assigned) and FWHM values of the deconvolution of Mg1s and Mg2p.

Table 2 Xc (assigned B.E.) and FWHM values of the O1s deconvolution.
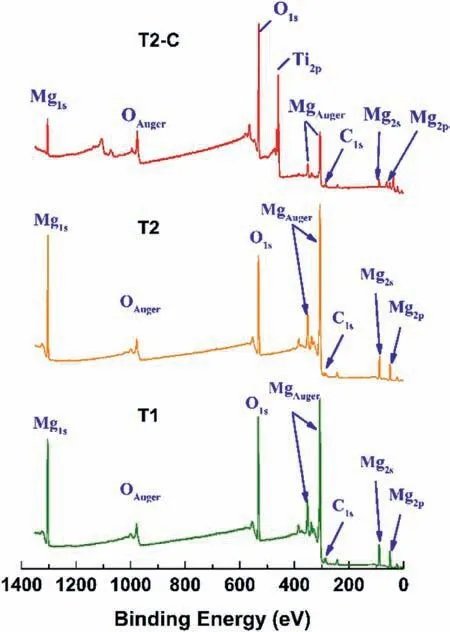
Fig.11.General XPS analysis (survey) of the surface sputtered with argon gas for the samples: T1 (green line),T2 (orange line),and T2-C (red line).
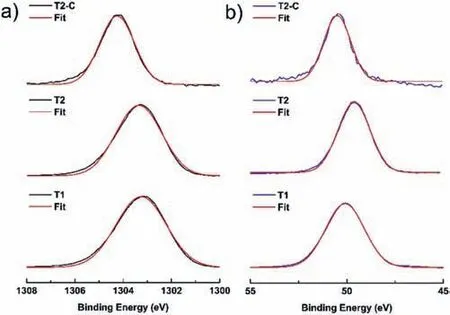
Fig.12.XPS spectra and deconvolutions in the Mg regions: a) 1s and b)2p,for all samples.The red lines represent the best deconvolution using the Gaussian function "GaussAmp" (Gaussian multi-peak analysis).
Fig.13 shows the deconvolutions for the oxygen signal O1s,in which the two contributions of O were evaluated.In all samples,the firs signal (P1) is related to OH−bonds associated with Mg(OH)2.For T1 and T2 samples,the second signal (P2) is attributed to MgO formation (O2−in oxides).In the case of the T2-C sample,this signal (P2) is influence by the TiO2formed.
Fig.14 shows the deconvolutions for Ti2p,in which the 2 characteristic peaks 2p3/2and 2p1/2were evaluated.The value obtained for 2p3/2was 458.84 eV (Ti4+bond) and the value for 2p1/2was 464.43 eV (Table 3).The difference between these two peaks was approximately 5.6 eV,which corresponded to the TiO2compound,as previously reported[66,67].

Table 3 Xc (assigned B.E.) and FWHM values of the deconvolution of the Ti 2p3/2 and 2p1/2 peaks for the T2-C sample.
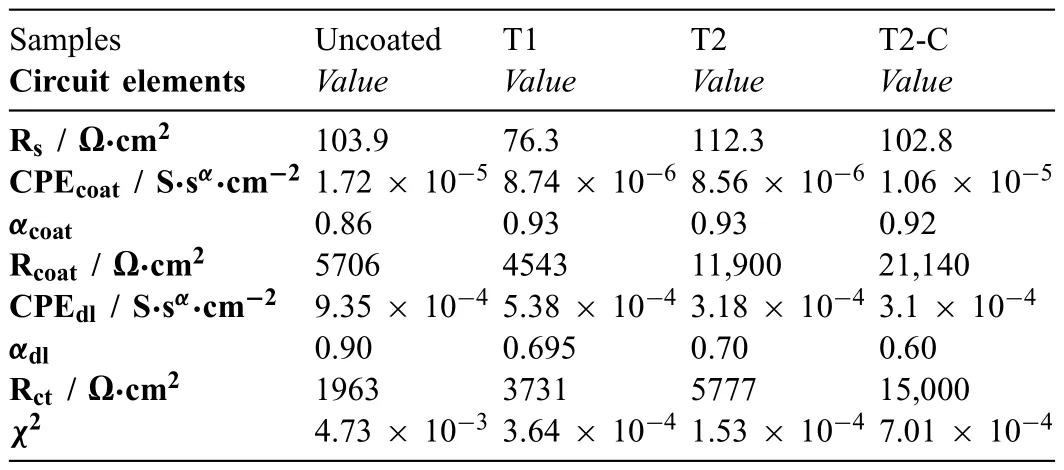
Table 4 Equivalent circuit element values for 1-day exposure after mathematical fit ting.
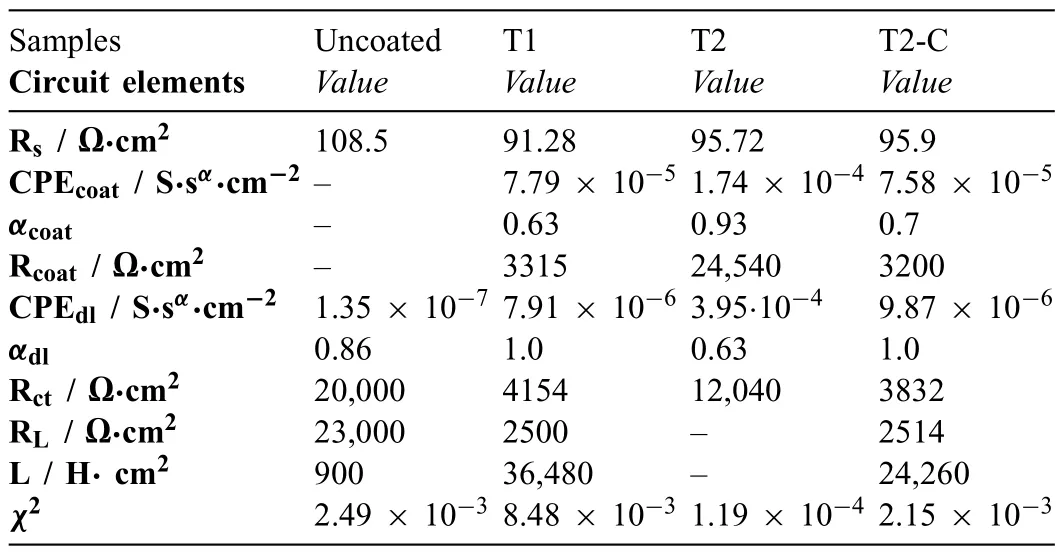
Table 5 Equivalent circuit element values for 14-day exposure after mathematical fitting
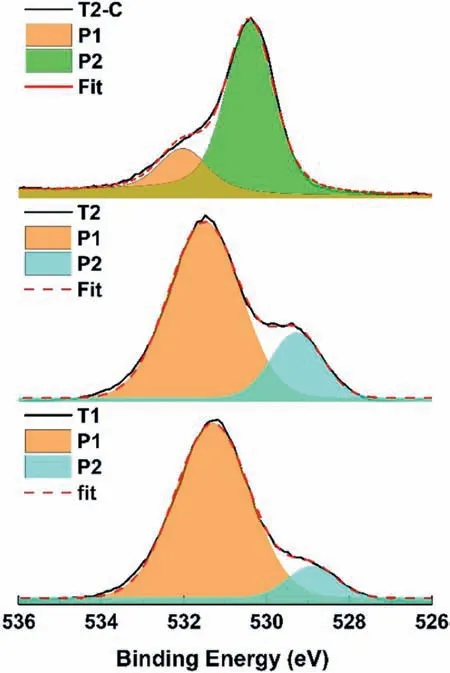
Fig.13.XPS spectra and deconvolutions in the O 1s region for all samples.Orange curves represent Mg(OH)2 peaks,green represent TiO2, and blue represents MgO.
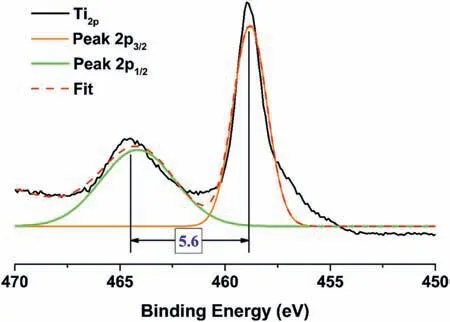
Fig.14.XPS spectra and deconvolution in the Ti 2p3/2 and 2p1/2 regions for the T2-C samples.The dashed line (red) represents the best deconvolution using Gaussian GaussAmp functions (Gaussian multi-peak analysis).
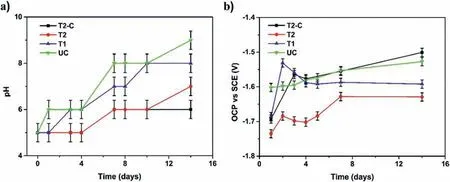
Fig.15.pH (a) and OCP (b) recorded samples during 14 days of immersion in Ringer´s solution.
3.3.Electrochemical activity
3.3.1.OCP and pH measurements
To evaluate the corrosion protection of the coatings obtained,it was necessary to stabilize the system;this stabilization was obtained after 24 h of immersion.The OCP and pH values were obtained after this stabilization time.Fig.15a)shows the changes in the pH of the Ringer’s solution during the 14 days of immersion,which starts at a value of 5.0 for all the samples.The fina value of the solution is different for each sample.The uncoated sample has a value of 9.0,the T1 sample has a value of 8.0,the T2 sample has a value of 7.0,and the T2-C sample has a value of 6.0.High pH values indicate that many OH−ions have been released from the surface as a result of the corrosion process.The uncoated sample has a high pH value,indicating that it is the most corroded surface.Fig.15b) shows the variations of the OCP values,giving the least negative value for sample T2-C and the most negative value for sample T2.The least negative value at 14-days for sample T2-C indicates that most of the pores and cracks present on the surface have been sealed,slowing down the corrosion processes,as can be seen in the low pH values.The uncoated sample has a less negative OCP value due to the corrosion products.These products form an unstable barrier,which dissolves and allows the corrosion process to continue occurring.This is proven by the high pH values.Samples T1 and T2 allow regulated corrosion of the surface since the pH values are not as high as in the uncoated sample and the OCP values are more negative,indicating that corrosion processes are present.
3.3.2.Electrochemical impedance spectroscopy
Fig.17 shows the Nyquist and Bode plots(angle phase and modulus)for the samples exposed 1 day after the stabilization stage in Ringer’s solution.Fig.17a) shows the Nyquist plots and Zrealvalues for Zimag→0 at middle frequency were obtained according to Pacha-Olivenza et al.’s second criterion[68].

Fig.16.Equivalent electrical circuits were used to model the impedance data obtained for Mg alloy(Mg-Ca-Zn)samples at 1 and 14 days:uncoated(a,b),T1 (a,c),T2 (a),and T2-C (a,c) during the immersion test in physiological Ringerʼs solution.
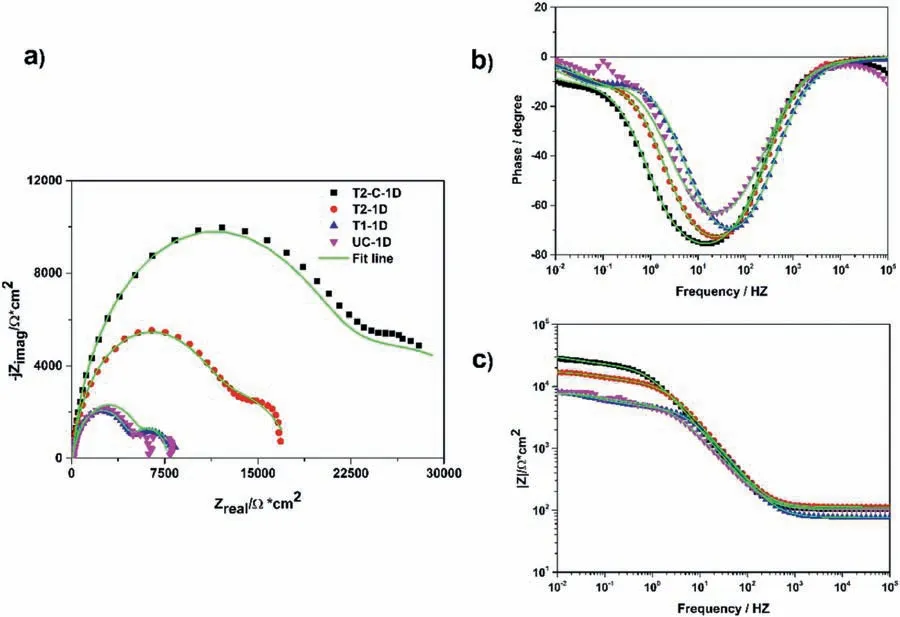
Fig.17.EIS plots for all samples at 1 day: a) Nyquist,b) Bode phase,and c) Bode module.
These impedance plots were further analyzed by the complex nonlinear least squares (CNLS) method and equivalent electrical circuits (EEC) available in Gamry Echem Analyst(version 7.01) software were used.The appropriate circuits suitable for each diagram were chosen following the postulate presented by Galvan et al.[69].The Nyquist plots were observed in detail (Fig.17a) and the EECs in Fig.16a) were proposed and adapted to the conditions of the electrochemical response of each sample.The shape of the Nyquist plots for the uncoated sample after 1 day of immersion was dominated in the firs quadrant of the complex plane by two capacitive arcs.Therefore,we can associate these impedance plots to the EEC in Fig.16a).Here,the firs capacitive arc is associated with two elements in parallel,the coating resistance (corrosion products,Rcoat) and a constant phase element(CPEcoat) corresponding to the electrochemical capacitance at the corrosion products solution interface.The second capacitive arc is also associated with two elements in parallel,the ionic-electronic charge transfer resistance (Rct) and a constant phase element (CPEdl),corresponding to the electrochemical double-layer capacitance at the metal-solution interface.The element Rsincluded in the EEC is associated with the resistance of the electrolyte.
After 14 days of immersion (Fig.18),the two capacitive arcs for the uncoated sample were reduced to one.The EEC shown in Fig.16b) was used for modeling this behavior.Here,the high frequency (HF-MF) arc is described by parallel-connected electrical elements,CPEdland Rct,which are attributed to the dielectric properties and ionic resistance of the corroded fil developed on the surface of the uncoated sample as well as to the double layer located inside the base of the pores of the corrosion product film CPEdl.The lowfrequency loop is associated with adsorption and desorption processes of intermediate species at the metal-solution interface (RLand L,elements in parallel with CPEdland Rct).
The T1,T2,and T2-C samples at 1 day of exposure showed a similar shape to the uncoated sample for the same time.The impedance data show typical Nyquist and Bode plots associated with metal/coating systems based on porous thin fil coatings.These can be described with the EEC shown in Fig.16a).The high frequency(HF)arc is associated with the electrical properties of the Mg(OH)2(and Titanium layer)and two electrical elements,CPEcoatand Rcoat,are used.On the other hand,the low frequency (LF) arc is associated with the electrochemical double layer and the charge transfer resistance (Rct) at the metal/solution interface at the base of the pores of the Mg(OH)2coating.
Samples T1 and T2-C showed similar values in impedance,which were associated with the shape of their arcs,the EEC in Fig.16c) was used to describe their behavior.These samples show an arc in HF and MF,and an inductive loop in LF.In this case,the HF arc is associated not only with the corrosion products formed on the surface of the Mg alloy substrate but also with the Mg(OH)2and Mg(OH)2/TiO2coatings.In this EEC,the Rcoatand CPEcoatelements are used in parallel and are in series with the CPEdl,Rct,RL,and L elements (these are in parallel with each other).The inductive loop is also associated with the adsorption and desorption processes of intermediate species on the electrode surface at the base of the coating pores and the Rctis associated with the resistance in the metal-electrolyte interface.
The T2 sample at 14 days of exposure showed a similar shape to the T2 sample for the 1 day (Fig.18).This can be described with the EEC shown in Fig.16a).The high frequency (HF) arc is associated with the electrical properties of the Mg(OH)2and two electrical elements,CPEcoatand Rcoat,are used.On the other hand,the low frequency (LF) arc is associated with the electrochemical double layer and the charge transfer at the metal/solution interface at the base of the pores of the Mg(OH)2coating.
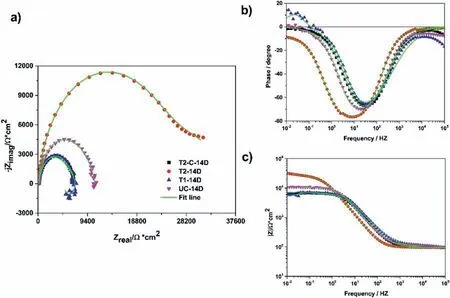
Fig.18.EIS plots for all samples at 14 days: a) Nyquist,b) Bode phase,and c) Bode module.
Table 4 summarizes the calculated values for each electrical element of the EECs shown in Fig.16a),and chi-squared values (χ2) obtained by the fittin procedures of the Gamry Echem Analyst (version 7.01) software for the samples after 1 day of the immersion.Table 5 summarizes the values for the electrical elements of the EEC for the 14 days.The results obtained from fittin the EIS plots and reported in Tables 4 and 5 also show that the values found for each of the electrical elements have correct physical significance Theχ2values are adequate because they are less than or similar to 10−3.
Nyquist and Bode (modulus and phase angle) diagrams provide information on whether a sample is corroded or whether one coating protects better than another.In the Bodephase diagrams,the higher impedance with the larger phase angle is shifted towards the smaller frequencies.We can obtain the following frequency relationship from the Bode-phase diagrams for the time of exposure:
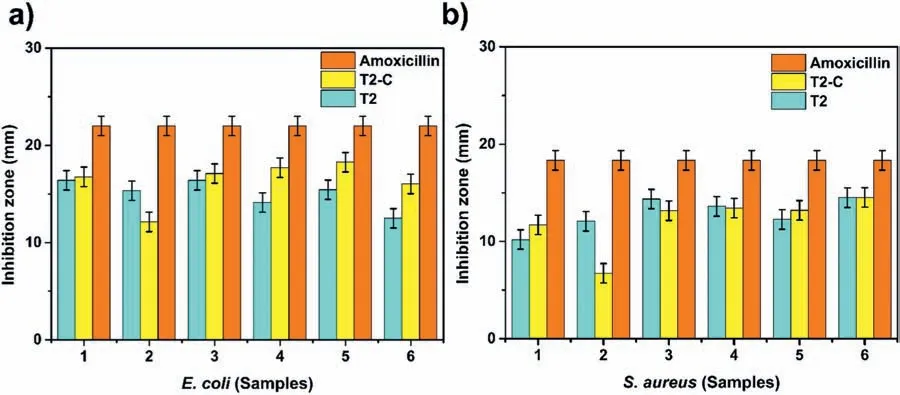
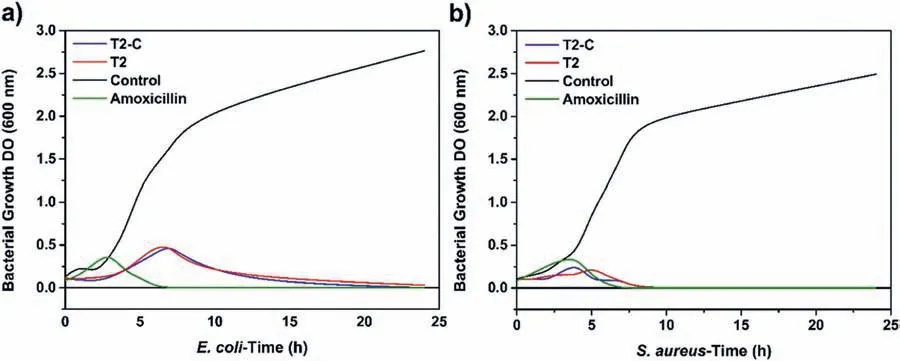
For 1 day: T2-C (14.85 Hz,−75.78°) For 14 days:T2(7.17 Hz,−76.52°) Fig.19.Antibacterial activity of uncoated (U),T2,and T2-C samples and control(amoxicillin)against two types of bacteria:E.coli(left)and S.aureus(right). The Rp (polarization resistance) value,which is define as the sum of all the resistances of the system minus the resistance of the solution,can be obtained from the Bode diagram (Fig.18c).In this case,the Rp value was used to calculate the percentage inhibition of each system at 14 days,using the following equation (E.6): The antibacterial effects of the coatings were firs tested using agar diffusion methods.The results are shown in Fig.19.The samples showed the inhibitory effect on the growth of the two different bacteria with different characteristics and were labeled as follows: U (uncoated sample),T2 (Mg(OH)2),T2-C (Mg(OH)2/TiO2),and C (amoxicillin control).In this same figure we can see that the inhibition zone corresponds to the geometry of the samples.The U-samples did not present an inhibition zone for both bacteria,which is why it is important to disinfect the Mg implants.On the other hand,samples T2 and T2-C showed inhibition zones of large diameter for both bacteria. Fig.20a) shows the averages of the inhibition zones forE.colibacteria.We can observe that the inhibition halos of sample T2-C were greater in 5 out of 6 tests to sample T2.This indicates that,for this bacterium,the titanium dioxide coating is more effective causing probably irreversible damage.On the other hand,in Fig.20b),it can be observed that for S.aureus bacteria,sample T2 was superior in 3 out of 6 assays.Meanwhile,sample T2-C was only superior in 2 of 6 trials.This would indicate that in the case that some bacteria could diffuse between the pores of the titanium coating,they could be damaged by the Mg(OH)2layer.Therefore,it could be said that these coatings have double protection againstS.aureusbacteria.It should be noted that,in both evaluations,the samples had a lower inhibition zone than that presented by amoxicillin.However,since the coatings are not drugs,they could present a greater inhibition over time.This is because bacteria could not adapt to these materials as easily as they do with conventional drugs (antibiotics),against which they can generate resistance. After the antibacterial effect of the coatings was determined,the Time-kill test was performed.This test is the most appropriate method to determine the bactericidal or fungicidal effect.It is a powerful tool to obtain information on the dynamic interaction between the antimicrobial agents and the microbial strain,concerning the time and concentration evaluated [62],revealing its mode of action (inhibits or kills the microbial cells). Fig.21 shows the test at 24 h of bacterial growth for the coatings of samples T2 and T2-C.Fig.21a) and 21b) shows the growth of bacteria without antibacterial agents (control)with a black line.In this curve,we can observe in the period from 0 to 2 h,the lag phase,which is the time it takes for the bacteria to reach a suitable physiological state in which they can grow and divide rapidly.Subsequently,there is the exponential growth phase,which occurs from 4 to 7–8 h,which means that the bacteria are in an environment that provides them with good replication and that by this time the death phase has not been reached.In Fig.21a) it can be seen that the behavior of theE.Colibacterium was similar for the coatings of the samples T2 (red line) and T2-C (blue line) where the bactericidal effect can be seen in the curves that tended to zero at the end of the test period (24 h).The same behavior was observed forS.aureusbacteria,although in this case,the values of the curves both tended to zero at 8 h(Fig.21b) compared to the control.The antibacterial response of the T2-C and T2 coatings was compared with the antibiotic amoxicillin (green line).ForE.colibacteria (Fig.21a),the trend to zero occurs at approximately 6 h,a shorter time than that obtained for the coatings.ForS.aureusbacteria(Fig.21b) the trend to zero occurs at approximately 7 h.This value is similar to that obtained for the coatings.These values are promising given the strong resistance of bacteria to antibiotics and the poor adaptability when exposed to metal oxides. Fig.20.Inhibition zones for antibacterial activity (mm) of agar disk diffusion tests for the bacteria: a) E.coli and b) S.aureus. Fig.21.Bacterial growth curve (Time-kill test): a) E.coli and b) S.aureus.Control (black line),Mg(OH)2 (red line) and Mg(OH)2/TiO2 (blue line). It was possible to establish the conditions for the interfacial deposition of Mg(OH)2and TiO2coatings that function as a protective barrier in the modulation of the early corrosion stages in Mg-Ca-Zn alloy.Their role as protectors of the “barrier” systems was shown after they were exposed to a body-flui simulate solution when their resistance was estimated by combined electrochemical techniques.The SEM-EDS,XPS,and surface XRD analyses and the crosssection showed that the coatings obtained were successfully deposited and were formed by Mg(OH)2and TiO2.The XPS analysis confirme that a TiO2coating was obtained and the XRD analysis showed that the TiO2coating was amorphous since no major peaks of crystalline phases (anatase,rutile,or brookite) were found.The use of the 1 M NaOH solution,a time of 2400s,and a current density of 8 mA/cm2generated the formation of a homogeneous,stable,and pitting-free layer of Mg(OH)2.The deposit with the spin-coating method using a TTIP-based sol-gel solution in 2-propanol without water gave a very efficien homogeneous titanium layer to regulate the local pH since the Ringer solution changed from a pH value of 5.0 to 6.0 in 14 days.This combination was the one that best regulated the pH compared to the Mg(OH)2coatings and the passive corrosion layers that form on uncoated substrates.The addition of a TiO2coating reduced the pitting after 14 days by approximately 98% compared to the uncoated sample.As a proof of concept,the antibacterial properties of the barriers were also explored.The Mg(OH)2/TiO2combination after the test against both bacteria,showed halos of inhibition in 6 of 6 applied tests.In addition,the Mg(OH)2coating also exhibited inhibition halos in 6 of 6 assays for both bacteria.The time-killed curves also showed a tendency to zero.Thus,we can indicate that the obtained Mg(OH)2/TiO2coating samples have antibacterial activity,in fact,a bactericidal effect,which decreases the chances of early failure of Mg alloys when used as bio-implants. Acknowledgments The authors appreciate the use of the facilities of the National Laboratory for Nano and Biomaterials,Cinvestav-IPN;finance by the FOMIX-Yucatán 2008-108160,CONACYT LAB-2009-01-123913,292692,294643,188345,and 204822 projects.In addition,L.H thanks the financia support received from CONACYT,as well to M.C.Daniel Aguilar-Treviño for obtaining the diffractograms,D.Huerta-Quintanilla,and Dr.Victor Rejón for obtaining the SEM images,W.Cauich-Ruiz by obtaining the XPS spectra.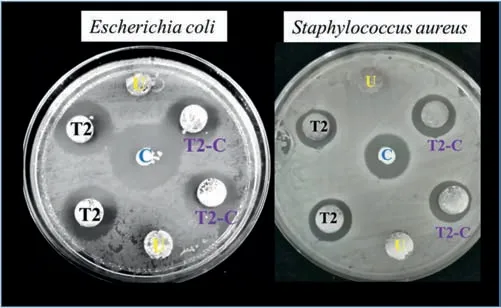
3.4.Antibacterial tests
4.Conclusions
杂志排行
Journal of Magnesium and Alloys的其它文章
- Formation of carbon and oxygen rich surface layer on high purity magnesium by atmospheric carbon dioxide plasma
- Local hardening and asymmetric twin growth by twin-twin interactions in a Mg alloy
- Brittle and ductile characteristics of intermetallic compounds in magnesium alloys: A large-scale screening guided by machine learning
- Experimental study on uniaxial ratchetting-fatigue interaction of extruded AZ31 magnesium alloy with different plastic deformation mechanisms
- Simultaneous refinemen of α-Mg grains and β-Mg17Al12 in Mg-Al based alloys via heterogeneous nucleation on Al8Mn4Sm
- Unveiling the influenc of dendrite characteristics on the slip/twinning activity and the strain hardening capacity of Mg-Sn-Li-Zn cast alloys
