Performance evaluation of a water erosion tracer using plot-scale experiments and process-based modeling
2023-03-22JoVilllaJamilAnachAlxWatanabDnnisFlanaganEdsonWndlandSilvioCrstana
João M.Villla , Jamil A.A.Anach , Alx M.Watanab , Dnnis C.Flanagan ,Edson C.Wndland , Silvio Crstana
a EMBRAPA - Brazilian Agricultural Research Corporation, LNNA - National Laboratory of Nanotechnology for Agrobusiness, St.XV de Novembro, São Carlos, SP,13560-970, Brazil
b University of São Paulo (USP), São Carlos School of Engineering, Graduate Program in Environmental Engineering Sciences (PPG-SEA), Av.Trabalhador São-Carlense, CxP.359, São Carlos, SP,13566-590, Brazil
c Department of Hydraulics and Sanitation, São Carlos School of Engineering (EESC), University of São Paulo (USP), CxP.359, São Carlos, SP,13566-590,Brazil
d Federal University of Mato Grosso Do Sul, CxP.549, Campo Grande, MS, 79070-900, Brazil
e USDA-Agricultural Research Service, National Soil Erosion Research Laboratory, 275 S.Russell St., West Lafayette, IN, 47907, USA
Keywords:Soil erosion Tracer Rare earth elements Deposition Sediment source WEPP Model
A B S T R A C T Socioeconomic and environmental losses caused by water erosion have highlighted the importance of quantifying and understanding the dynamics of soil redistribution in the landscape to develop effective soil management practices.Several methods are applied to estimate erosion/deposition rates and identify sources of sediments,among them,the one that uses rare earth elements(REE)as a tracer stands out.However,an alternative not yet explored that can benefit the accuracy of the estimates provided by the method is using a tracer containing a chemical signature composed of more than one REE.The present study aimed to evaluate the performance of a new water erosion tracer based on montmorillonite labeled with rare earth elements (La40-MMT).The innovative aspects of this La40-MMT tracer include its highly stable multi-chemical signature (Nd3+, La3+, and Pr3+), which enhances tracer detection in the environment, and its low production cost due to the use of an industrial residue in the synthesis process.The tracer was evaluated for a typical soil of the Cerrado biome,using a natural rainfall field-scale plot-NRFP(5 m×20 m)and a physical predictive erosion model(WEPP).The results showed that the La40-MMT tracer could be used to estimate erosion/deposition rates, with agreement between the values observed with the tracer and the WEPP model.Thus,this study confirmed the great potential of La40-MMT as a tool to identify patterns of soil redistribution at the field scale and aid in the validation of erosion models.
1.Introduction
Accelerated soil erosion is considered one of the greatest environmental issues that causes substantial socioeconomic losses worldwide (Pimentel & Kounang, 1998; Sartori et al., 2019).Increased soil erosion caused by repetitive and pervasive land cover and land use changes(Anache et al.,2018;Borrelli et al.,2017,2020,2021; Fang, 2020; Hu et al., 2021; Luetzenburg et al., 2020) have accentuated various problems in the soil,including loss of nutrients and organic matter(Alewell et al.,2020;Guimarães et al.,2021;Lal,2015), thereby decreasing soil fertility and productivity (den Biggelaar et al., 2003), and food security (Pimentel, 2006).Soil erosion has also changed biogeochemical cycles(Berhe et al.,2018;Quinton et al., 2010) and reduced off-site water quality due to the distribution of nutrients and contaminants via diffuse pollution(Issaka & Ashraf, 2017).
Identifying land areas susceptible to erosion and understanding the dynamics of sediments transported over the landscape have become leading goals in developing effective soil management and conservation strategies.Nevertheless, the high complexity of sediment redistribution processes in a hydrological basin makes this understanding a challenging task.In this context, several methods based on tracers have been proposed to investigate sediment redistribution dynamics, such as Fallout radionuclides137Cs,7Be,and210Pb(Gaspar et al.,2021;Mabit et al.,2014;Zapata,2003), magnetic compounds (Burguet et al., 2018; Guzmˊan et al.,2015; Ventura et al., 2001), fingerprint approaches (Collins et al.,2010; Habibi et al., 2019; Nosrati et al., 2021), and rare earth elements (REE) (Tian et al.,1994; Zhu et al., 2010).In addition, other non-conventional methods have also been proposed, for example,ceramic spheres marked with dysprosium(Dy)(Plante et al.,1999),soil marked with REE(Matisoff et al.,2001),soil marked with134Cs(Quine et al., 1999), and copper (Cu) applied as a fungicide(Schwertmann & Schmidt, 1980).However, as listed by Guzmˊan et al.(2013), these soil erosion tracing methods possess some drawbacks, namely, the difference between physical properties(density), non-conservative behavior of physical and biogeochemical properties of soil used as a tracer,preferential linkages between fine soil particles, and dependency on sophisticated statistical methods.
Although they still have limitations,some methods have already been shown to provide information on the dynamics of soil redistribution in the landscape and erosion estimates with a certain degree of reliability.Among the methods,the one that uses REE as a tracer(incorporating REE oxides in the soil)has been widely used in studies to evaluate erosive processes (Zhang et al., 2001, 2003,2017a, 2017b; Kimoto et al., 2006; Lei et al., 2006; Liu et al., 2004,2016;Michaelides et al.,2010;Polyakov&Nearing,2004;Stevens&Quinton,2008;Tian et al.,1994;Wang et al.,2020;Yang et al.,2008;Zhu et al., 2011) and the dynamics of soil redistribution in the landscape (Deasy & Quinton, 2010; Kimoto et al., 2006; Polyakov et al., 2009).The method presents some desirable characteristics of an ideal sediment tracer, such as the possibility of multiple tracers, strong binding capacity to soil aggregates, high analytical sensitivity, low concentration in soil, low toxicity,insoluble or low solubility in water,and low uptake by plants(Guzmˊan et al.,2013;Polyakov & Nearing, 2004; Zhu et al., 2010).In contrast, the preferential binding to the finer soil aggregates and the increase in uncertainties generated by the complex analytical processes called Inductively Coupled Plasma Mass Spectrometry (ICP-MS) via acid digestion are the main limitations of the method (Guzmˊan et al.,2013).An alternative not yet explored by studies carried out with the REE method is using a tracer with a “chemical signature”composed of more than one REE.Referencing more than one REE in calculating the average soil loss could reduce analytical uncertainties.In this sense, Villela et al.(2020) developed a tracer(La40-MMT) composed of montmorillonite clay marked via cation exchange with rare earth elements (neodymium (Nd3+),lanthanum (La3+) and praseodymium (Pr3+)), which make up the multi-chemistry signature tracer.For the development of this tracer,similar physical transport characteristics of clay with natural clayey sediments were explored (Spencer et al., 2011) and the advantages already presented of REE as a chemical signature.Another point explored in the tracer development was the reduction of production costs by using an industrial residue (Rosental, 2008)from mining as a source of REE,enabling large-scale application of the La40-MMT tracer.Villela et al.(2020), using this residue as a REE precursor, produced tracers with a multi-chemical signature(Nd3+,La3+,and Pr3+)and a high stability degree over the pH range of interest(6-4) for soil-related applications.
Despite the high potential of using tracers to identify the origin of soil detachment and quantify erosion processes, computational approaches such as the Water Erosion Prediction Project (WEPP)model (Flanagan et al., 2012; Nearing et al.,1989) can help to understand and extrapolate the phenomenon under unsampled conditions at numerous locations.The model can provide concentrated surface runoff and soil loss values for slopes and small watersheds and distributed sediment detachment and deposition values.Therefore, the agreement between the computational tool and the tracer under development contributes to the spatialtemporal evaluation of erosion processes in an indirect way, being a complementary criterion for the assessment of emerging technologies for predicting soil loss and related processes (Zhang et al., 2005, 2008).However, to this point, studies that relate data monitored with REE tracers with predictions made with the WEPP model have been limited to erosion processes in rills under controlled laboratory conditions(Zhang et al.,2005,2008).Thus,it is important to expand these comparisons to include detachment and deposition processes and consider natural rainfall (field experiment).
In this sense, the present study aimed to evaluate the potential of the La40-MMT tracer to provide erosion rates and identify patterns of soil redistribution.For this, the study proposed the following objectives: I) to evaluate the ability of La40-MMT to estimate erosion and deposition rates in erosion experiments Natural Rainfall Field-scale Plot-NRFP(5 m×20 m)under natural rainfall;II)to evaluate the tracer distribution pattern along the erosion plot after the rain events; III) to evaluate the stability of the multichemical signature of the tracer for the experimental field scale;IV)to compare the detachment and deposition that occurred in the range where the tracer was applied with the estimates simulated with the WEPP model.
2.Material and methods
2.1.Synthesis of La40-MMT tracer
The La40-MMT tracer was developed at the National Laboratory of Nanotechnology for Agribusiness - LNNA, located at Embrapa Instrumentation - São Carlos (SP), Brazil.The tracer synthesis involved the cation exchange reaction between natural montmorillonite (MMT) supplied by Drescon S.A.(Paraíba, Brazil) and a REE-rich industrial residue called lanthanum chloride solution 40(Rosental, 2008).The full description of synthesis and characterization procedures was published elsewhere (Villela et al., 2020).The Nd3+,La3+,and Pr3+contents incorporated in MMT were 4.05%,3.56% and 1.04%, respectively.This multi-chemical signature enabled obtaining another parameter that facilitates the tracer detection in the environment,namely,the relative content of each element concerning the total elemental content (Nd = 46.88%,La = 41.10%, and Pr = 12.0%).
2.2.Soil
The soil used in the present study was a Typic quartzipsaments with a sandy texture based on 85% sand,12% clay, and 3% silt.The total porosity, density, and hydraulic conductivity (30 cm depth)were 0.379 cm3cm-3,1.64 g cm-3,and 147.31 mm h-1,respectively(Youlton et al.,2016).The natural concentrations of Nd3+,La3+,and Pr3+in this soil (0-20 cm depth) were determined by inductively coupled plasma mass spectrometry (ICP-MS), as described in section 2.4.
2.3.Natural rainfall field-scale plot (NRFP) tests
2.3.1.Study area
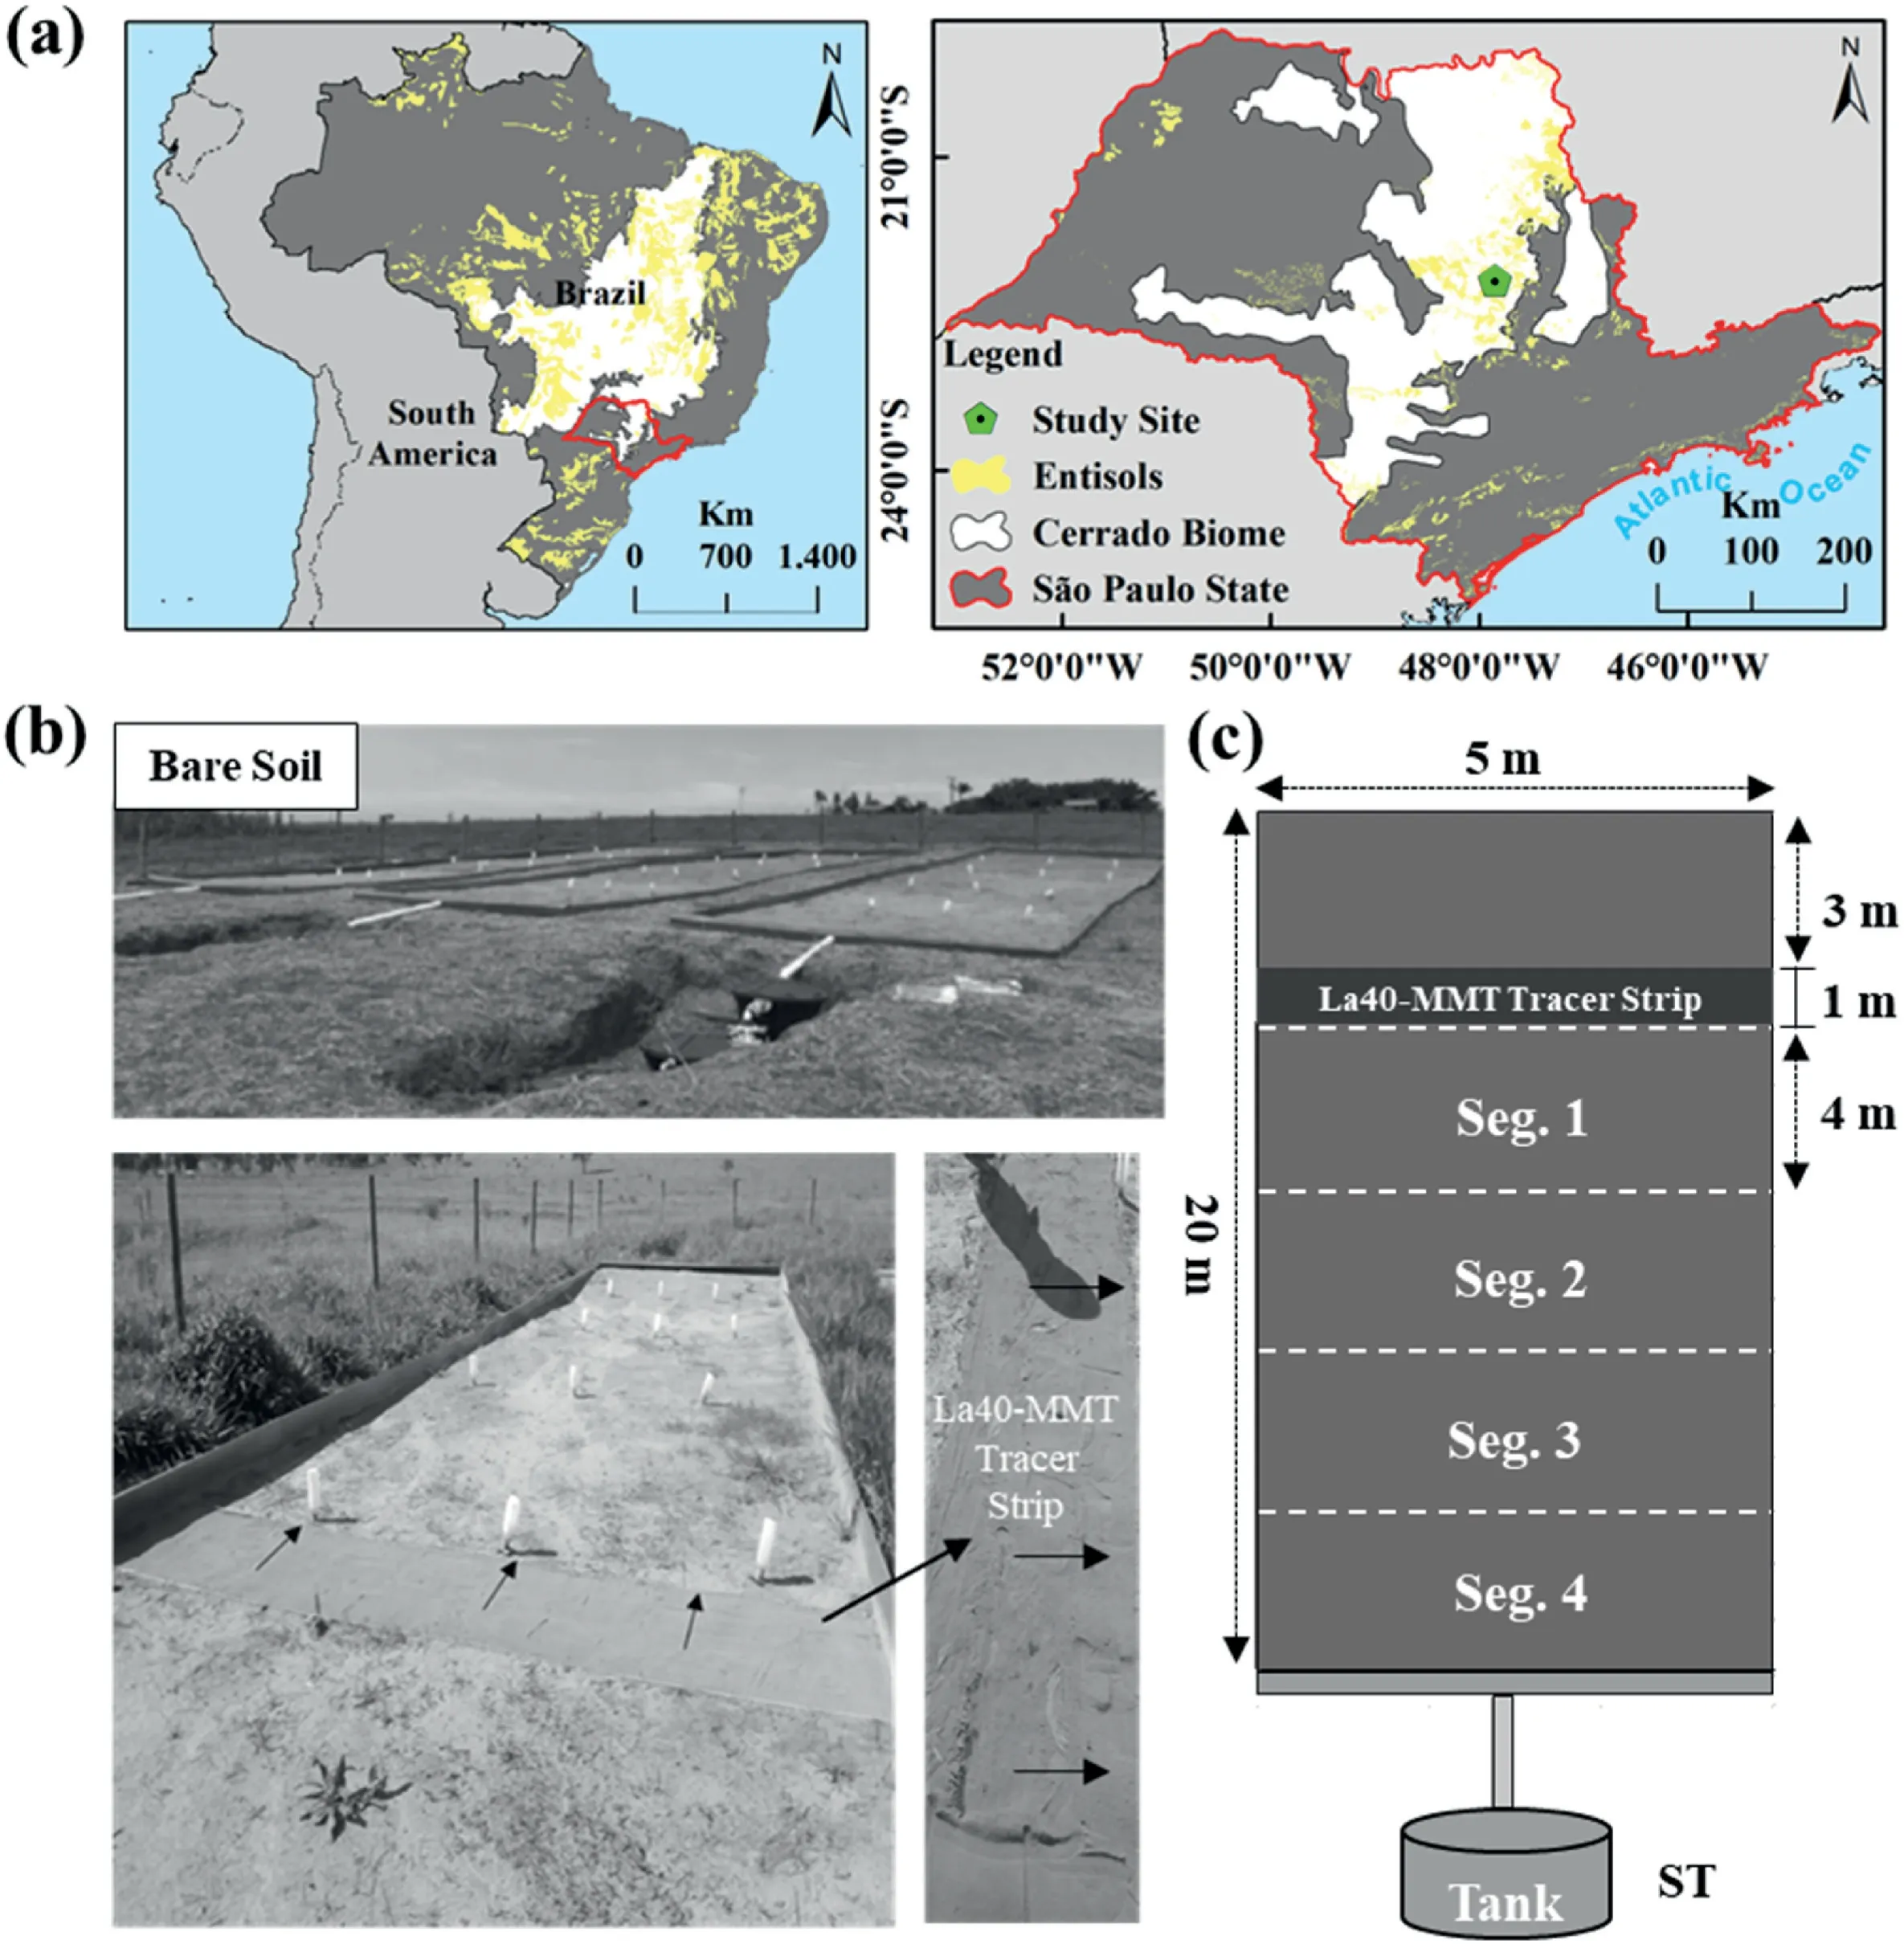
Fig.1.a)Location of the study area in the central region of São Paulo state.The area is in the Cerrado biome under a representative soil(Entisol)of Brazil;b)3 exposed bare soil plots used in the study, plot after filling with soil + La40-MMT tracer mixture, and detailed plot region, where the mixture was applied; c) Schematic illustration of plot, gutter for sediment collection, storage tank, plot portion containing the ground soil + La40-MMT tracer mixture, and delineation of 4 plot segments.
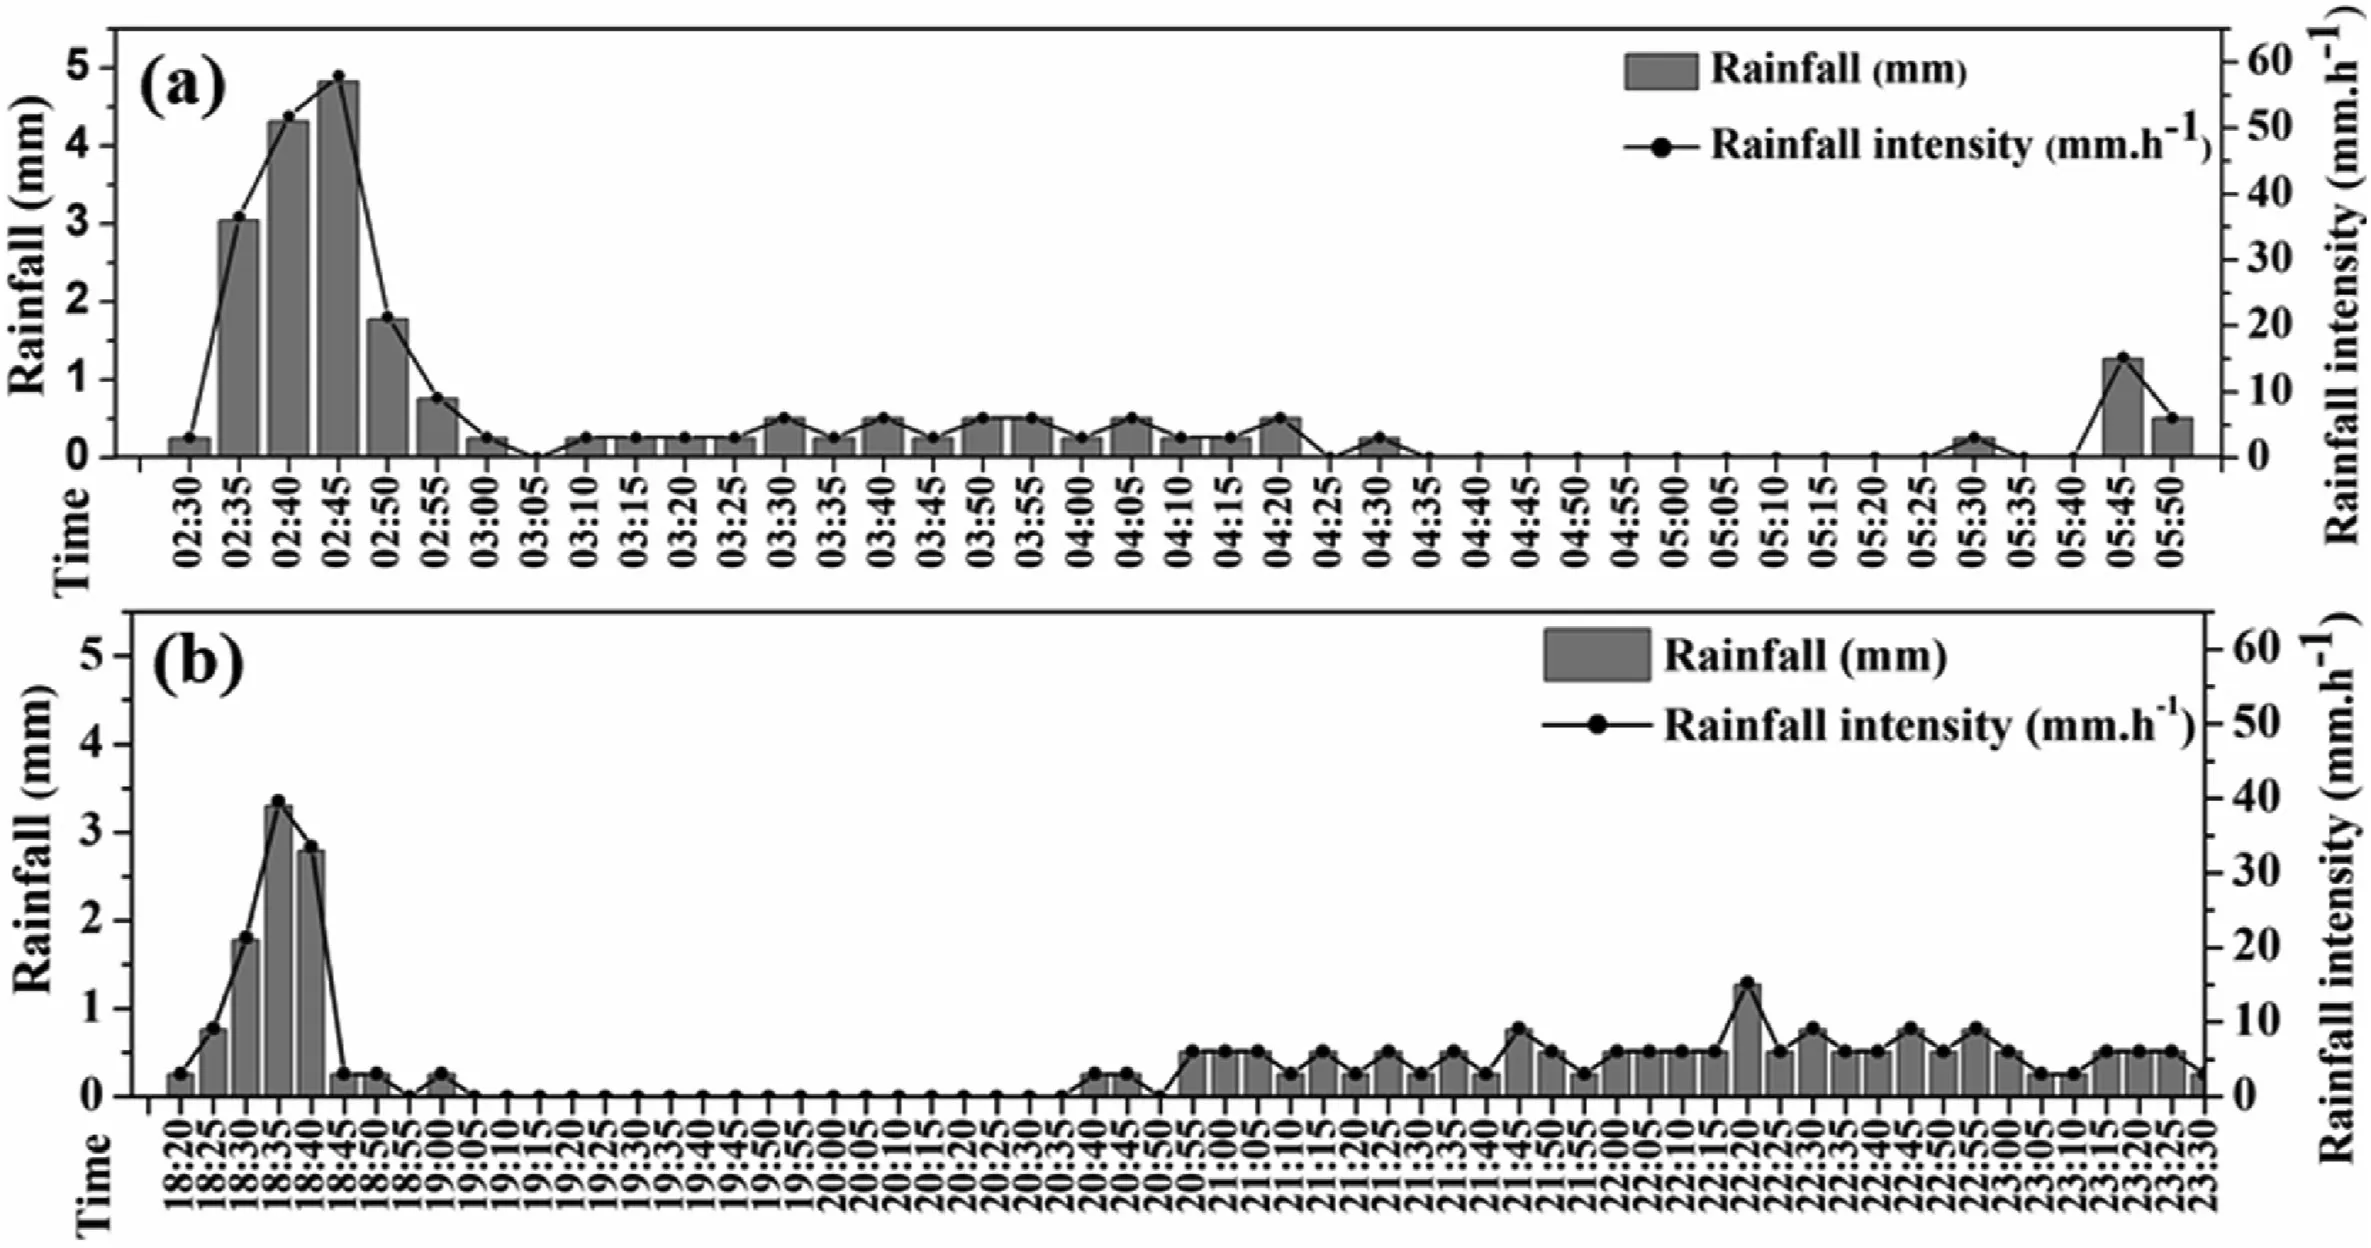
Fig.2.Five-minute rainfall depths (mm) and intensities (mm h-1) of the two rainfall events on March 21, 2018: a) 1st event (02h30 - 05h50); b) 2nd event (18h20 - 23h30).
Field-scale experiments were carried out on exposed bare soil plots at the Arruda Botelho Institute located at Itirapina,the central region of São Paulo state-Brazil(latitude 22°11′5′′S,longitude 47°51′11′′W,altitude 790 m.a.m.s.l)(Fig.1a).This area has been used for studies on soil erosion and water balance alterations due to changes in land use (pasture to sugarcane cultivation) in the Cerrado biome since 2011 (Anache et al., 2018, 2019; Oliveira et al.,2015; Youlton et al., 2016).The local climate is classified as humid subtropical Cwa (K¨oppen classification system), presenting warm weather with dry winters(Anache et al.,2019;Youlton et al.,2016),while the soil is classified as a quartzipsaments with a sandy texture, as detailed in item 2.2.
2.3.2.Design and monitoring
The plots(5 m ×20 m)used in the NRFP tests were positioned on a hillslope with a 10% gradient and monitored in triplicate(Fig.1b and c).These bare soil plots have been kept under zero tillage with manual preparation and glyphosate application to prevent weed growth (Oliveira et al., 2015).
After a rainfall event,surface runoff water and eroded sediments are directed downslope towards a metallic collector positioned at the bottom end of the plot that transports the runoff to tanks mounted below the collector (Youlton et al., 2016).Sediment retained in the collector was weighed,and sediment concentration in the runoff water stored in the tanks was determined gravimetrically.The water volume stored in the tanks was determined using a calibration curve (Youlton et al., 2016).The rainfall data (mm)were recorded every 5 min by a meteorological station (Rainfall Sensor - Hydrological Service TB4, tipping bucket, resolution:0.254 mm and accuracy:±2-3%)installed next to the plots.Before processing the data into Rist software,a manual pre-filtering of the data was performed to verify the existence of apparent outliers.The precipitation parameters are shown in Table 1.Due to the checking procedure and the high reliability of the instrument adopted, no bias correction was performed.
2.3.3.Preparation of experiments
Each plot had a section near the top filled with approximately 43 kg of soil(typic quartzipsamments)+La40-MMT tracer mixture(38.70 kg of soil and 4.3 kg of tracer),achieving Nd3+,La3+,and Pr3+concentrations of 4039.83,3545.01 and 1041.35 ppm,respectively.The mixture was added at 3 m from the upper end of the plot,forming a strip 1 m long, 5 m wide, and 0.005 m thick(Fig.1c).
2.3.4.Natural rainfall events
Two rainfall events were recorded on 3/21/2018, the first starting at 2:30 a.m.and ending at 5:50 a.m.,and the second lasting from 6:20 p.m.to 11:30 p.m.The runoff water volume and sediment mass lost were measured on 03/21/2018 and 03/22/2018,after each event had occurred.
2.3.5.Experimental setup
At the end of each rainfall event,the sediments that reached the tank (ST) were recovered.After two rainfall events, soil samples were also collected from the portion of the plot between the lower limit of the range where the La40-MMT+soil mixture was added to the lower limit of the plot (Fig.1c).This plot portion was divided into four segments (4 m × 5 m) (Seg.1, Seg.2, Seg.3, and Seg.4),from which 25 samples(≅100 g)were collected randomly with a cylindrical sampler 10 cm in diameter to a depth of 1 cm and subsequently mixed to form a single sample per segment.Therefore, each segment had a sampled area of approximately 0.2 m2(25×7.85×10-3m2),1%of the Plot total area(20 m2).The samples collected (ST and Seg.) were dried in an oven at 60°C for 24 h,weighed, macerated with a mortar and pestle, sieved (150 mesh),and finally subjected to ICP-MS analyses for REE quantification.These samples were also subjected to textural analysis using the gamma-ray attenuation technique (Naime et al., 2001).
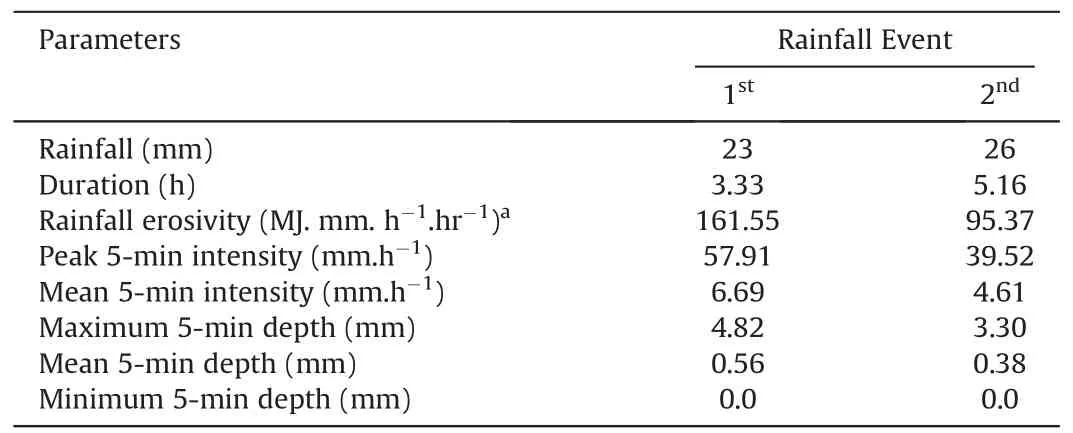
Table 1 Pluviometric characterization of the two rainfall events on 03/21/2018.
2.4.Inductively coupled plasma mass spectrometry (ICP-MS)
The quantification of the La40-MMT tracer in the samples collected from the field-scale(ST and Seg.)tests was carried out by inductively coupled plasma mass spectrometry(ICP-MS)at the SGS Geosol laboratory located in Vespasiano (MG) - Brazil.The REE content(mainly Nd3+,La3+,and Pr3+)of the soil used in both tests was also quantified by ICP-MS.The quantifications were conducted using an IMS95R method (da Costa et al., 2016).In brief, the samples were melted with lithium metaborate in a graphite crucible at 950°C using a 1:10 melting to sample ratio.Next,a standard 1000-fold dilution (0.1 g-100 mL) was applied to the melted sample,followed by acid digestion with 10% nitric acid (HNO3) and 2%tartaric acid(C4H6O6).The samples were then analyzed in duplicate on a PerkinElmer DRC II Elan spectrometer.The equipment was calibrated using a geological standard for REE (GRE - 03 http://www.geostats.com.au/certs/GRE-03.pdf), achieving an accuracy of±10% for a confidence level of 99.73%.The REE contents were expressed in mg kg-1.
2.5.Calculation of the erosion rate and deposition
The erosion rates of the strip where the tracer was applied,obtained for the two rainfall events, were calculated using Eq.(1)(Zhu et al., 2011),
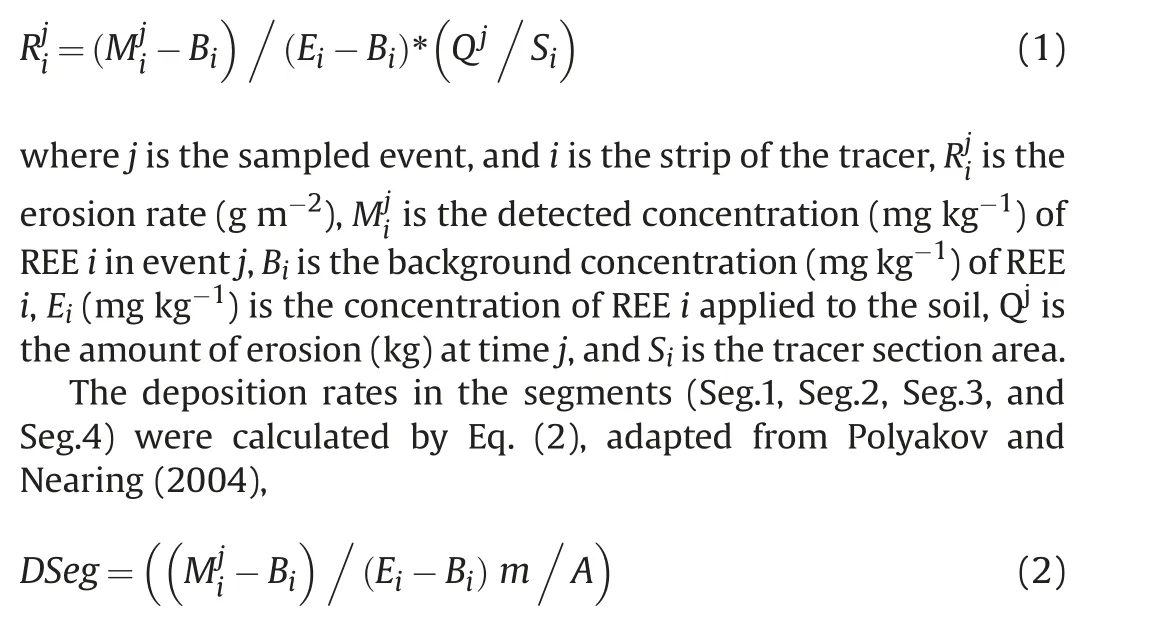
where DSeg is the deposition on Seg.of the plot (kg m2), m is the mass sampled on Seg.(kg) and A is the area of Seg.
The accuracy of the erosion rate estimates was evaluated by calculating the relative error (adapted from Wang et al., 2020) between the estimated soil erosion rates for each REE and the mean value of the REE (Eq.(3)),

2.6.Statistical analysis
The unpaired Student's t-test was applied to the mean values of surface runoff and soil loss to verify the existence of significant differences between the values obtained for the two rainfall events.The correlation between the values of surface runoff and soil loss with the concentration of REE detected in the ST sediments was evaluated by using the Pearson's coefficient(r).This metric was also applied to evaluate the linear correlation between the REE levels found in Seg.1, 2, 3, and 4 and the slope values of these segments(Table S5).Statistical analyzes were performed with a probability level of 95%,using the software RStudio version 4.1.2(R Core Team,2021).
2.7.WEPP-model simulation
2.7.1.Model setup
The WEPP model is a process-based framework with distributed parameters that can simulate runoff and soil erosion event-byevent in agricultural areas (Flanagan et al., 2012).This model has four major components: topography, climate, plant and management, and soil (Flanagan & Nearing, 1995).The first two listed model components (topography and climate) are based on field observations and surveys, which are not subject to parameters’adjustments before simulation.Simulations were done on an event-basis using the hillslope mode within the model interface.We created a slope file for each experimental plot using field topography.Each plot had its profile detailed every meter by direct leveling using a level and a leveling staff.The hillslope profile was sectioned into three Overland Flow Elements(OFE).These elements represent unique combinations of soil, plants, and management(Fig.S1 and Table S1).Climate files were created according to the rainfall data from the two monitored events during the experiment(Table 1).In addition,as we do have 5-min interval rainfall data,the model was run using‘break-point’climate files in the standard subdaily format, considering both events separately.
2.7.2.Model parameterization and performance evaluation
After setting up the topography component for each plot and climate files for each event, we could set up the other remaining model components(plant,management,and soil),which used the same parameterization to simulate all three experimental plots.The plant and management component was set to fallow conditions (bare soil with no plants growing) for all three plots using WEPP model framework default parameters and including information according to the site management (Tables S2 and S3) for each OFE.The soil input parameters files were built for each type of OFE:Soil without tracer(OFE 1 and OFE 3,see Fig.S1)and soil with tracer(OFE 2,see Fig.S1).The effective hydraulic conductivity used in both files was estimated by Anache et al.(2018) at the same study site, using 5-year runoff and soil erosion observed data to calibrate such parameters using model optimization techniques.Soil profile characterization(grain size distribution,organic matter content, and cationic exchange capacity) and albedo were also provided by Anache et al.(2018) and used in all OFEs.In OFE 2,which contains the tracer,we include the particle size distribution for a 50 mm tracer layer added on the top of the soil profile.The rill erodibility and critical shear were set to be estimated by the WEPP model.The initial saturation level and interrill erodibility are significant parameters subject to the site conditions during the observations.
Additionally,the values calibrated by Anache et al.(2018)do not necessarily represent the short-term site period considered in this study.Consequently, the WEPP model was partially calibrated by using the observations from Plot 1 as a reference to reach realistic parameters for both events 1 and 2.Firstly, we iteratively changed the values of the initial saturation level for each event, and we stopped the iterations when we found a modeled runoff value similar to the observation for each event in Plot 1.The initial saturation levels (soil water content) adjusted were 32.00% and 75.00%for rainfall events 1 and 2,respectively,in all OFEs(Tables S4 and S5).Then, the interrill erodibility was interactively estimated for OFE 2(soil with tracer)along both events seeking observed soil detachment values observed with the REE tracer.The interrill erodibility for OFEs 1 and 3 along both events was set to be calculated by the WEPP model along the simulations.
Considering both events run at once, total runoff and sediment delivery were obtained with WEPP and compared with values monitored in the field using the plot collectors and tanks (Anache et al., 2018).Distributed WEPP soil detachment and sediment deposition spatial rate values for each plot were compared with those observed using the La40-MMT tracer (REE): detachment values were selected from a 1-m strip positioned just below the La40-MMT strip in each plot represented in WEPP hillslope projects(Fig.S1) as an Overland Flow Element (OFE), and the deposition values calculated by WEPP were extracted as the average of all negative values generated for each plot from elements positioned after the tracer strip.
The observed soil detachment and deposition values using REE concentrations along the experimental devices needed adjustments to become comparable with the modeling outcomes from the WEPP setup used in this study.Thus, due to the experiment monitoring strategy and logistics along the events, the soil detachment from the tracer strip was determined using the REE concentrations found in the plots’outlet tanks after each event plus a calculated amount of soil that reached areas before the outlet using the concentrations of REE found in the segments after the tracer strip.This tracer and soil amount accumulated in the plot(after the tracer strip) was only monitored after the second event.Thus, we distributed this amount proportionally between the soil detachment values of each event according to its relative size.In this sense, we obtained corrected observed values for soil detachment for each event.We considered soil deposition values for both events from the concentrations measured between the tracer strip and plot outlet after the second event.
The WEPPmodel outcomes were compared to field observations using plots’collectors and tanks(runoff and sediment delivery)and La40-MMT (REE) tracer (soil detachment and deposition).The following statistical metrics were used to assess the agreement between field observations and computation estimates: R2(coefficient of determination); NSE (Nash-Sutcliffe Efficiency coefficient);KGE(Kling-Gupta Efficiency coefficient);RMSE(root mean squared error);and PBIAS(percent bias)(Gupta et al.,2009;Moriasi et al., 2007).
3.Results
3.1.Natural rainfall field-scale plot (NRFP) results
3.1.1.Characterization of rainfall events
Table 1 presents the rainfall characterization and runoff and soil loss values monitored during the two natural rainfall events.
The total rainfall depth and duration of the first rainfall event were less than those of the second event.However,the average and maximum intensities of the first event were 39% and 47% greater,respectively, while the minimum intensity of both events was similar.The rainfall erosivity in the first event was about 69%greater than that observed in the second rainfall event.The highest rainfall intensities in the first and second events were recorded in the first 20 min (Fig.2a and b).
3.1.2.Runoff water, soil loss, and La40-MMT concentration in ST
The values of runoff depth (mm), soil loss (kg), and concentrations (mg kg-1) of Nd3+, La3+, and Pr3+of La40-MMT found in ST after the two rainfall events for each of the plots(P1,P2,and P3)are listed in Table 2.P1 had the greatest water and soil losses in the first rainfall event,followed by P3 and P2.The water losses from P2 and P3 were practically the same and slightly greater than from P1 in the second rainfall event.In contrast,P1 lost more soil in the second event than P2 and P3.
The comparison between the averages (t-student) of surface runoff indicated that the volume generated in the first event was significantly (p = 0.002) greater than that of the second.The average soil loss values between the two events did not show significant differences (p= 0.590);however,the average value in the first event was higher than in the second.
There was no significant correlation between surface runoff values and soil loss (respectively p = 0.352 and p = 0.07) with the REE levels detected in the sediments in ST in the first event.However, the r-values for runoff (0.85) and soil loss (0.99) indicated a strong correlation with REE concentration.In the second event, the correlation between the variables was also not significant(p>0.05).
3.1.3.La40-MMT distribution on the plot surface soil
Fig.3 reports the Nd3+,La3+,and Pr3+contents accumulated in the four segments of each plot (P1, P2, and P3) after the rainfall events.In the three plots, REE levels decreased with increasing distance from the position where the La40-MMT tracer was applied.The greatest REE concentration was verified in Seg.1 of the plots,with the highest value observed in P2,followed by P3 and P1.The decrease in REE concentration (average between Nd3+, La3+,and Pr3+)from Seg.1 to Seg.2 in P1 was significantly smaller(5.5%)than in P2(79.8%)and P3(60.2%).On the other hand,P1 presented percentages of decrease from Seg.2 to Seg.3 and Seg.4 that were very close (29.9% and 27.8%, respectively).The reduction percentages were greater from Seg.2 to Seg.3 in P2 and P3, respectively,53.8% and 46.3%, and lesser from Seg.3 to Seg.4 (15.2% and 17.6%)than the P1 value.
3.1.4.Evaluation of La40-MMT tracer stability
The multi-chemical signature stability of the La40-MMT tracer was also evaluated.The stability tests were defined from the relative contents of Nd3+,La3+,and Pr3+of La40-MMT in relation to the total element concentrations, resulting in the following proportions: Nd3+= 46.88%, La3+= 41.10%, and Pr3+=12.0%.
The values of the average relative proportions of REE obtained in the NRFP of the ST and Seg (Nd3+= 48.46%, La3+= 38.66%, and Pr3+= 12.88%) were similar to those found in the La40-MMT.The small difference between these values strongly suggests the high stabilityof the La40-MMT'smulti-chemicalsignature at the field scale.
3.2.Field measurements,La40-MMT(REE)tracer,and WEPP model outcomes comparison
Soil loss rates per unit area (kg m2) of the two rainfall events calculated by the tracer's REE contents(average of the REE)and by the WEPP model for the strip of the plot where La40-MMT was applied are shown in Fig.4.P1 and P3 had the highest soil loss rates(1.077 and 0.963 kg m2respectively)in the first rain event,and P2(0.260 kg m2)the lowest.The estimates for the second event do not accurately portray the soil loss rates of the specific section where the tracer was applied, as there was a remaining concentration of La40-MMT that was deposited during the first event.However, P2 and P1 had the highest rates (0.775 kg m2and 0.633 kg m2), followed by P3(0.597 kg m2).Low values of standard deviation were observed for soil loss estimates in the plots obtained from the average of the three REE of La40-MMT in the first and second rainfall events (Fig.4).
The soil loss rates calculated by the WEPP model showed the same trend observed by the La40-MMT approach in the three plots in the first event.However, the WEPP model simulated greater erosion values for P2 and P3,and a similar value for P1 compared to the tracer measurements.In the second event, the erosion rates calculated by WEPP were overestimated for P1 and P3, and underestimated for P2.
Relative error values(Table S6)obtained for each REE were less than 10%,ranging from 0.7 to 7.5%,with a mean equal to 3.4%,while the mean values of the REE ranged from 1.9 to 5.0%.The results indicated a subtle improvement in the accuracy of the values,especially about La3+and Pr3+, compared to the mean REE values.
Sediment deposition rates were calculated after the two rainfall events by the La40-MMT tracer and WEPP Model for Segs.1, 2, 3,and 4 of P1,P2,and P3 are shown in Fig.5.Note that the deposition rate decreases in the three plots as one moves away from the section where the La40-MMT tracer was applied (Seg.1 to Seg.4),exhibiting an exponentially decreasing trend.The greatest deposition rates were observed in Seg.1 of the plots,where the P2 and P3 values were 69%and 61%higher than in P1.On the other hand,P1 had the greatest slope gradient(8.75%),compared to P2(8.0%)and P3(8.25%)in this segment(Table S7).Decreases in deposition rates between Seg.1 and Seg.2 in P2 (83.5%) and P3 (60.2%) were significantly greater than in P1(5.4%).On the other hand,the reduction in deposition rates from Seg.1 to Seg.4 in P1 was lower(52.1%)than in P2 (92.1%) and P3 (82.5%).
Table 3 shows the values of correlation(r)and significance level(p) between the deposition and slope rates (Table S7) for the four segments of the three plots.Correlation coefficients were calculated considering the deposition values(mean between the values obtained for Nd3+, La3+and Pr3+) and slope between the three plots (P1, P2, and P3) for each of the four segments.The r and p values indicated a very strong and significant negative correlation between the rates of deposition and the slope of the plots for Seg.1.The values of deposition decreased with increasing slope.Although not significant,Seg.2 showed the same trend observed in Seg.1 and a large r-value (-0.91).The values obtained for Seg.3 and Seg.4indicated positive and non-significant correlations.Evaluating Seg.1 and Seg.2 together, there was a strong negative (r = -0.87)and significant (p = 0.03) correlation.

Table 2 Average Nd3+,La3+,and Pr3+ concentrations(mg kg-1)of La40-MMT obtained in the sediments collected in drainage tanks(ST)from three replicate plots after two natural rainfall events± st.dev.
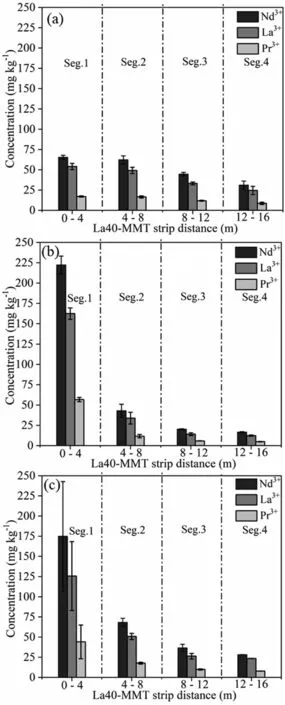
Fig.3.Concentrations(mg.kg-1)of Nd3+,La3+,and Pr3+(n=3±st.dev)in the four soil segments of P1 (a), P2 (b) and P3 (c) after the 2 rain events (sampled area per segment: 0.2 m2, depth: 1 cm).
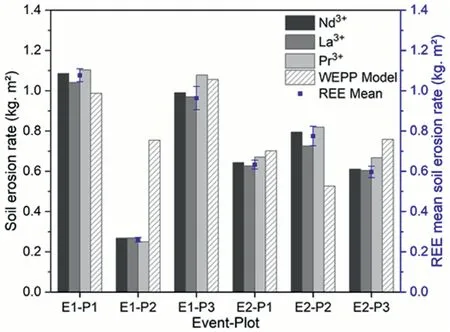
Fig.4.Soil erosion rates per unit area calculated from simulations with the WEPP model,concentration of REE(Nd3+,La3+,and Pr3+),and average values of REE of La40-MMT for P1, P2, and P3 in the two rainfall events.
WEPP model outcomes were compared with the field observed data (Fig.6).Runoff and sediment delivery (Fig.6a and c, respectively)showed satisfactory results compared to the observed data,which does not use the REE tracer tested in the observation methodology.Thus, these results validate the WEPP model as a reliable predictor for soil erosion processes and can be a reference for testing the REE in detachment and deposition predictions,which are also WEPP model outcomes.In this sense,it is possible to see a clear agreement between the WEPP model soil detachment and deposition values with the estimates made with the REE tracer analysis along with field observations (Fig.6b).
The agreement between field plots and the hillslopes implemented in WEPP can be checked using the outcome distributions(Fig.6a, b, and 6c).There was a strong correlation between WEPP and field observations concerning runoff (Fig.6a).This behavior was also observed when REE deposition and detachment estimates were compared with WEPP outcomes (Fig.6b).These satisfactory observations were also confirmed by the performance evaluation metrics(Table 4).However,sediment delivery(Fig.6c)predictions had poorer agreement between WEPP results and field observations in comparison with runoff and soil detachment and deposition outcomes,despite other acceptable metrics(Table 4),but with a lower model performance (NSE and KGE) when compared with the other variables.Additionally,PBIAS values reveal that the WEPP model overestimated runoff, detachment, and deposition, and sediment delivery when the outcomes are contrasted with field data (Table 4).
4.Discussion
4.1.Effect of intensity and kinetic energy of rain on runoff and soil loss
The greatest values of rainfall erosivity energy and maximum and average rainfall intensities in the first event are reflected in the greatest average volume of surface runoff and soil loss (although not significant) obtained for this event.Several reports have disclosed the influence of precipitation intensity and rainfall erosivity on runoff and soil loss (Anache et al., 2018; Mohamadi & Kavian,2015; Shen et al., 2016; Wischmeier & Smith, 1958; Wu et al.,2018; Ziadat & Taimeh, 2013).The narrow precipitation pattern of the first rainfall,with a longer incidence period(3h10 to 4h30)after the precipitation peak(2h30 to 3 h),possibly also contributed to the larger runoff and soil loss values in this event.Thus,it is suggested that the first rainfall had the greatest erosion potential.
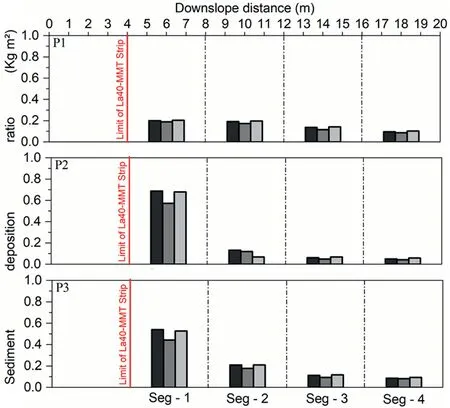
Fig.5.Sediment deposition rates estimated by La40-MMT tracer from the Seg.1, Seg.2, Seg.3, and Seg.4 of P1, P2, and P3 after the two rainfall events.

Table 3 Correlation coefficients (r) and significance level (p) between deposition rate and slope from the four segments.

Table 4 WEPP model performance evaluation using field observed data as a reference.
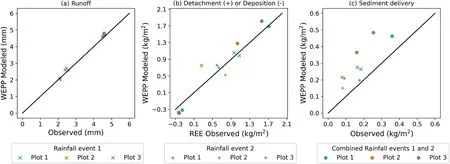
Fig.6.Comparison of field observed data and WEPP model(event 1,event 2,and events 1 and 2 combined)outcomes considering the three experimental plots for(a)runoff(n=9),(b) detachment (n = 9) and deposition (n = 3), and (c) sediment delivery (yield) (n = 9); Abbreviations: Rare Earth Elements tracer (REE).
The difference between the values of surface runoff and soil loss observed in P1, P2, and P3 in the two monitored rainfall events reveals high heterogeneity among the replicate plots.This can be attributed to the unequal condition of the plot surfaces due to the long monitoring period (since 2011), which may have generated different relief configurations in each of the plots, and as we suggested,the varying slope surface gradients of the plots as shown in Table S7.
4.2.La40-MMT translocation in rain events
Our study demonstrated through the REE concentrations detected in the sediments translocated to ST of P1,P2,and P3 in the first event that the tracer La40-MMT could reproduce the erosion rates that occurred in the plots.The REE contents found in the ST of the three plots were proportional to the soil loss values.
The strong correlation between the soil loss values and the levels of REE detected in the sediments indicated by the high value of R2equal to 0.99(Fig.S2.),despite being significant only for La3+(p=0.01),suggests that the soil and La40-MMT eroded at the same rate.
This result corroborates with those obtained by Zhang et al.(2001, 2003), Polyakov et al.(2004), Polyakov and Nearing(2004), and Stevens and Quinton (2008), who used the method of mixing REE oxides in the soil.It also confirms that La40-MMT worked as a tracer and could demonstrate the heterogeneity between the three plots through soil losses from the first event.Preliminary results of this study also demonstrated that the erosion rates calculated from the average of the three REE could improve the accuracy of the estimates.The results obtained indicate that La40-MMT can be used as a potential tool to identify sediment sources and estimate erosion rates.
4.3.La40-MMT spatial distribution pattern in the plot
The three plots showed the same distribution pattern of La40-MMT with a decrease in REE levels from Seg.1 to Seg.4.This deposition trend was also observed in studies by Matisoff et al.,2001, Zhang et al.(2003), Polyakov and Nearing (2004), Stevens and Quinton (2008), and Zhang et al.(2017b) using REE oxides.The lower deposition rate observed in Seg.1 of P1 may be associated with the greater slope (Table S7) verified in this segment (8.8%)when compared to P2 (8.0%) and P3 (8.3%).It suggested that this factor has contributed to the volume and flow velocity increase,favoring the transport of a greater amount of La40-MMT from the source (range 3-4 m).It is also suggested that the higher concentration of La40-MMT deposited in Seg.3 and Seg.4 of P1 can be explained by this factor, which resulted in greater transport distances.
Correlation analysis (deposition rate vs.slope) showed that the slope factor could explain the variation in deposition rates in Seg.1 and Seg.2 in the three plots.It is believed that La40-MMT was transported by a laminar flow that created a uniform front with a concentration gradient being a function of slope and distance from the source.In Seg.3 and Seg.4, the notorious presence of preferential flow paths formed in this region possibly interfered with the deposition process, together with the source distance factor.
4.4.Tracer stability La40-MMT at NRFP
This study confirmed the high degree of stability of the chemical signature of the tracer (Nd3+,La3+, and Pr3+)at the two collection points (ST and Seg.) for the three plots.
It agrees with the chemical stability results reported by Villela et al.(2020), also confirming the applicability of La40-MMT as a tracer for plot-scale studies.Applicability on even larger scales may be possible, however it would need to be confirmed through additional studies.
The high degree of stability of the multi-chemical signature of the tracer makes this possible to minimize the errors incurred by the ICP-MS analysis through the average value of the contents of the three elements.This can result in improved estimates of erosion and sediment deposition rates.Another advantage of using the tracer's multi-chemical signature is the identification of La40-MMT in the environment through the concentration relative proportion of each element about the sum of the three elements contents(Nd3+=46.88%,La3+=41.11%,and Pr3+=12.01%).This advantage made La40-MMT detection possible at very low levels in the sediments without being confused with the background concentration of the elements in the soil.On the other hand,we recognize that a disadvantage of using more than one REE as a chemical signature is the reduction in the possibility of identifying a large number of sediment sources.However, using the composite signature can improve the accuracy in obtaining spatially distributed erosion data, contributing to the validation of physically-based erosion models.
Regarding the tracers proposed by Mahler et al.(1998) and Spencer et al.(2011) that used the same development principle(clay labeled with REE), the most attractive feature of using La40-MMT is its low production cost.Since La40-MMT is a low-cost industrial waste product,it can be more economically used for tracer studies in larger areas, though continued validation of the tracer may be needed to fully realize that outcome.
4.5.Field measurements,La40-MMT(REE)tracer,and WEPP model outcomes comparison
The results presented by the WEPP model for the total runoff and soil detachment and deposition, and sediment delivery agree with the values measured in the field for the rainfall events considered in this study,as already observed in the same study area for five years of calibration and validation of the model (Anache et al., 2018).However, the metrics (Table 4) showed that surface runoff was better represented by WEPP in event simulations than soil loss and deposition,and sediment delivery.In contrast,when using the model set to a longer continuous simulation(break-point data as climate input for a 5-year period)the opposite was observed:WEPP prediction for soil loss performed better than for runoff at the same study site of the current study(Anache et al.al.,2018).
All these arguments reinforce the WEPP model efficiency to simulate accurate values in an event-based approach and using available field data and model database parameters.With favorable metrics for the reliability of the model in the study area for surface runoff and sediment delivery predictions (Table 4), values of detachment and deposition estimated with WEPP model in a distributed way for the plots can be assessed with the values determined in the field with the REE tracer for these same variables.
Zhang et al.(2005)obtained 0.511 NSE efficiency comparing the WEPP estimates for deposition and soil detachment to observed values determined with REE, considering only the erosion in a furrow within their adopted experimental design.In the case of the present work, WEPP model efficiency was greater than 0.80,considering the metrics used (NSE and KGE).However, the size of this dataset was smaller in comparison to Zhang et al., (2005).Furthermore, the experimental conditions were different: in this study, soil losses from interrill areas under natural rainfall were monitored,while Zhang et al.(2005)utilized simulated rainfall and rill erosion, as also did Zhang et al.(2008).Finally, observations of soil detachment and deposition using REE needed to be adapted(as explained in the methods section) to become comparable with WEPP estimates.Thus, we recommend for the following studies that soil detachment and deposition should be observed after all events,creating more points of comparison between estimates and observations.Therefore,this work contributes by bringing evidence that La40-MMT (REE) used as an emergent tracer to characterize detachment and deposition processes,agrees with results extracted from the simulation of the same variables with the WEPP model,which has already been validated with a calibrated model for this study area.
5.Conclusion
This study evaluated the potential of the La40-MMT tracer to provide estimates of erosion rates and identify patterns of soil redistribution using erosion plots (NRFP: 20 m × 5 m) under natural rainfall and modeling (WEPP Model).The potential of La40-MMT to provide erosion rates and identify patterns of soil redistribution in the plots,in addition to identifying the heterogeneity of the erosive processes occurring in the plots,was confirmed.
The multi-chemical signature stability of La40-MMT (Nd3+,La3+, and Pr3+) was also confirmed by field-scale experiments, as little variation was found among the REE relative proportions in the sediments.The high degree of stability of the tracer's multichemical signature can be exploited to reduce the analytical uncertainties of the ICP-MS measurements by calculating the average soil loss using the three REEs.The La40-MMT tracer (REE)method indicated that the WEPP model could estimate soil detachment and deposition considering interrill processes under natural rainfall,as their estimates agreed for the monitored events.Therefore, the La40-MMT tracer can be applied as an effective tool to identify soil redistribution patterns in the landscape.Real-scale applications of this water erosion tracer are particularly favored due to its low production cost, high stability, and facilitated detection in the environment provided by its multi-chemical signature.The results observed at the field scale indicated that the La40-MMT tracer is a potentially viable method for monitoring catchments and basins.
Declaration of competing interest
The authors declare that they have no known competing financial interests or personal relationships that could have appeared to influence the work reported in this paper.
Acknowledgments
The authors gratefully acknowledge the financial support and facilities provided by Coordination of Superior Level Staff Improvement- Brazil (CAPES) - Finance code 001, São Paulo State Research Foundation FAPESP (grant numbers #2015/03806-1),Brazilian Agricultural Research Corporation - EMBRAPA Instrumentation-São Carlos/SP,National Nanotechnology Laboratory for Agribusiness (LNNA) and Computational Hydraulics Laboratory -LHC (EESC/USP), and Arruda Botelho Institute- IAB.
Appendix A.Supplementary data
Supplementary data to this article can be found online at https://doi.org/10.1016/j.iswcr.2023.05.003.
杂志排行
International Soil and Water Conservation Research的其它文章
- Atlas of precipitation extremes for South America and Africa based on depth-duration-frequency relationships in a stochastic weather generator dataset
- Saturation-excess overland flow in the European loess belt: An underestimated process?
- Streamflow prediction in ungauged catchments by using the Grunsky method
- Towards a better understanding of pathways of multiple co-occurring erosion processes on global cropland
- Calibration,validation,and evaluation of the Water Erosion Prediction Project (WEPP) model for hillslopes with natural runoff plot data
- Long-term trends of precipitation and erosivity over Northeast China during 1961-2020
