Saturation-excess overland flow in the European loess belt: An underestimated process?
2023-03-22VlntinLnminOlivirCrnThomsGrngonRosliVnrommBnoitLignlOlivirEvrrstinSlvorBlnsPtrikLy
Vlntin Lnmin , Olivir Crn ,*, Thoms Grngon , Rosli Vnromm ,Bnoit Lignl , Olivir Evrr , Sˊstin Slvor-Blns , J.Ptrik Ly
a BRGM, F-45060, Orlˊeans, France
b University of Rouen, M2C, Rouen, France
c Laboratoire des Sciences du Climat et de l’Environnement(LSCE/IPSL),Unitˊe Mixte de Recherche 8212(CEA/CNRS/UVSQ),Universitˊe Paris-Saclay,Gif-sur-Yvette, France
d University of Tours, UR 6293 - GˊeoHydrosystˋemes Continentaux (GEHCO), France
e Alberta Environment and Protected Areas, Calgary, Canada
Keywords:European loess belt Soil erosion Saturation-excess runoff WaterSed model
A B S T R A C T A major challenge in runoff and soil erosion modelling is the adequate representation of the most relevant processes in models while avoiding over parameterization.In the European loess belt, progressive soil crusting during rainfall events, resulting in infiltration-excess runoff, is usually considered the dominant process generating runoff on catchments covered with silty soils.Saturation-excess may also occur and affect their runoff and erosion behavior.However,saturation-excess runoff occurrence and quantification have rarely been performed and is usually not taken into account when modelling runoff and erosion in these environments.Accordingly,a continuous simulation of the Austreberthe catchment(214 km2), located in the European loess belt (Normandy, France), was conducted with the new Water and Sediment (WaterSed) model over 12 years, corresponding to more than 780 individual rainfall events, at a 25 m spatial resolution.The inter-annual variability of runoff and erosion was closely linked to the number of intense events per year and their distribution through the year.The model was properly calibrated over a representative set of 35 rainfall events, considering either infiltration-excess and/or saturation-excess runoff.It was also able to reproduce the measured runoff volume for most of the monitoring period.However,the three years with most rainfall were adequately modelled only including saturation-excess runoff.An analysis performed at the seasonal scale revealed that saturation was modelled in the catchment during almost all of the modelling period, suggesting the importance of this often overlooked process in current modelling attempts.
1.Introduction
Managing soil degradation on arable lands is a major challenge worldwide.In Europe, most rural catchments have undergone strong modifications to facilitate the intensification of agriculture(Robinson & Sutherland, 2002) resulting in numerous on-site and off-site impacts (Stoate et al., 2001; Tarolli & Sofia, 2015).On-site,soil erosion may result in the loss of topsoil, decreasing soil productivity (Durˊan Zuazo & Rodríguez Pleguezuelo, 2008).Off-site,accelerated soil erosion often results in the degradation of downstream waterbodies and the propagation of muddy flows(Ballantine et al., 2009; Collins & Walling, 2007; Kronvang et al.,2003; Shields et al., 2010; Walling et al., 2003).
Regions of intensive agricultural production on the European loess belt have been particularly affected by on-site and off-sites impacts of soil erosion.In central Belgium, off-site soil erosion is estimated to cost between 25 and 75 million euros per year, corresponding to 40 to 120 euros for each ha of arable land (Patault et al., 2021; Van Oost et al., 2002).Several research efforts have therefore been devoted to analyze and quantify the temporal variability and the spatial extent of the areas the most affected.The results pointed out strong spatial and temporal heterogeneities according to the variation of climate forcing and/or the land use evolution as well as the importance of scale effect when moving from the plot to the catchment scale (Cerdan et al., 2004; Delmas et al., 2012).Therefore, knowledge of the spatial variability in sediment production and the identification of the main sediment pathways within the landscape are important.
To this end, different types of erosion models have been developed to improve our understanding of sediment dynamics(Aksoy & Kavvas, 2005; De Vente & Poesen, 2005; Merritt et al.,2003).These models differ in terms of their complexity, their inputs requirements, the processes they represent, the manner in which these processes are implemented, the scale of application and the types of output information they provide(e.g.Merritt et al.,2003).Fully distributed physically-based models can accurately describe runoff and erosion processes although calibration and model application require significant parametrization.Conversely,empirical models, such as the RUSLE (Revised Universal Soil Loss Equation)(Renard et al.,1997),are frequently used in preference to more complex models because of limited data and parameters requirements, though their ability to comprehensively represent processes at the catchment scale has been questioned (Borrelli et al., 2021; Verstraeten et al., 2007).Expert-based models, such as the Sealing and Transfer by Runoff and Erosion related to Agricultural Management (STREAM) model (Cerdan et al., 2001;Souchere et al., 1998) provide a compromise focusing on the dominant factors driving runoff and erosion in order to avoid overparameterization and the associated uncertainties.
On cultivated areas on the European loess belt, soil surface crusting, surface roughness, total cover (e.g.crops, residues) and antecedent moisture content have been identified as the main determinants of infiltration rates,runoff generation and erosion at the field scale (Chaplot& Le Bissonnais, 2000; Le Bissonnais et al.,1995, 2005).In particular, in the western Paris Basin, France, decision rules were derived by expert judgment based on databases of field measurements to convert soil surface characteristics into soilrelated input variables (e.g.infiltration rate, imbibition and soil erodibility (Grangeon et al., 2021).Through incorporating expertbased decision rules, the STREAM model is an effective model which provides runoff and erosion predictions in regions where hortonian overland flow dominates (Cerdan, Le Bissonnais,Couturier, & Saby, 2002, 2001; Evrard et al., 2009; Cantreul et al.,2019).Although effective at the field and small catchment scale(Cerdan et al., 2002b, 2004), the surface runoff and erosion response from the small catchment(10 km2)to the large catchment(100-1000 km2) is still poorly characterized for the Western Paris Basin.
Extensive multi-scale field surveys have provided crucial information on the nature and the cause of the scale dependency generally observed for runoff and erosion (Parsons et al., 2006;Wilcox et al., 2003; Yair & Raz-Yassif, 2004).Surface runoff and erosion rates are commonly reported to dramatically decrease with the spatial scale,because of the non-linearity of runoff and erosion processes (Gomi et al., 2008; Moreno-de las Heras et al., 2010;Wainwright, 2002).In temperate cultivated environments of the Northwestern European loess belt, observed variations in runoff coefficients can range from 30 to 50%for experimental plots to less than 1% for river basins (Delmas et al., 2012; Le Bissonnais et al.,1998).Re-infiltration was identified as a major processes driving this scale dependency on hillslopes and when incorporating this process into the STREAM model,Cerdan et al.(2004)reproduced a decreasing trend for the observed runoff coefficient from the plot scale (500 m2) to the small catchment scale (11 km2).
The decreasing trend of runoff coefficients and erosion rates should be modelled according the location of the sources of runoff and sediment and their connection to the flow network(Cammeraat, 2004; Cerdan et al., 2004).Therefore, the relative position,the extent,and the connectivity between areas producing surface runoff/erosion and the infiltrating/deposition areas, link field and small catchment scales (Cerdan et al., 2004; Gumiere et al., 2011).
There is therefore a long history of runoff and soil erosion research in the European loess belt since several decades from the plot to the small catchment scale (1 m2to 1-10 km2) in Belgium,The Netherlands, England, Germany or Poland.Much less studies have investigated the disparity between erosion rates measured at small spatial scales with rates of denudation at larger spatial scales(e.g.river basins with a premanent hydrologic network).For empirical models,scaling up erosion rates is achieved with a simple approach to simulate the decreasing trend by applying spatially distributed or regionalized runoff or sediment delivery ratios(Fernandez et al., 2003; Fu et al., 2006; Vigiak et al., 2012).There remains considerable uncertainty regarding the ability of this approach to accurately simulate the spatial variability of water and soil redistribution dynamics.
In process-based models, sediment deposition is simulated according to topographic and vegetation cover thresholds (mainly slope and roughness) that affect the flow velocity.For example, in the STREAM model, for each threshold, a suspended sediment concentration for the transport capacity was defined based on experimental studies and fields surveys (Cerdan, Le Bissonnais,Couturier, et al., 2002; 2002b).Values of these thresholds are therefore adapted to scales ranging from the hillslope to the headwater catchment scale.Indeed most of the models that have been developed or applied in the context of the European loess belt are based on concepts that are most suited to reproduced hillslope geomorphology processes.They consider that the soil surface is the limiting factor in terms of infiltration (mostly hortonian runoff,with or without taking into account soil crusting processes).At the hillslope scale,and for a single event this hypothesis is acceptable.However,there is a need to tests these concepts on larger temporal(several decades) and spatial scales (more than 100 km2).
However, a limited number of erosion numerical models can account for both saturation-excess and infiltration-excess runoff,limiting their ability to represent catchments dynamics under various intra- and inter-annual rainfall depth variations.In this study, we therefore describe a new runoff and erosion model: the WaterSed (Water and Sediment).Based on the STREAM (Cerdan et al., 2001) and LISEM (De Roo et al.,1996) concepts, we develop a process-based model that focus on the dominant processes.Its main novelty is to be able to allow simulations of large catchment over several years (to reflect the diversity of initial conditions in terms soil surface conditions and soil saturation)while avoiding too many equifinality issues and that it permits to test the relative importance of both saturation-excess and infiltration-excess runoff at the catchment scale.The model was tested using an extensive dataset including 12 years (September 1998-August 2011) of measured rainfall,discharge,suspended sediment concentration as well as land use scenario,collected in Upper Normandy,France.The combined effects of both crusting on agricultural fields and large temporal rainfall variability were studied, and their consequences on runoff and erosion modelling were highlighted.More specifically, we tested the hypothesis that saturation-excess may be a relevant process to consider in modelling approaches even on soils that may be affected by surface crusting, and tried to quantify its importance.
2.Material and methods
2.1.Study site
The Austreberthe catchment (214 km2) is located in Upper Normandy, France(Fig.1).
The region is characterized by loess plateaus of moderate elevation (<300 m) mainly covered by crops (53.7%), pastures(29.7%), forests (9.5%) and urban areas (5.8%), and incised valleys exhibiting steep slopes (mean 5%, maximum 30%),mainly covered by forests and grasslands.The geology is composed of a sedimentary substratum,mainly Upper Cretaceous chalks,covered by claywith-flints, Tertiary sandy-clay residual deposits and loess(Hauchard & Laignel, 2008; Laignel et al., 1999; Quesnel et al.,1996).The region's climate is moderate oceanic with annual average temperature of approximately 13°C (Delmas et al., 2012).
The catchment hydrology over the study period was characterized by relatively wet years during the 1999-2001 period(rainfall depth was 26% above the mean of 964 mm) and dry years during the 2003-2006 and 2009-2010 periods (rainfall depth was 12%and 25% below the mean, respectively) (Fig.2).Consequently,runoff was low during 2003-2006 and 2009-2010.Of note, the runoff was very high during the 1999-2001 wet period;runoff was 97% above the mean, continuously increasing over the course of this period.
2.2.Discharge and suspended sediment concentration measurements and analysis
Two different data sets were used in this study (Fig.3).First,high frequency discharge and Suspended Sediment Concentration(SSC) measurements were acquired in previous research on the Austreberthe River(Laignel et al.,2006,2008).Measurements were performed at 30-min time steps between January 2002 and May 2003.Rainfall time series was acquired from using a gauge station at 0.2 mm resolution.Then, a daily discharge time series was acquired over the period September 1998-August 2010.Rainfall over this period was extracted from the SAFRAN database(Durand et al.,1993).
Runoff was estimated from the discharge time series using the methodology proposed by Lyne and Hollick (1979).In the following, only runoff will be considered.
Rainfall events were defined as events with rainfall depth higher than 2 mm, and separated from another event by 24 h without rainfall.Flood events were defined manually for 30 min time series by identifying the beginning of the rising limb and the end of the falling limb.For daily time series,we assumed that the daily runoff volume was generated by the corresponding daily rainfall.In total,35 coupled rainfall-runoff events were extracted for 30 min time series and 782 events for daily time series.
For each of these coupled events, the following variables were calculated:rainfall depth(mm),rainfall duration(minutes),rainfall depth over the previous 48 h (mm), maximum rainfall intensity(mm.h-1), runoff volume (m3), runoff duration (h), runoff peak(m3.s-1), and suspended sediment load(t).
2.3.Catchment characteristics and model preprocessing
2.3.1.DEM and stream network
The Digital Elevation Model(DEM)was extracted from BD Alti®,providing elevation at a 25 m spatial resolution.Depressions were filled according the algorithm developed by Wang and Liu (2006).The stream network location and width were extracted from BD Carthage 2013® and used for stream burning.
2.3.2.Land use and soil surface characteristics
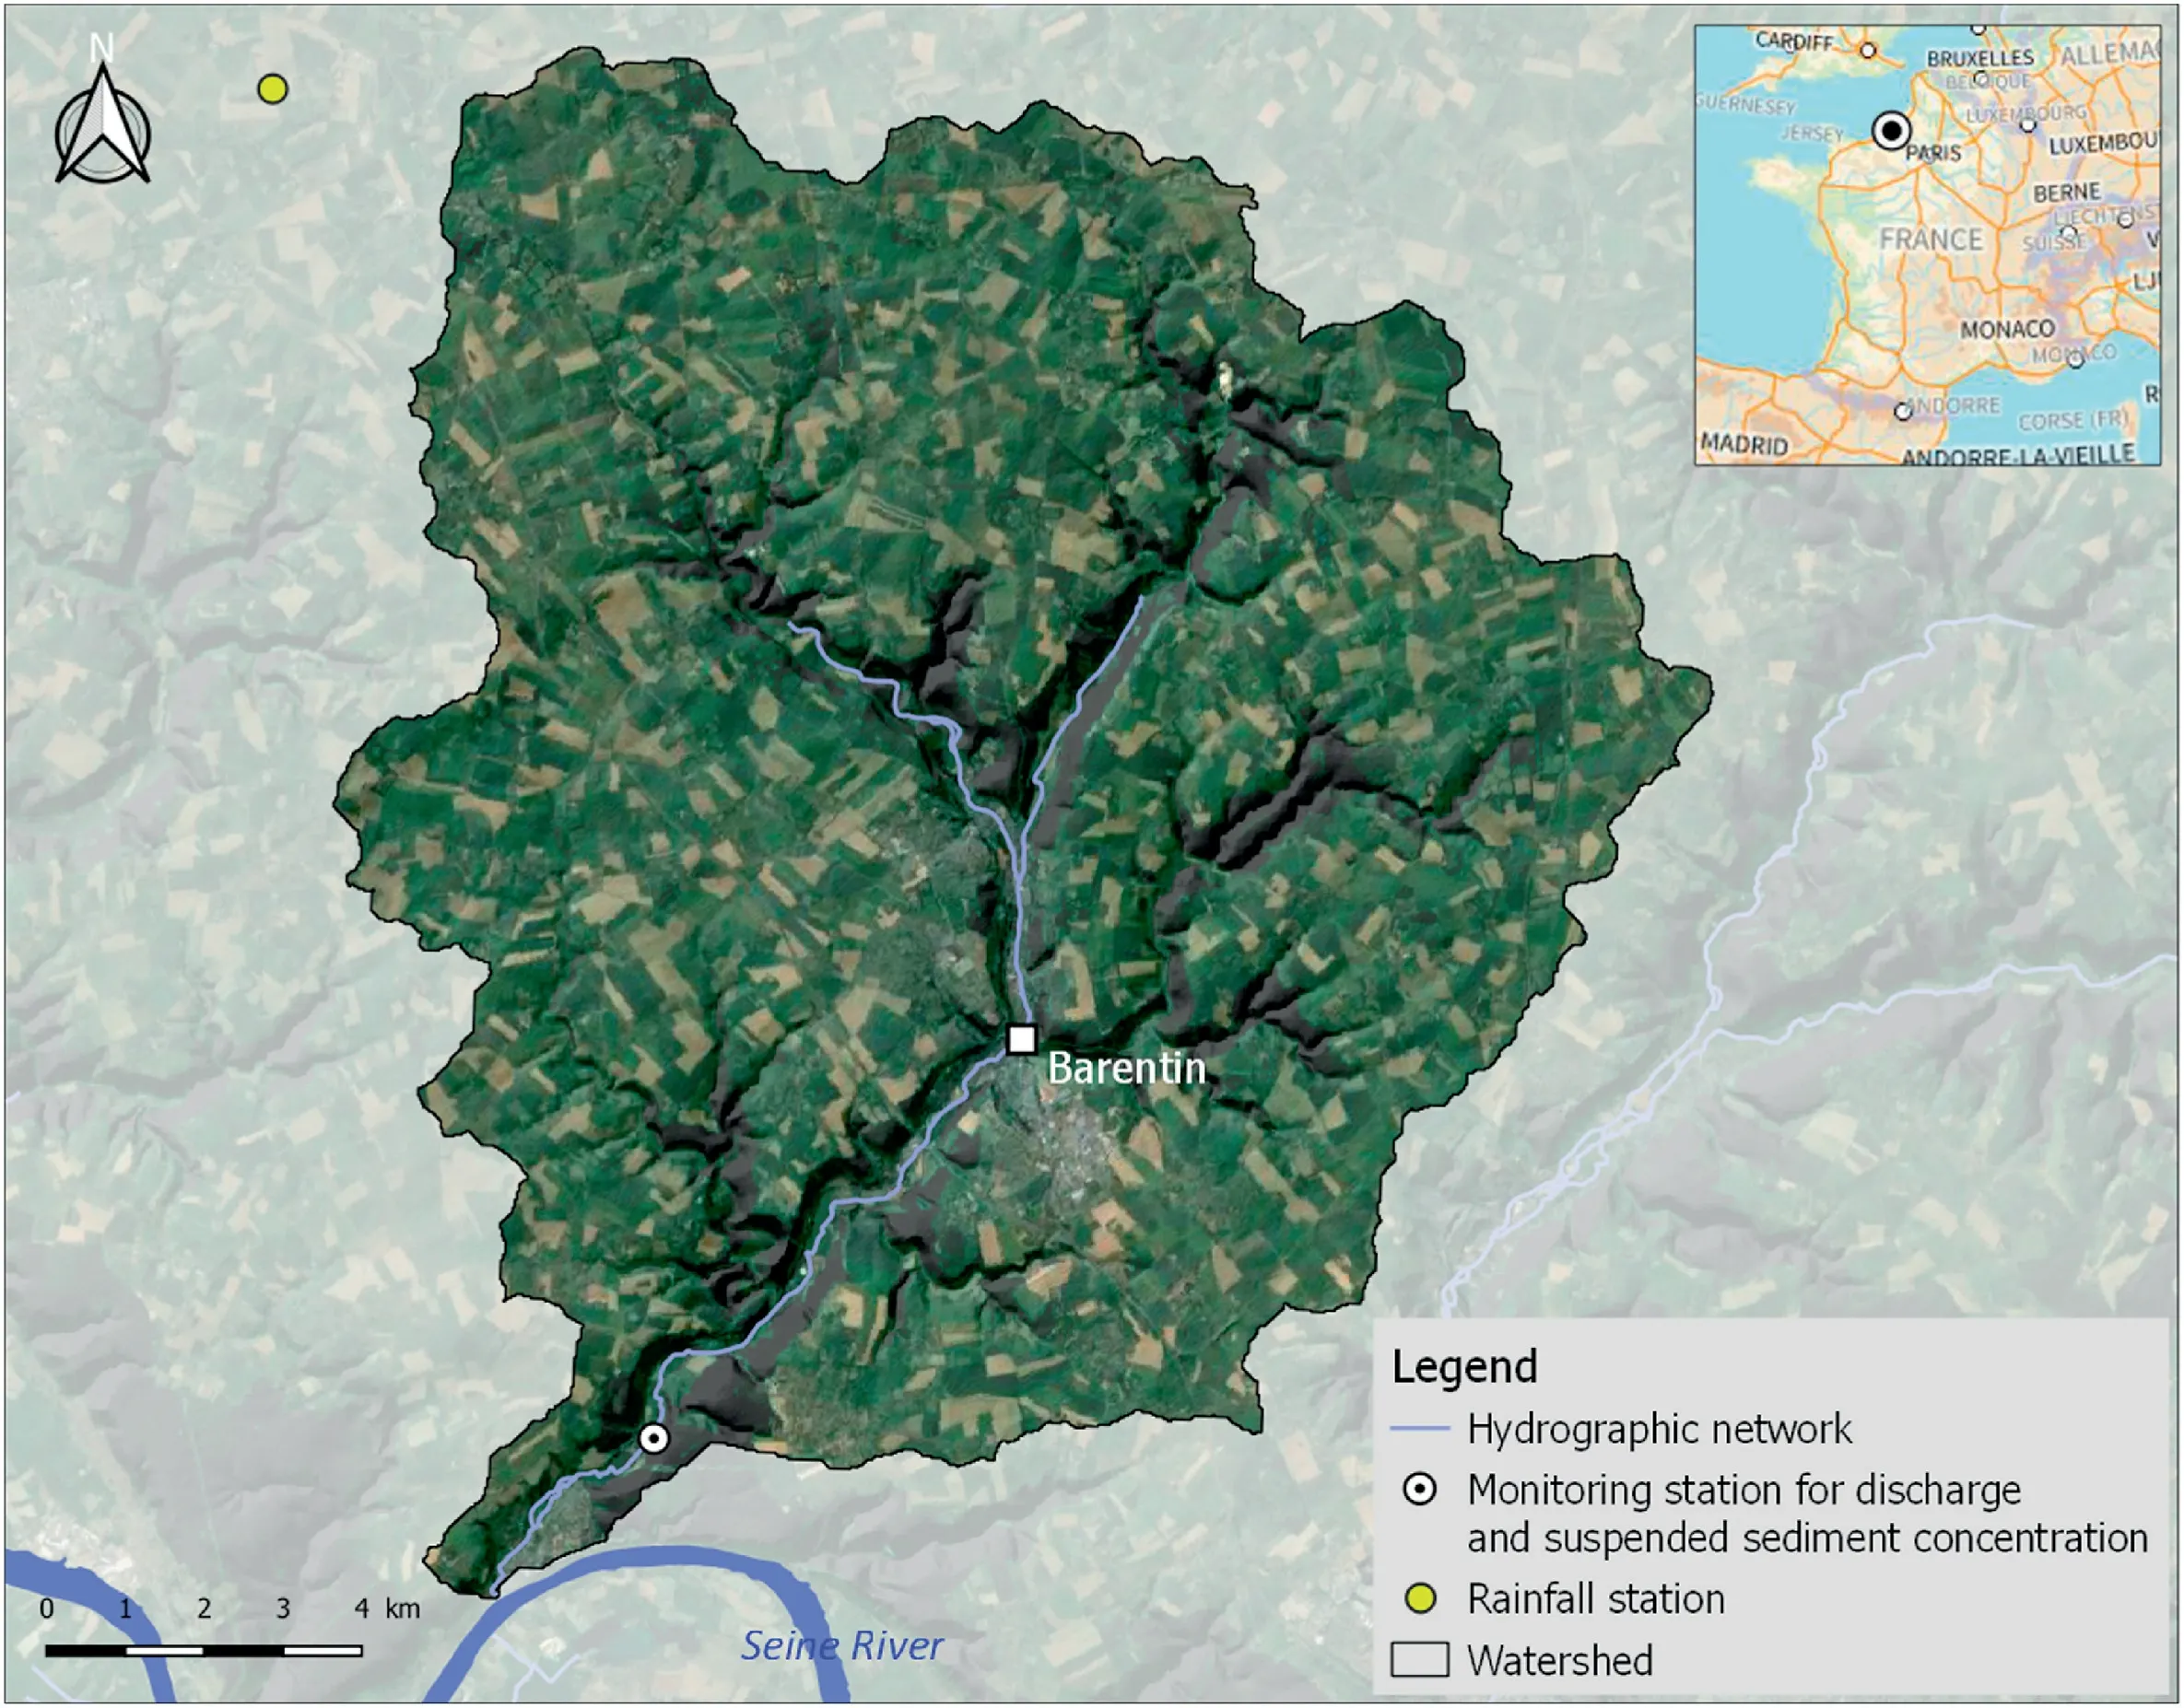
Fig.1.Location of the Austreberthe basin in Upper Normandy.
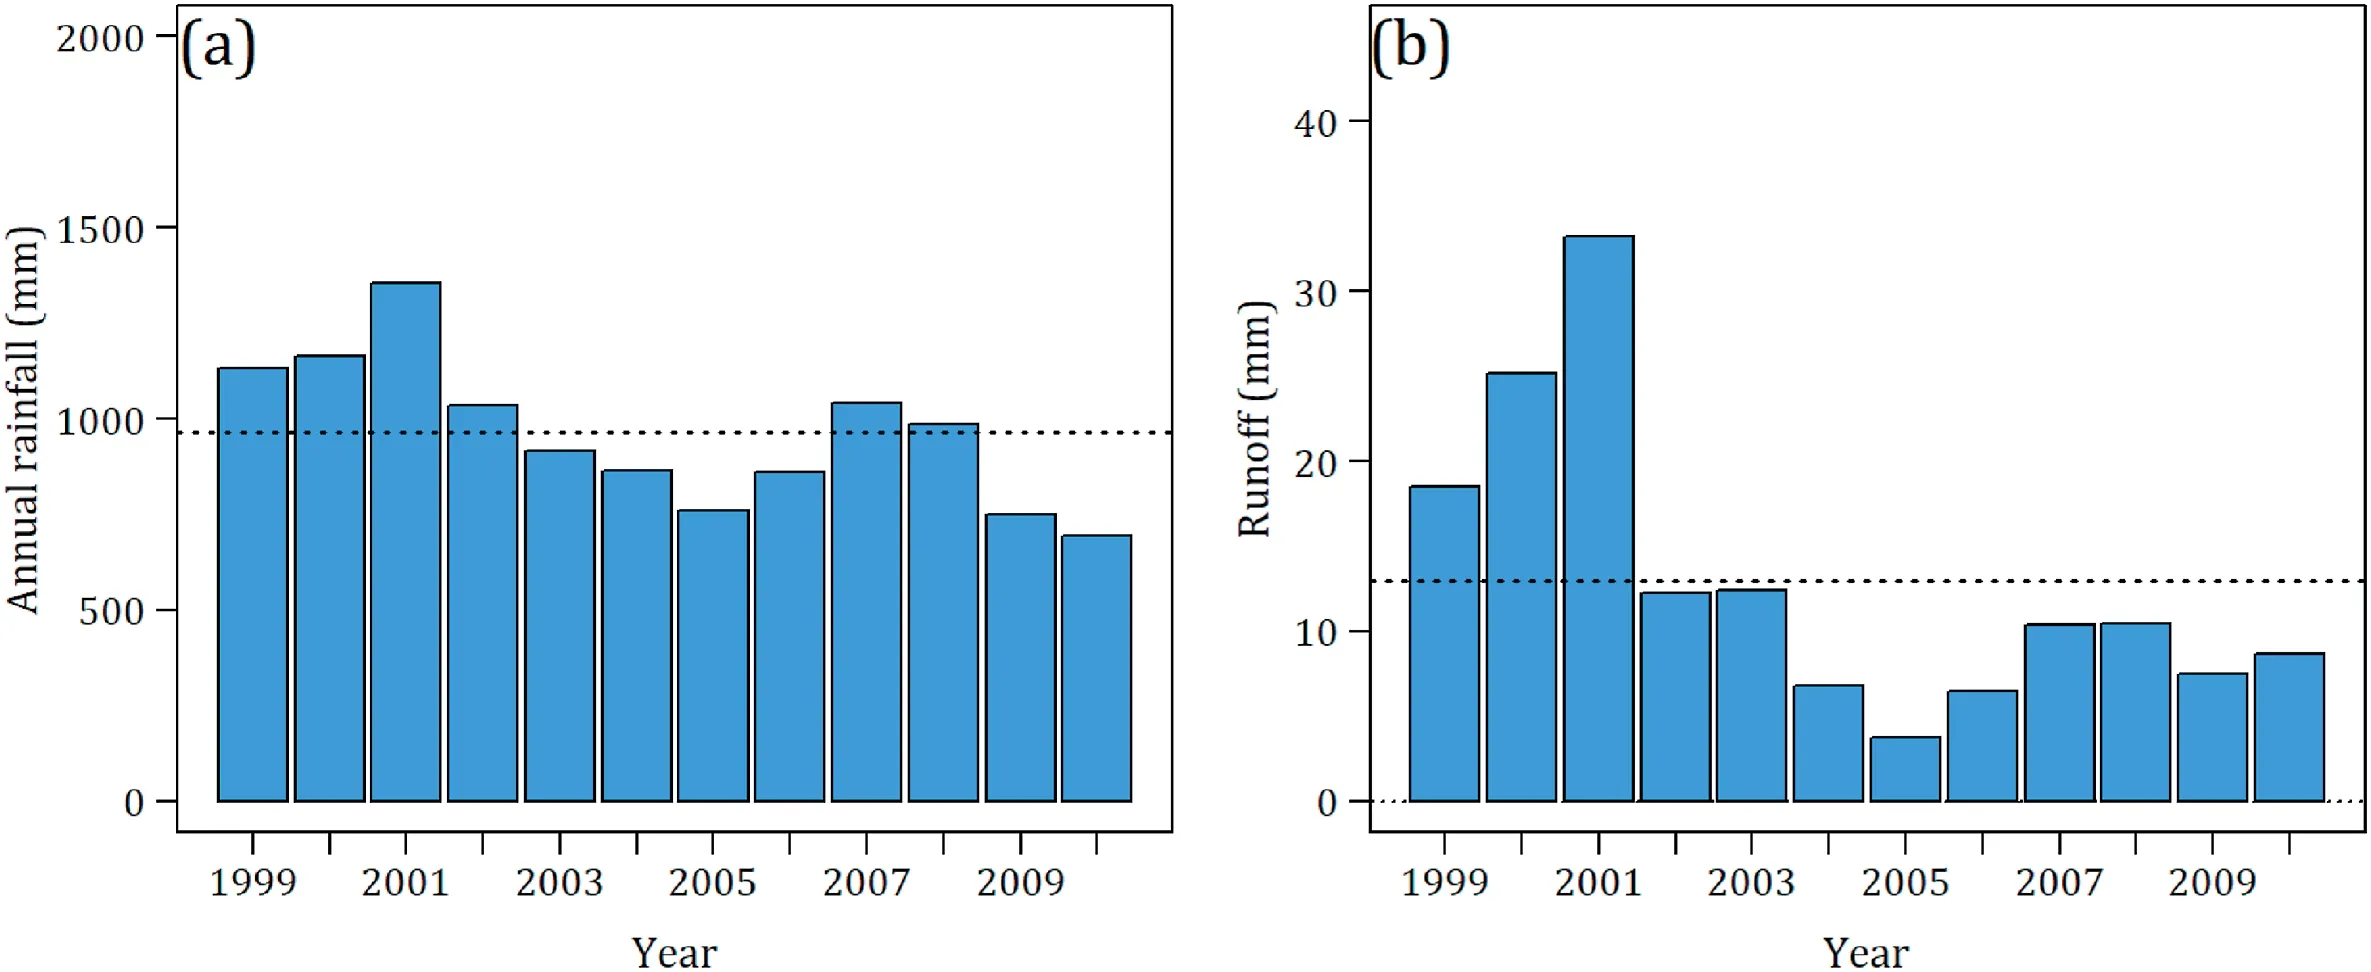
Fig.2.Annual (a) rainfall and (b) runoff measured between 1999 and 2010.The dotted line in subfigure (a) is corresponding to the annual mean, calculated over 12 years.
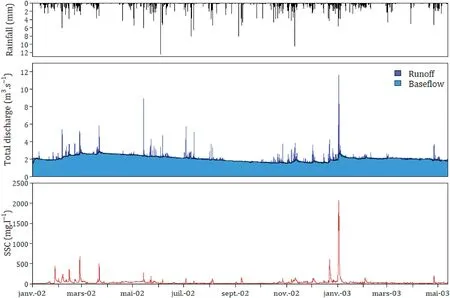
Fig.3.Rainfall, discharge and suspended sediment concentration high frequency time series (from top to bottom) used for calibration.
Land use was divided into 9 classes: winter crops, early spring crops, late spring crops, permanent crops, bare soils, grasslands,forests,urban areas,water surface.Given that crops vary from one year to another, annual land use map for each of the 12 studied years (1998-2010) were create using three national datasets.The French Land Parcel Identification System(RPG), Corine Land Cover and the General Census of French Agriculture (RGA) provided detailed plot delineation and observed land use for the 2006-2012 period over the whole catchment.
Then, the land use for the 1998-2005 period was extrapolated by applying statistical crop sequence rules developed on the 2006 and 2012 period.Based on 3-years crop sequences (usual in this part of France)on the recorded 2006-2012 period,probabilities ofantecedent crop were determined(Table 1)and applied from 2012 to 1998.
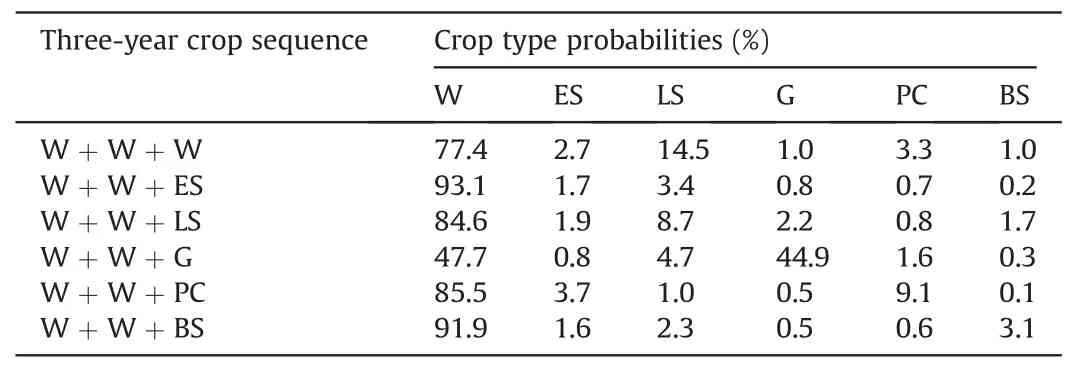
Table 1 Example of crop probabilities before for the three-year crop sequence beginning with winter crop.W: Winter crop; ES: Early spring crop; LS: Late spring crop; G:Grassland;PC: Permanent crop; BS: Bare soil.
The 2012-2006 period was used to evaluate if the reconstruction procedure matched the observed crops (Fig.4).Crops were then simulated from 2005 to 1998, resulting in 12 land use maps with 9 land use classes, over the 1998-2010 period.
Based on numerous previous studies performed in this region,it is assumed that soil surface crusting,surface roughness,cover and texture mainly control the soil hydrological and erosion behavior at the field scale.Monthly crusting, roughness and cover were therefore defined for each crop type, based on the previously developed land use maps, according to Evrard et al.(2010), modified in order to integrate intercrops after harvesting in October and November.The soil texture map was derived from the superficial formations map of the French Geological Survey with a precision of 1:50 000 into three classes: sand, silt, clay.
2.4.Model inputs
Finally, the land use-texture combination was used to calculate the monthly model inputs for 27 possible combinations (9 land uses x 3 textures) over 12 years:
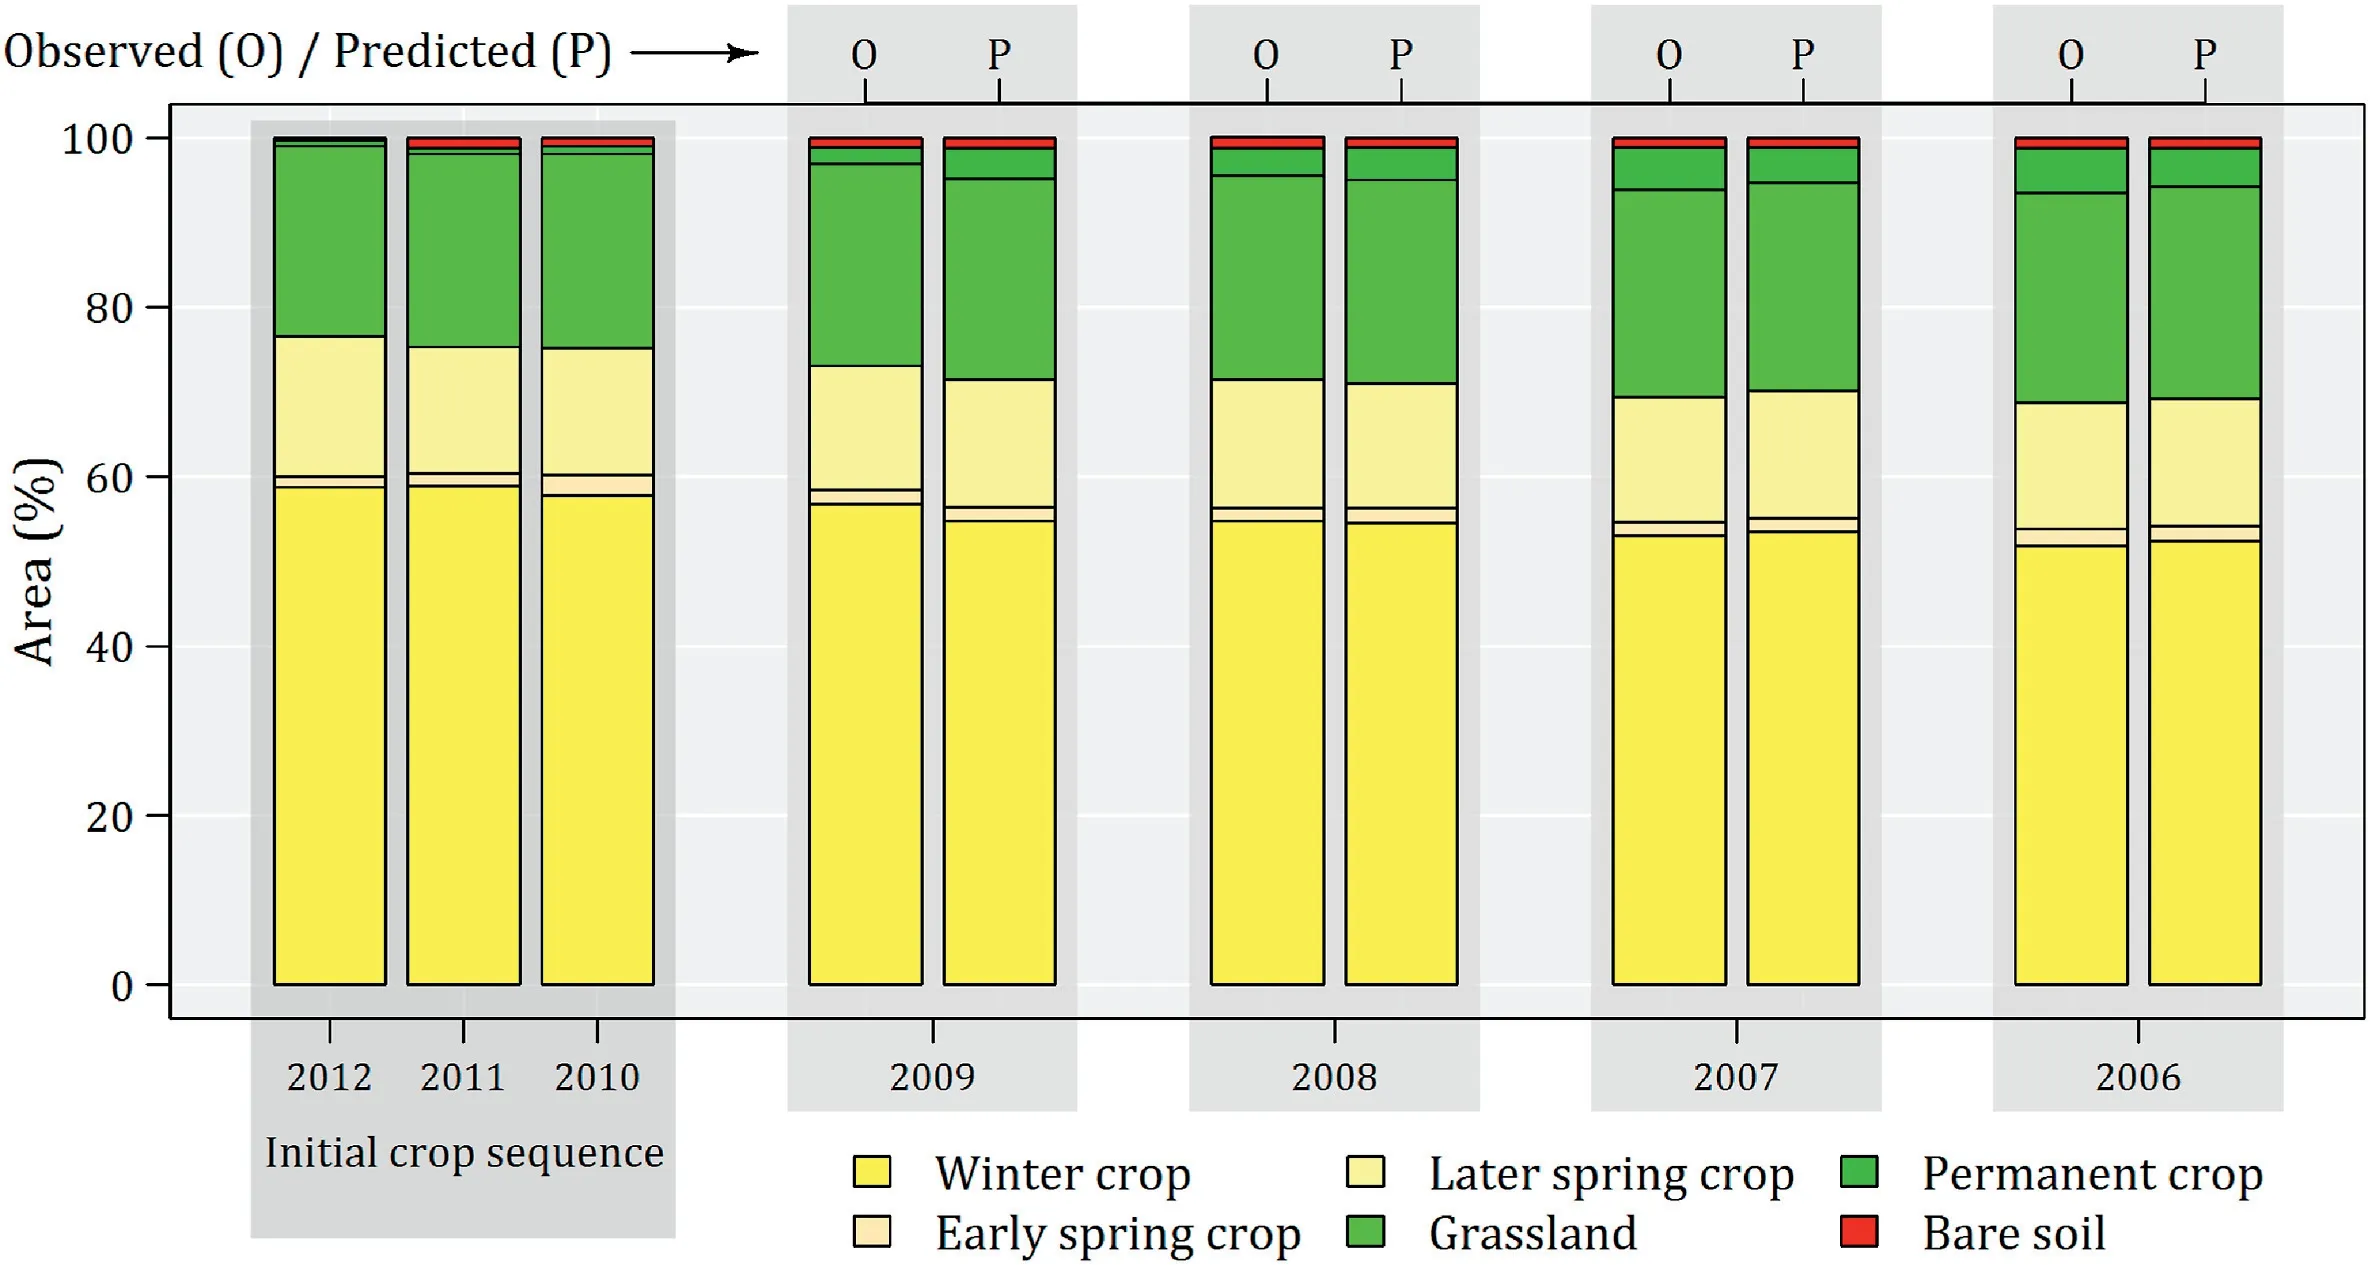
Fig.4.Simulation of crops between 2009 and 2006 according crop sequence rules and backward propagation.Simulated crops(P) are compared to the observed crops(O) at the Seine-Maritime department level.
Steady-state infiltration and potential sediment concentration were assigned to each soil surface characteristics according to Cerdan et al.(2001) and Cerdan, Le Bissonnais, Couturier, and Saby(2002).
Manning's values were derived from surface roughness(Morgan, 2005) and the crop cover (Gilley et al.,1991).
The soil erodibility factor was adapted from Souchˋere et al.(2003).
The corresponding calculations were detailed in the paper and toolbox presented in Grangeon et al.,2021.In short,default values were assigned to each soil surface characteristics (i.e.crop cover,crusting stage, roughness) combination, and were adjusted depending on the soil texture, over time at a monthly scale to reflect the effect of rainfall on vegetation cover,surface sealing and roughness,but also to reflect the possible crop operations effects on soil surface (e.g.harvesting and ploughing increasing infiltration capacity through decreased vegetation cover and surface sealing).The Manning's coefficient considered only soil roughness and crop cover.
For each of the 782 coupled rainfall-flood events, the following inputs were calculated:
Rainfall depth and duration
Rainfall imbibition (mm) was deduced according to the table developed by Cerdan et al.(2001)using the infiltration capacity and the 48 h antecedent rainfall depth.
2.5.The WaterSed model
The WaterSed model is a raster-based, event-scale runoff and erosion model.
2.5.1.Water module
2.5.1.1.Water balance - runoff generation.For each simulated rainfall event,an hydrologic balance HBi(mm)is calculated(Cerdan et al.,2001) as:
where Riis the rainfall depth(mm),IRithe imbibition rainfall(mm),ICithe steady-state infiltration rate(mm.h-1),and teffithe effective rainfall duration (min) of the ith cell.Positive values indicate an excess rainfall (ERi, mm), while negative values indicate potential infiltration for upstream runoff(ΔIi,mm).Excess rainfall ERican be modified with an adjustment parameter(θ),varying from 0 to 1,in order to considering scale effect from grid resolution.
Saturation processes were introduced by limiting the infiltration by a maximum water storage WSi(mm):
2.5.1.2.Flow velocity and flow travel time.Eq.(1) is assumed reasonable for small catchments (in the order 100 ha), when the flow travel time to the outlet is within the same order of magnitude of the effective rainfall duration.For larger catchments,where flow travel times may be longer,Eq.(1)may result in an underestimation of re-infiltration processes.Accordingly, the WaterSed model estimates the continuous abstraction for the runoff duration for each cell with the calculation of runoff duration requiring an estimation of the velocity and the flow travel time for each cell.
Average excess rainfall intensity, ei(mm.h-1), is derived from excess rainfall, ERi(mm), as:
Overland flow travel time in a cell is estimated with Manning's formula (Chow, Maidment, & Mays, 1988; Melesse & Graham,2004) with overland flow velocity, VHi(m.s-1) calculated as:
where Siis the slope of surface in cell i(m.m-1),Liis the flow length of the cell, (i.e.equal to cell size or north-south and east-west flow), and equal to■■■■2times cell size for diagonal flow directions,and niis the Manning's roughness coefficient (s.m-1/3).
Channel flow velocity, VCi(m.s-1), is estimated by combining Manning's equation and the steady state continuity equation for a wide channel (Chow et al.,1988; Muzik,1996):
where Qiis the cumulative discharge trough the cell, obtained by summing upstream flow contributions and the contribution from precipitation excess for that cell i (m3.s-1), and Wiis the channel width (m).To avoid unrealistic velocities values for hillslopes and channels, a minimum velocity of 0.02 m s-1and a maximum velocity of 2 m s-1are applied based on the common range incorporated into hydrologic models (Grimaldi et al., 2010).The travel time for each cell is calculated by dividing travel distance by cell velocity.
The flow through a given cell during the runoff duration can be described with a runoff hydrograph.Here, a triangular unit hydrograph was chosen and accordingly,the time of concentration TCi(min) (i.e.the time required for runoff to travel from the hydraulically most distant point in the watershed to the outlet) is calculated for each cell by summing up upslope travel time.Runoff is assumed to begin at the centroid of the effective rainfall(teffi/2).Therefore, the runoff duration TRi(min) is calculates as:
This recession parameter α was introduced to adjust reinfiltration and to take into account potential errors on the flow travel time estimations (e.g.Grimaldi et al., 2010).Therefore, reinfiltration is re-evaluated based on the runoff duration minus rainfall duration for each cell.
2.5.1.3.Water routing - runoff volume transfer.Once the calculation of the water balance,flow velocity and travel time is calculated,the water volume is routed according the Single Flow Direction(SFD)algorithm,in which the flow is concentrated in a single width cell.
Previously calculated water volumes are accumulated at the catchment scale from the runoff/infiltration balance calculated for each cell incorporating runoff flow network.A two-step calculation allows cells to re-infiltrate the totality or a part of generated upstream surface runoff.Accordingly, the hydrological balance is calculated once at the beginning of the simulation and a second time during the flow routing.
Using the total runoff volume through a cell,Vi(m3),the runoff duration,and assuming a triangular unit hydrograph for each cell,a runoff peak, Qpeaki(m3.s-1), is computed as:
2.5.2.Sediment module
2.5.2.1.Sheet and gully erosion - sediment generation.The model assumes that topography, soil surface characteristics, and rainfall characteristics are the main determinants for interrill and concentrated erosion(Cerdan,Le Bissonnais,Souchˋere,et al.,2002;Martin,1999).For interrill erosion, a table is used to assign a potential sediment concentration in the flow, SCi(g.l-1), to each combination of soil surface characteristics and rainfall intensity(Cerdan,Le Bissonnais,Couturier,&Saby,2002).The corresponding interrill erosion,IEi(kg), is calculated as:
where ERi,(m3),is the excess rainfall.Gully erosion occurs when the peak discharge on a hillslope grid cell exceeds a threshold peak discharge, Qcrit(m3.s-1), defined as a model parameter.The threshold peak discharge can be estimated by comparing the location of gullies on aerial photography and those predicted by the model.
A gully is assumed to be rectangular and unique per cell.The calculation of the cross section requires first the gully width, WGi(m), calculated from an empirical relationship developed by Nachtergaele et al.(2002) as:
Next, flow velocity, VGi(m.s-1) is computed according to the empirical relationship developed by Govers (1992) as:
Then gully height,HGi(m),is deduced from the gully width WGi,the gully velocity VGi, and the peak discharge Qpeaki, as:
The gully cross section, AGi(m2) is finally determined from the gully width WGiand the gully height HGi(Eq.(12)).A maximum cross section value of 0.25 m2is fixed in order to avoid unrealistic values.The gully volume VOLHi(m3)is then obtained by multiplying this cross section of incision by the grid cell length (Eq.(13)).The gully volume is weighted by a soil erodibility factor, EFi(-), in the range [0-1] computed from rules adapted from the methodology developed by Souchˋere et al.(2003)to determine the sensitivity to gully erosion.
Last, the gully erosion, GEi(kg) is calculated by multiplying the gully volume VOLGiby the bulk density,ρ (kg.m-3), as:
Therefore,the total gross erosion,TEi(kg),of a cell corresponds to the sum of the interrill erosion and gully erosion as:
2.5.2.2.Sediment mass transfer and deposition.At the catchment scale,sediment is transported in proportion to the runoff volumes.For cell i producing runoff, the mass of sediment transported downstream, SYi(kg), is expressed as:
where SYα is the mass of sediment coming from upslope cells(kg),and TEiis the total gross erosion (kg).The sediment mass is transported along with runoff, using the single flow direction algorithm.

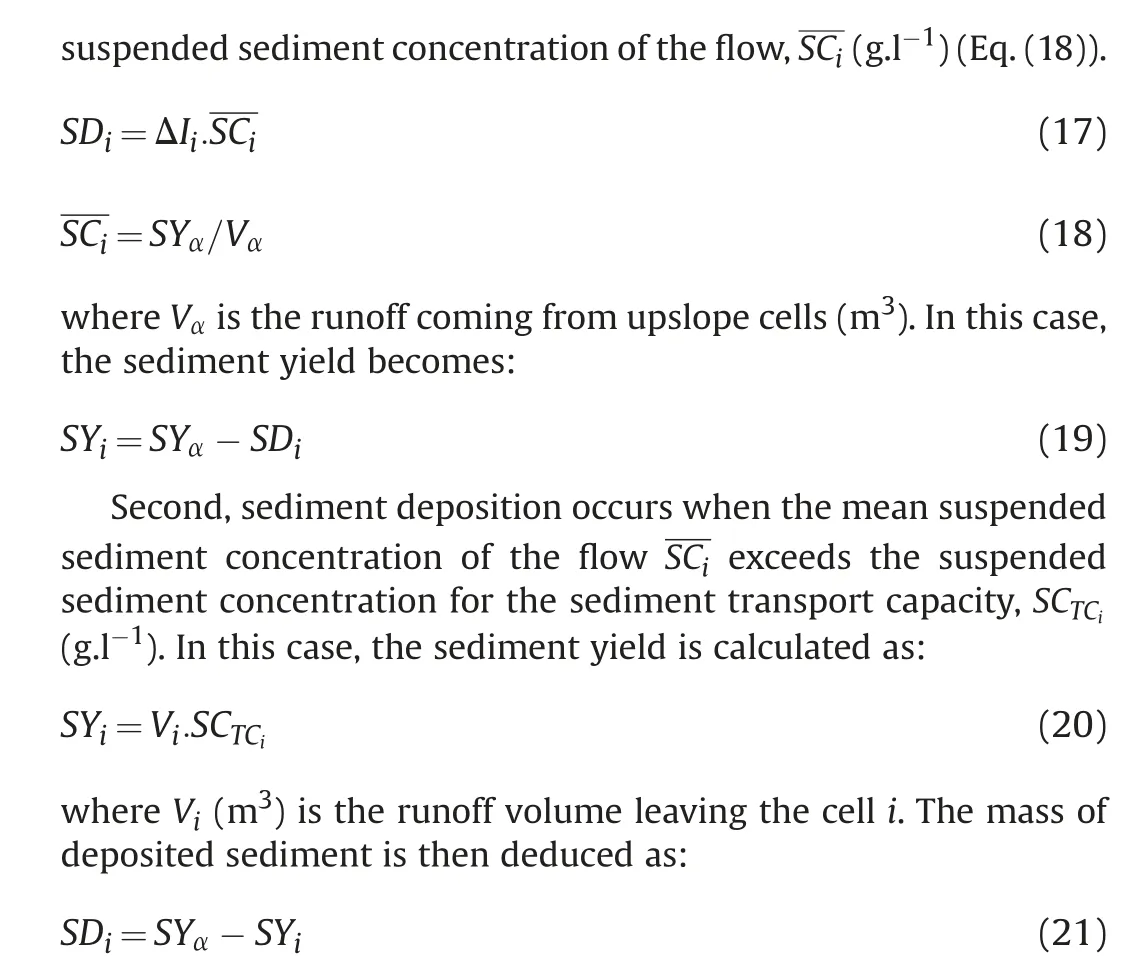
The suspended sediment concentration for the transport capacity,SCTCiis calculated as the ratio between the slope Siand the Manning's roughness coefficient ni(Eq.(21)).
where β is a sediment settling parameter (-) and hpeakiis the corresponding water height to the peak discharge Qpeaki.In this case,sediment deposition is expressed as:
2.6.Model calibration and application
For simulating runoff and erosion at the catchment scale, 4 parameters need calibration: the scale effect parameter θ, the recession coefficient α, the threshold discharge for gully initiation Qcritand the sediment settling parameter β.Of note,this number of parameter is relatively small relative to runoff and erosion models applied to the catchment scale.The model was calibrated against 35 coupled rainfall-flood events using the high-frequency measurements available over the 2002-2003 period.The Nash-Sutcliffe efficiency (NSE) and the Root Mean Square Error (RMSE) were used for quantitative evaluation of the model performances:
where Vobsis the observed value(runoff volume or sediment mass)for the considered rainfall/runoff event,Vpredis the predicted value,Vobsis the mean of the observed values, and n the number of rainfall/runoff events.Calibrated parameter values were used for modelling over the September 1998-August 2010 period.
In order to analyze the respective effects of infiltration-excess and saturation-excess runoff, the model was calibrated using two different configurations: i) considering only infiltration-excess runoff (saturation-excess runoff was not allowed to occur) and ii)considering both infiltration-excess and saturation-excess runoff.
In this study, the water storage was spatially distributed using the pedology as input data: Because no specific measurements were available, we arbitrarily attributed an 80 mm and 150 mm storage value to the 2 main pedological entities of the catchment,namely flint clays and deep loam soils,respectively.The model was run using a“quasi-continuous”approach:the spatially-distributed water content at the end of a run was used as input value for the following event, applying drainage in-between the modelled events.This approach was previously successfully applied(Grangeon et al.,2021)to model the runoff and erosion dynamics of an alpine catchment.In the current study,as the modelling period was long (>10 years) and due to a lack of data, for simplicity reasons,the water storage drainage value was set as a constant value of 4 mm d-1, following a simple trial-and-error approach.
3.Results and discussions
Between 2002 and 2004, 35 rainfall-runoff events were extracted from time series of rainfall, discharge and SSC for the model calibration (Table 2).Rainfall amounts ranged from 3.6 mm to 58.7 mm with varying conditions of antecedent rainfall depth(from 0.2 mm to 35.2 mm)and maximum intensity at 6 min(from 2.0 mm h-1to 12.8 mm h-1).Runoff volumes ranged from 2171 m3to 671 350 m3,with runoff coefficients ranging from 0.21%to 5.34%.
The WaterSed model has been calibrated with and without the possibility of soil surface saturation on these events.The prediction performances on runoff volumes and sediment fluxes are presented in Fig.5.The parameters optimised by the calibration are presented in Table 3.
Model prediction quality for runoff volume and sediment load is good with a NSE of ca.0.7 for runoff volumes and for sediment loads.Overall results are above the classical threshold values for satisfactory model, defined between 0.5 < NSE <0.65 in hydrological studies (Moriasi et al.,2007;Ritter et al., 2013).
Calibration results show it is possible to achieve good model accuracy with or without taking into account the saturation of the soil profile.The difference for the runoff calibration lies in the values of the calibration parameter “grid size effect”; 0.19 with“hortonian” only and 0.13 in the case of “hortonian + saturation”.The grid size effect parameter is a calibration parameter that permits to take into account the difference between the spatial resolution at which were collected the observed reference values and the one at which the model is applied.It is especially true for hydraulic conductivity, which tend to decrease with increase slope length (reinfiltration processes).Therefore, if hydraulic conductivity measurements at the scale of few centimeters (typical size of measurement devices) is used it in a model with a cell size ofseveral meters(typical size of hydrological models),a correction is needed for the difference.This parameter is therefore very sensitive, a value of 1 means no reinfiltration is foresee because of the model cell size (e.g.infiltration parameters measured on a rainfall simulation plot of 25 m2, and same model cell size), a value of 0.1,means you expect a potential reinfiltration of 90% of your runoff.Here the values are quite similar,meaning that at the rainfall-runoff event scale, we can obtain similar results with or without taking into account saturation processes of the soil profile for the chosen rainfall-runoff events, provided that the model is adequately calibrated.This result underlines that even using a simple model(only four parameters were used to parameterize the runoff and erosion model), equifinality issues (Beven et al., 2001) may arise and that model parameterization should be based on a sound understanding of the catchment behavior.Previous studies on agricultural catchments(e.g.Saffarpour et al.,2016;Grangeon et al.,2021)suggested that both infiltration-excess and saturation-excess may occur in agricultural catchments.Consequently, we used the model to analyze the relative effects of these two processes in a catchment of the European Loess belt, where model considering infiltrationexcess only are recurrently being used (Baartman et al., 2020),and tested the hypothesis that saturation-excess may be a relevant process to consider.

Table 2 Characteristics of rainfall events used for the WaterSed model calibration.
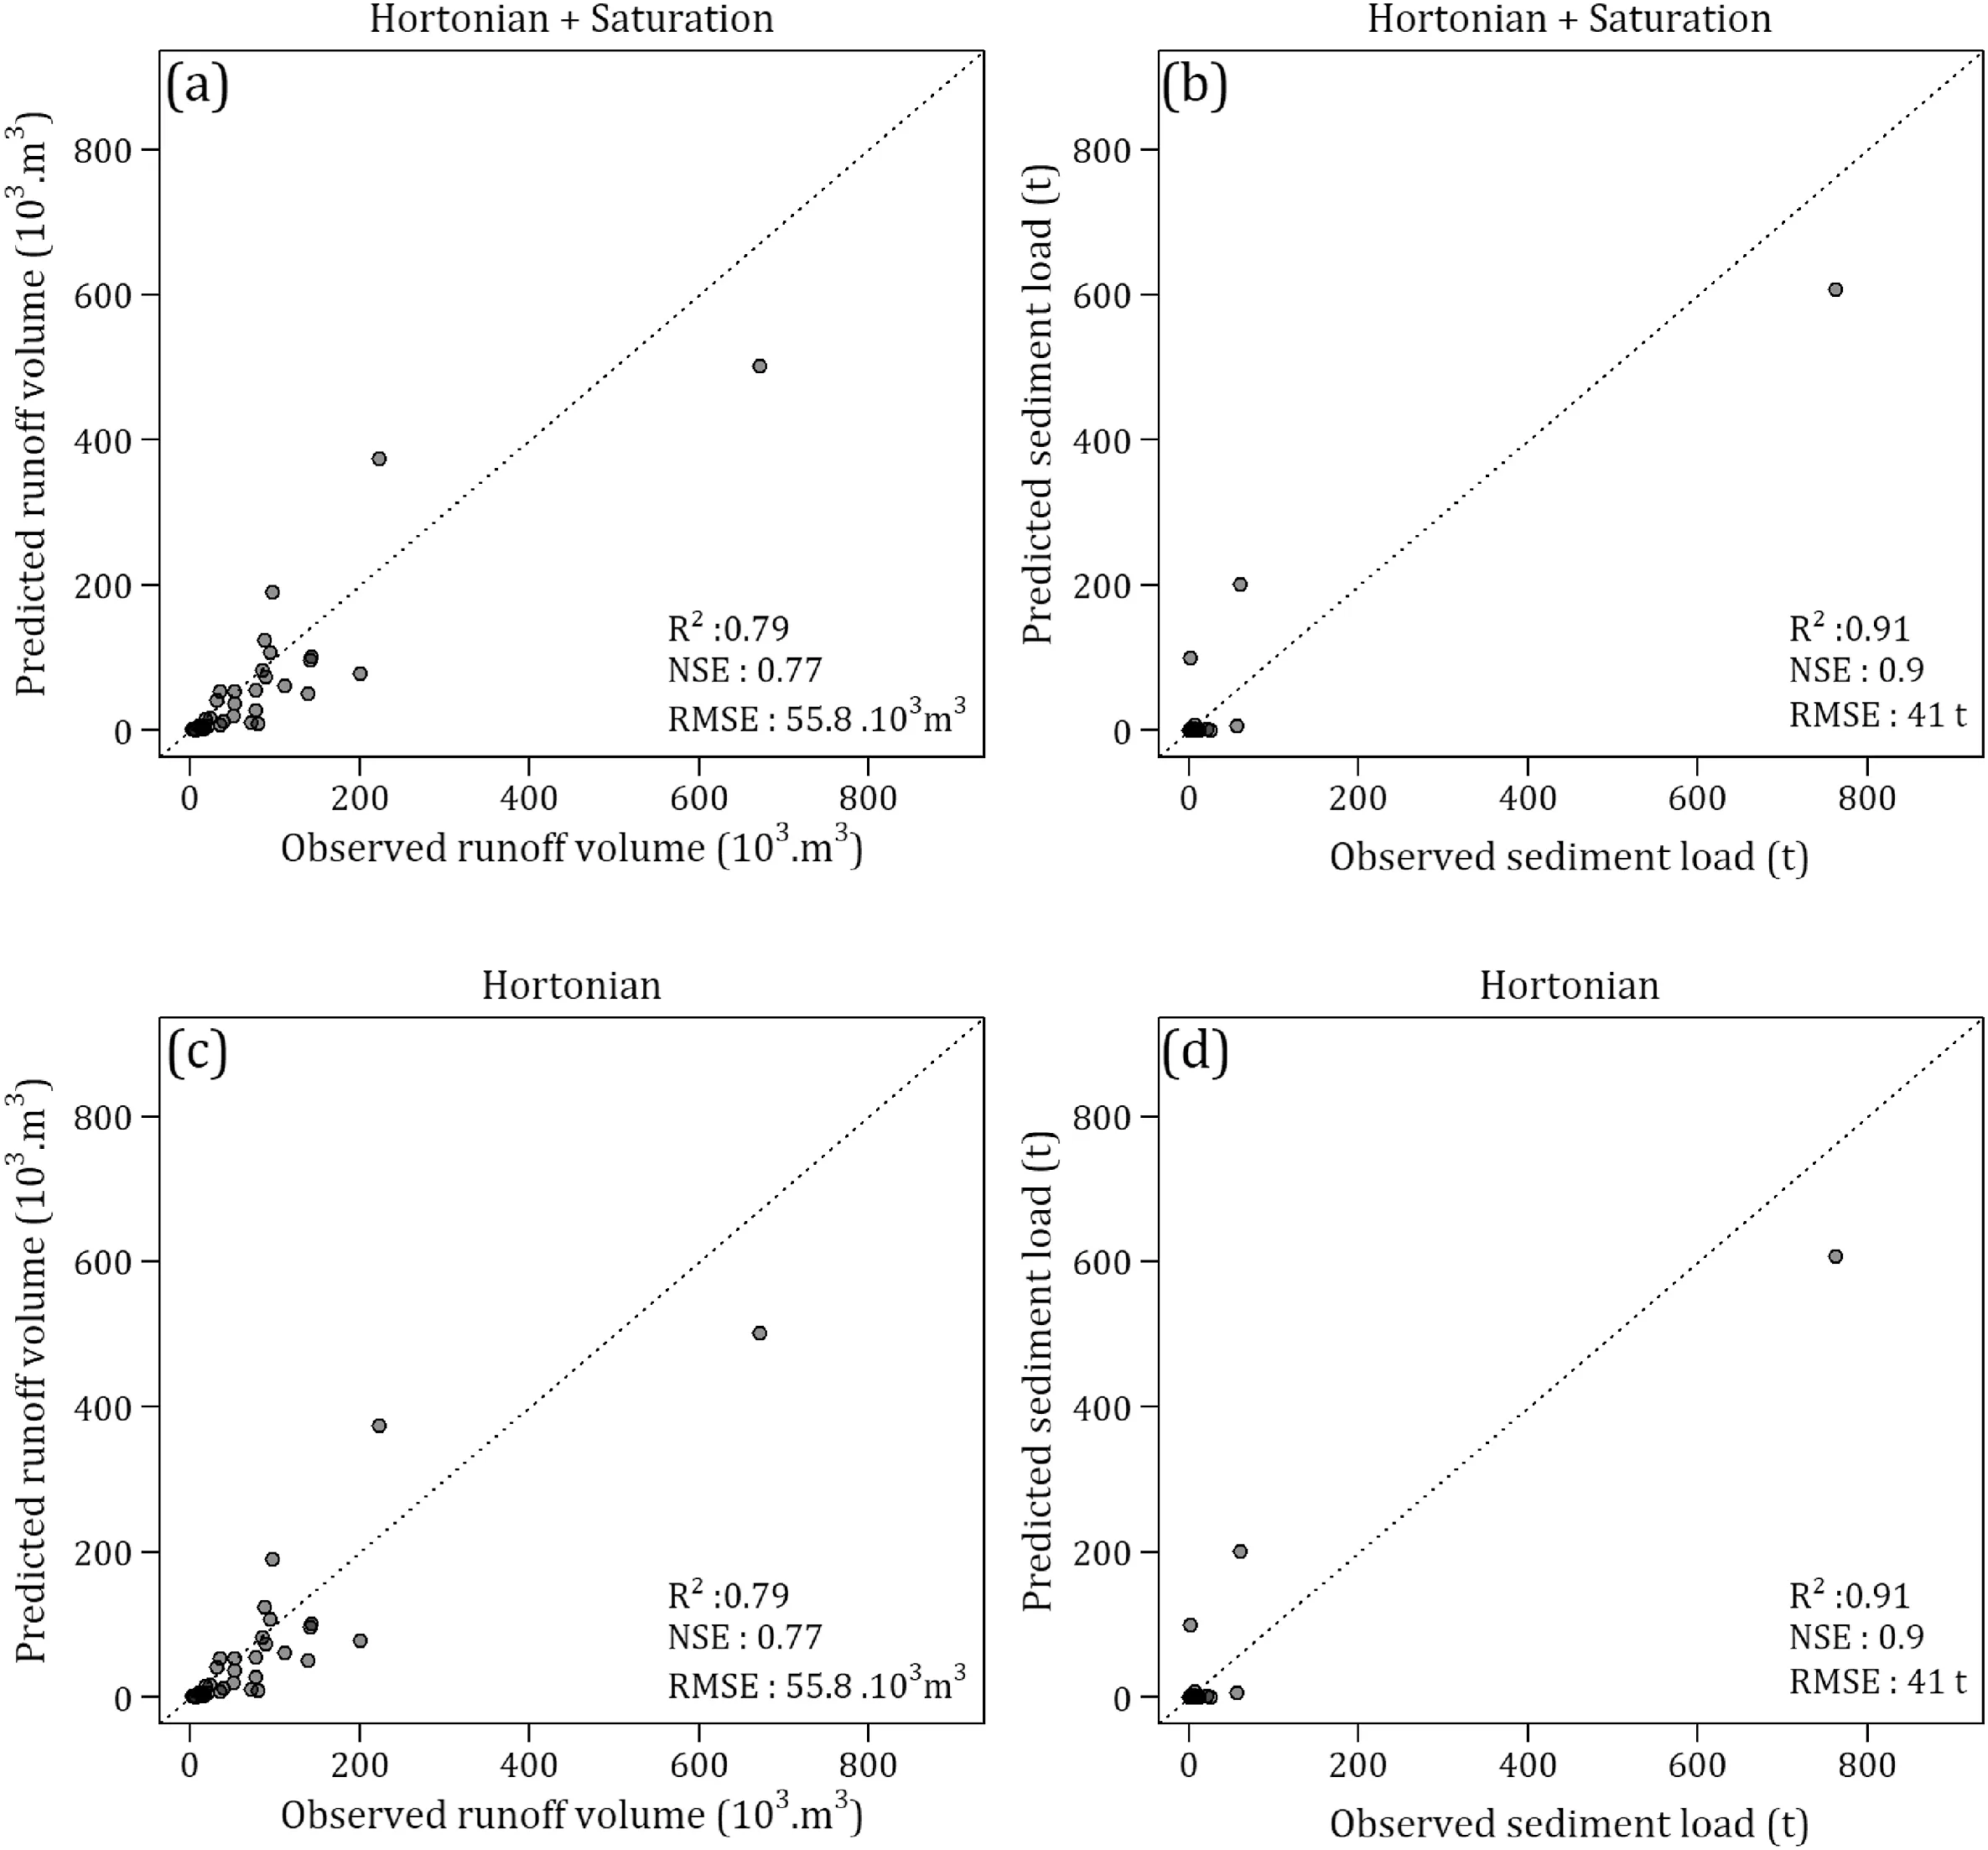
Fig.5.Observed versus predicted values of runoff volumes (a) and (c) and sediment loads (b) and (d) by the WaterSed model after calibration for the Austreberthe River.

Table 3 WaterSed calibration parameters.
It is accepted that,in agricultural catchments covered with silty soils, rainfall progressively results in soil surface crusting, dramatically decreasing infiltration rates,and changing runoff-generating mechanism from saturation-excess runoff to infiltration-excess runoff (Boardman, 2020).However, this transition has rarely been quantified over the course of multiple hydrological years, limiting our understanding of runoff occurrence is such catchments.
We tested the validity of the calibrated model over a long time period(12 years),between September 01,1998 and August 31,2010(Fig.6).During this period, the mean annual precipitation accumulation is 964 mm with a minimum of 694 mm in 2010 and a maximum of 1356 mm in 2001 (Fig.2).The years 1999-2002 are particularly wet compared to the following eight years,which were relatively dry, except for 2007 and 2008.
The runoff interannual variability generally follows the same trend.The years 1999,2000 and 2001 are the years with the highest runoff depths, with 18.5 mm, 25.1 mm and 33.1 mm, respectively.For the other nine years,the average annual runoff is 8.7 mm,with a minimum in 2005 of 3.7 mm.
During this period,782 rainfall events greater than 2 mm were recorded,covering a wide range of rainfall depths and intensity.All of these events were modelled by applying the previously calibrated parameters.
Predicted runoff volumes per event were aggregated on an annual basis and compared to observed annual runoff.With the hortonian module alone,the R2of 0.45 and the NSE of 0.39 indicate poor prediction performance.The wettest years (1999, 2000 and 2001) are underestimated while the driest years are slightly overestimated.
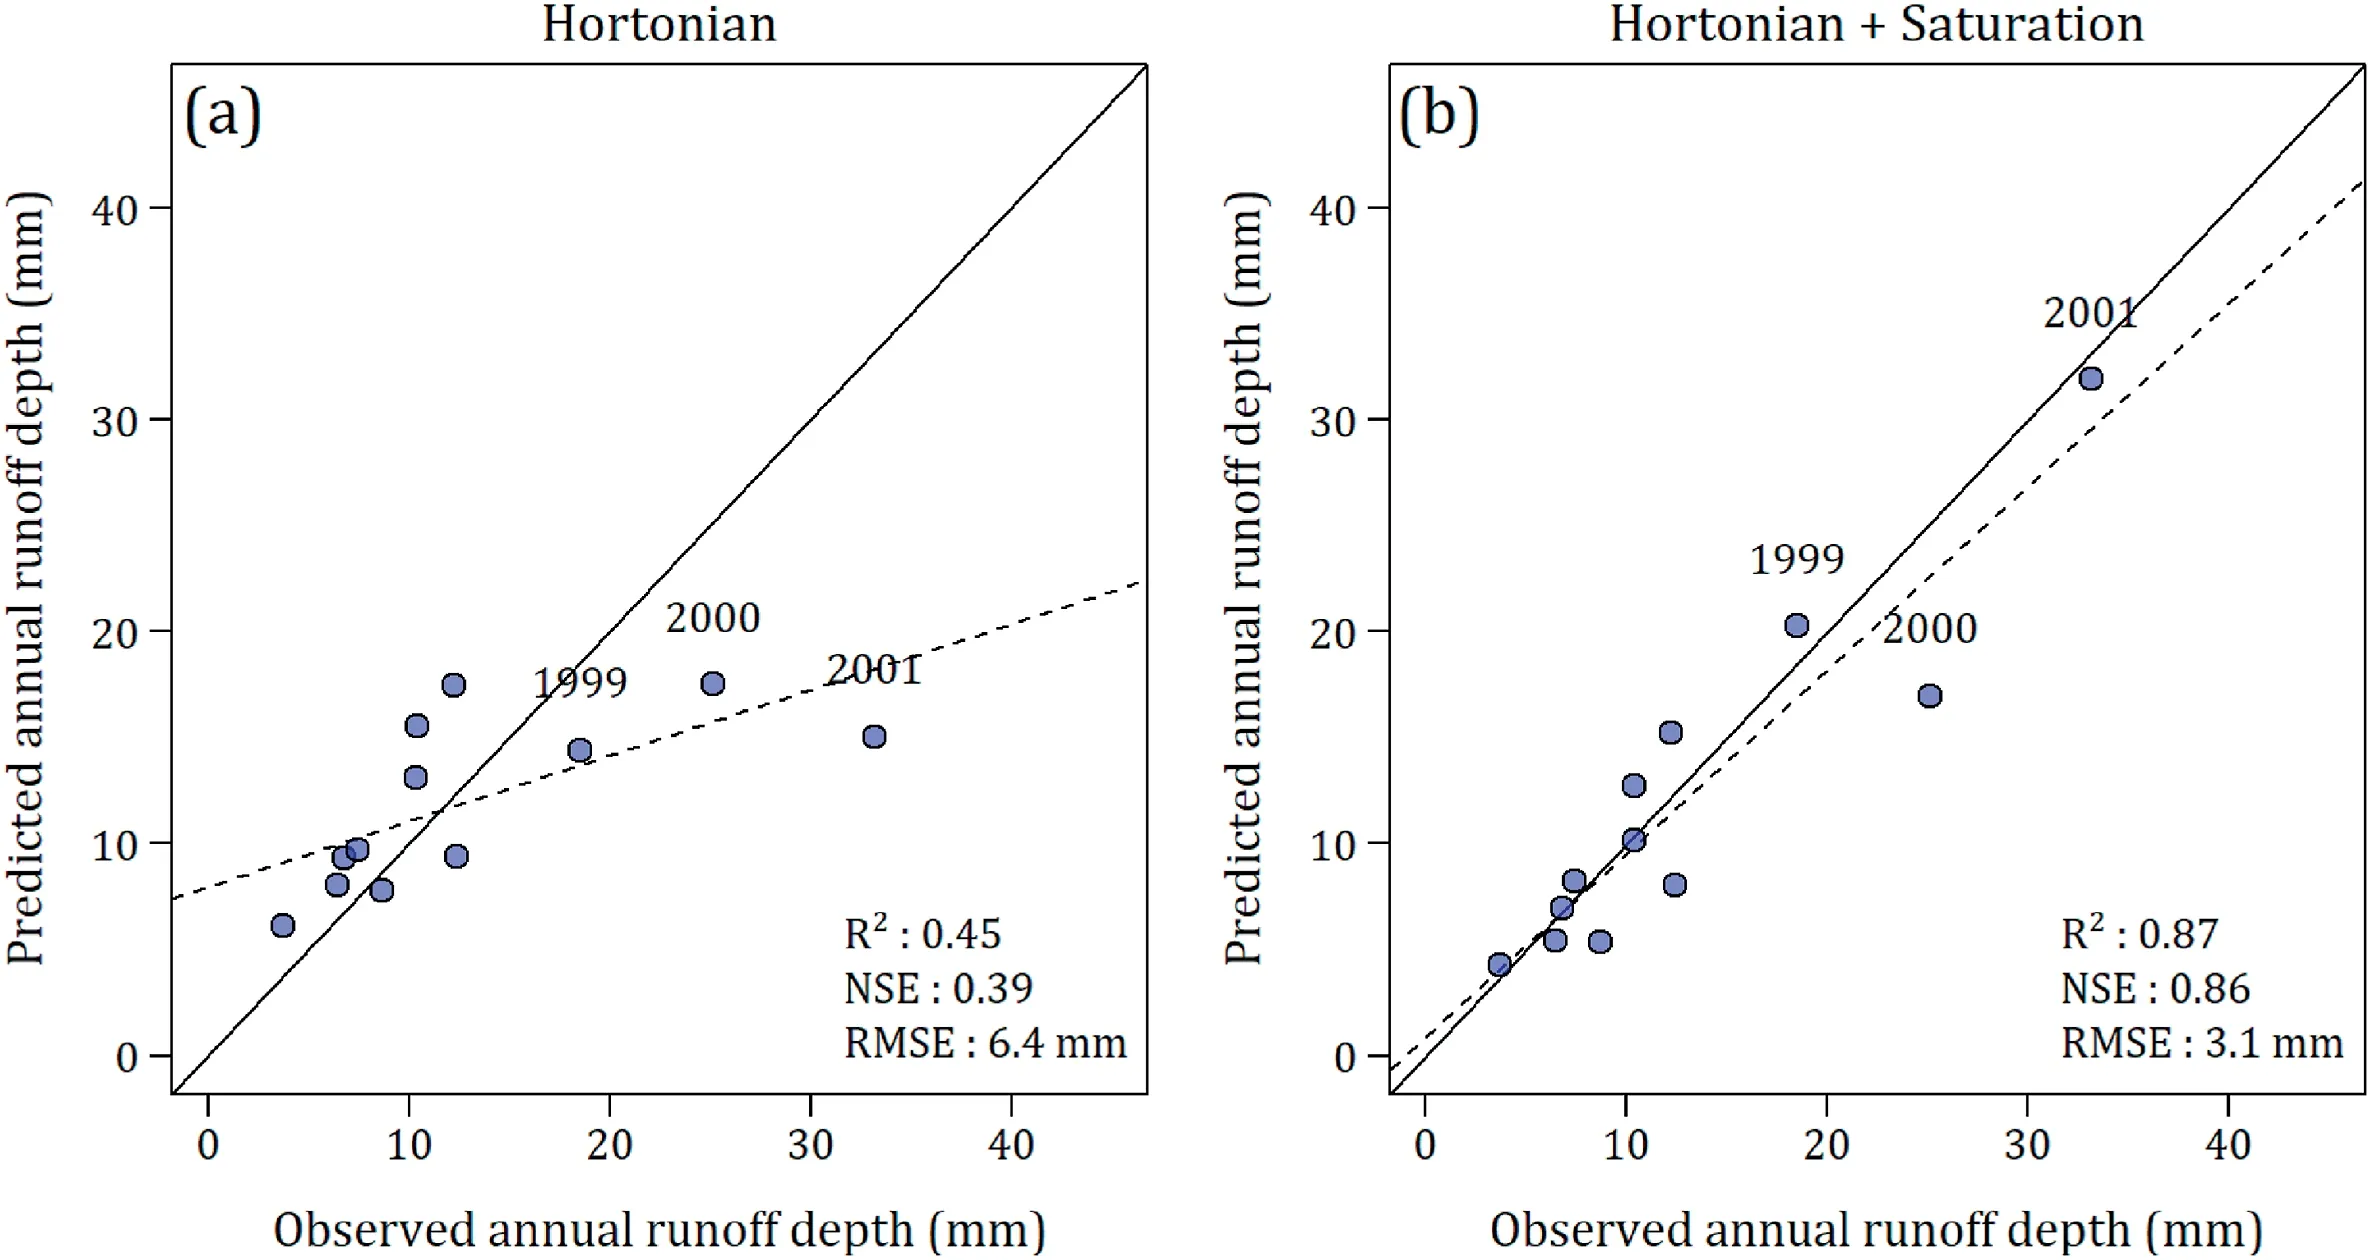
Fig.6.Observed versus predicted values of runoff volumes(a)with the hortonian module(b)with the hortonian+saturation modules by the WaterSed model for the Austreberthe River between 1998 and 2010.
The integration of the possibility to saturate the soil profile permits to increase the model performance,especially for the 2001 year, which was exceptionally wet.If we model only the period between 2002 and 2010, both model performances would be very comparable and the integration of a saturation runoff module would not appear pertinent.This modelling study therefore underlines that an adequate modelling of the Austreberthe catchment, mostly covered with silty soils, would require the consideration of saturation-excess runoff.However,if we calculate the number of saturated cells at the scale of the catchment(Fig.7)using the soil saturation module, we clearly visualize their importance for the wettest years but we also realize that there are always part of the catchment that exhibit saturated cells even for the dry years.On note, there is a significant number of saturated cells during the calibration years especially in 2002, which can explain the better results obtained with hortonian + saturation modules(Fig.4).It is therefore suggested that saturation-excess runoff should be considered at the seasonal and probably at the rainfall event scale, although in a smaller proportion, when studying the runoff dynamics of agricultural catchment covered with silty soils.
The importance of soil saturation on runoff and erosion processes has almost never been studied in the context of the cultivated soils of the European loess belt.Most of the research has focused on soil surface conditions, i.e.surface crust development,roughness and vegetation cover, that have an important influence on infiltration rates,runoff generation and erosion(Papy&Douyer,1991; Auzet et al., 1995), particularly at the local scale.On bare,cultivated soils, crusting has been used to describe surfacestructure evolution, as it has a very strong influence on soil hydraulic properties and runoff rate.Crusting also affects soil surface shear strength and roughness, which influence, together with vegetation cover,sediment detachment and transport processes(Le Bissonnais et al., 2005).Relationships between the different types of surface conditions and quantitative runoff and soil erosion parameters have therefore been developed to facilitate the quantification of average hydraulic and erosion properties at the field scale(Cerdan, Le Bissonnais, Couturier, et al., 2002; 2002b).
In the WaterSed model, developed in this study, we also used these relationships to compute local water balance and sediment budget, but the application to a 214 km2catchment shows that to only consider the soil surface as the limiting factor that controls hydrological processes is not verified for very wet years.By adding a second limitation, consisting in a distributed soil water capacity limit (filled with rainfall and upslope runoff and emptied with evapotranspiration and percolation), we could reproduce the increase of runoff coefficient during the wettest months.This modification implies to run the model more continuously, as the soil water balance evolves between rainfall events.
One first reason to explain the lack of consideration of soil saturation is that most of runoff and soil erosion studies in the European loess belt,are carried out either at the laboratory(rainfall simulation on plots varying from several cm2to several m2) or in the field from the plot to the hillslope scale.On this basis,the scale effects from the plot to the hillslope(or the headwater catchment)scales have been well identified,notably the potential reinfiltration(and sediment deposition) of water when moving downslope explaining the decreasing values of runoff coefficient or sediment erosion rates when moving between these two scales(Cammeraat et al., 2004; Cerdan et al., 2004; Delmas et al., 2012).At the larger catchment scale, emerging processes, such as the contribution of subsurface saturation may need to be taken into account even in the case of well-drained cultivated luvisols of the European Loess belt.
A second reason is that model simulations are mostly performed at the rainfall event scale, the effect of saturated conditions can therefore be hidden in the calibration of the hydraulic parameters.For example,a decrease of the infiltration capacity can result in the same model output that a higher infiltration capacity but coupled to limiting soil water capacity if the hydrological conditions do not change too much during the rainfall-runoff event.For runoff and soil erosion simulation at the larger catchment scale(102-103km2),we therefore advise to run a continuous water balance,during,but also between, the rainfall events to properly account for soil saturation.
4.Conclusion
In this study, a unique dataset, including rainfall, discharge,suspended sediment concentration was used to develop and evaluate a runoff and erosion model over 12 years.To this end,land use and land cover were also reconstructed together with the corresponding runoff and erosion parameters for this period.The model was applied to a 214 km2catchment located in the Western Paris Basin.
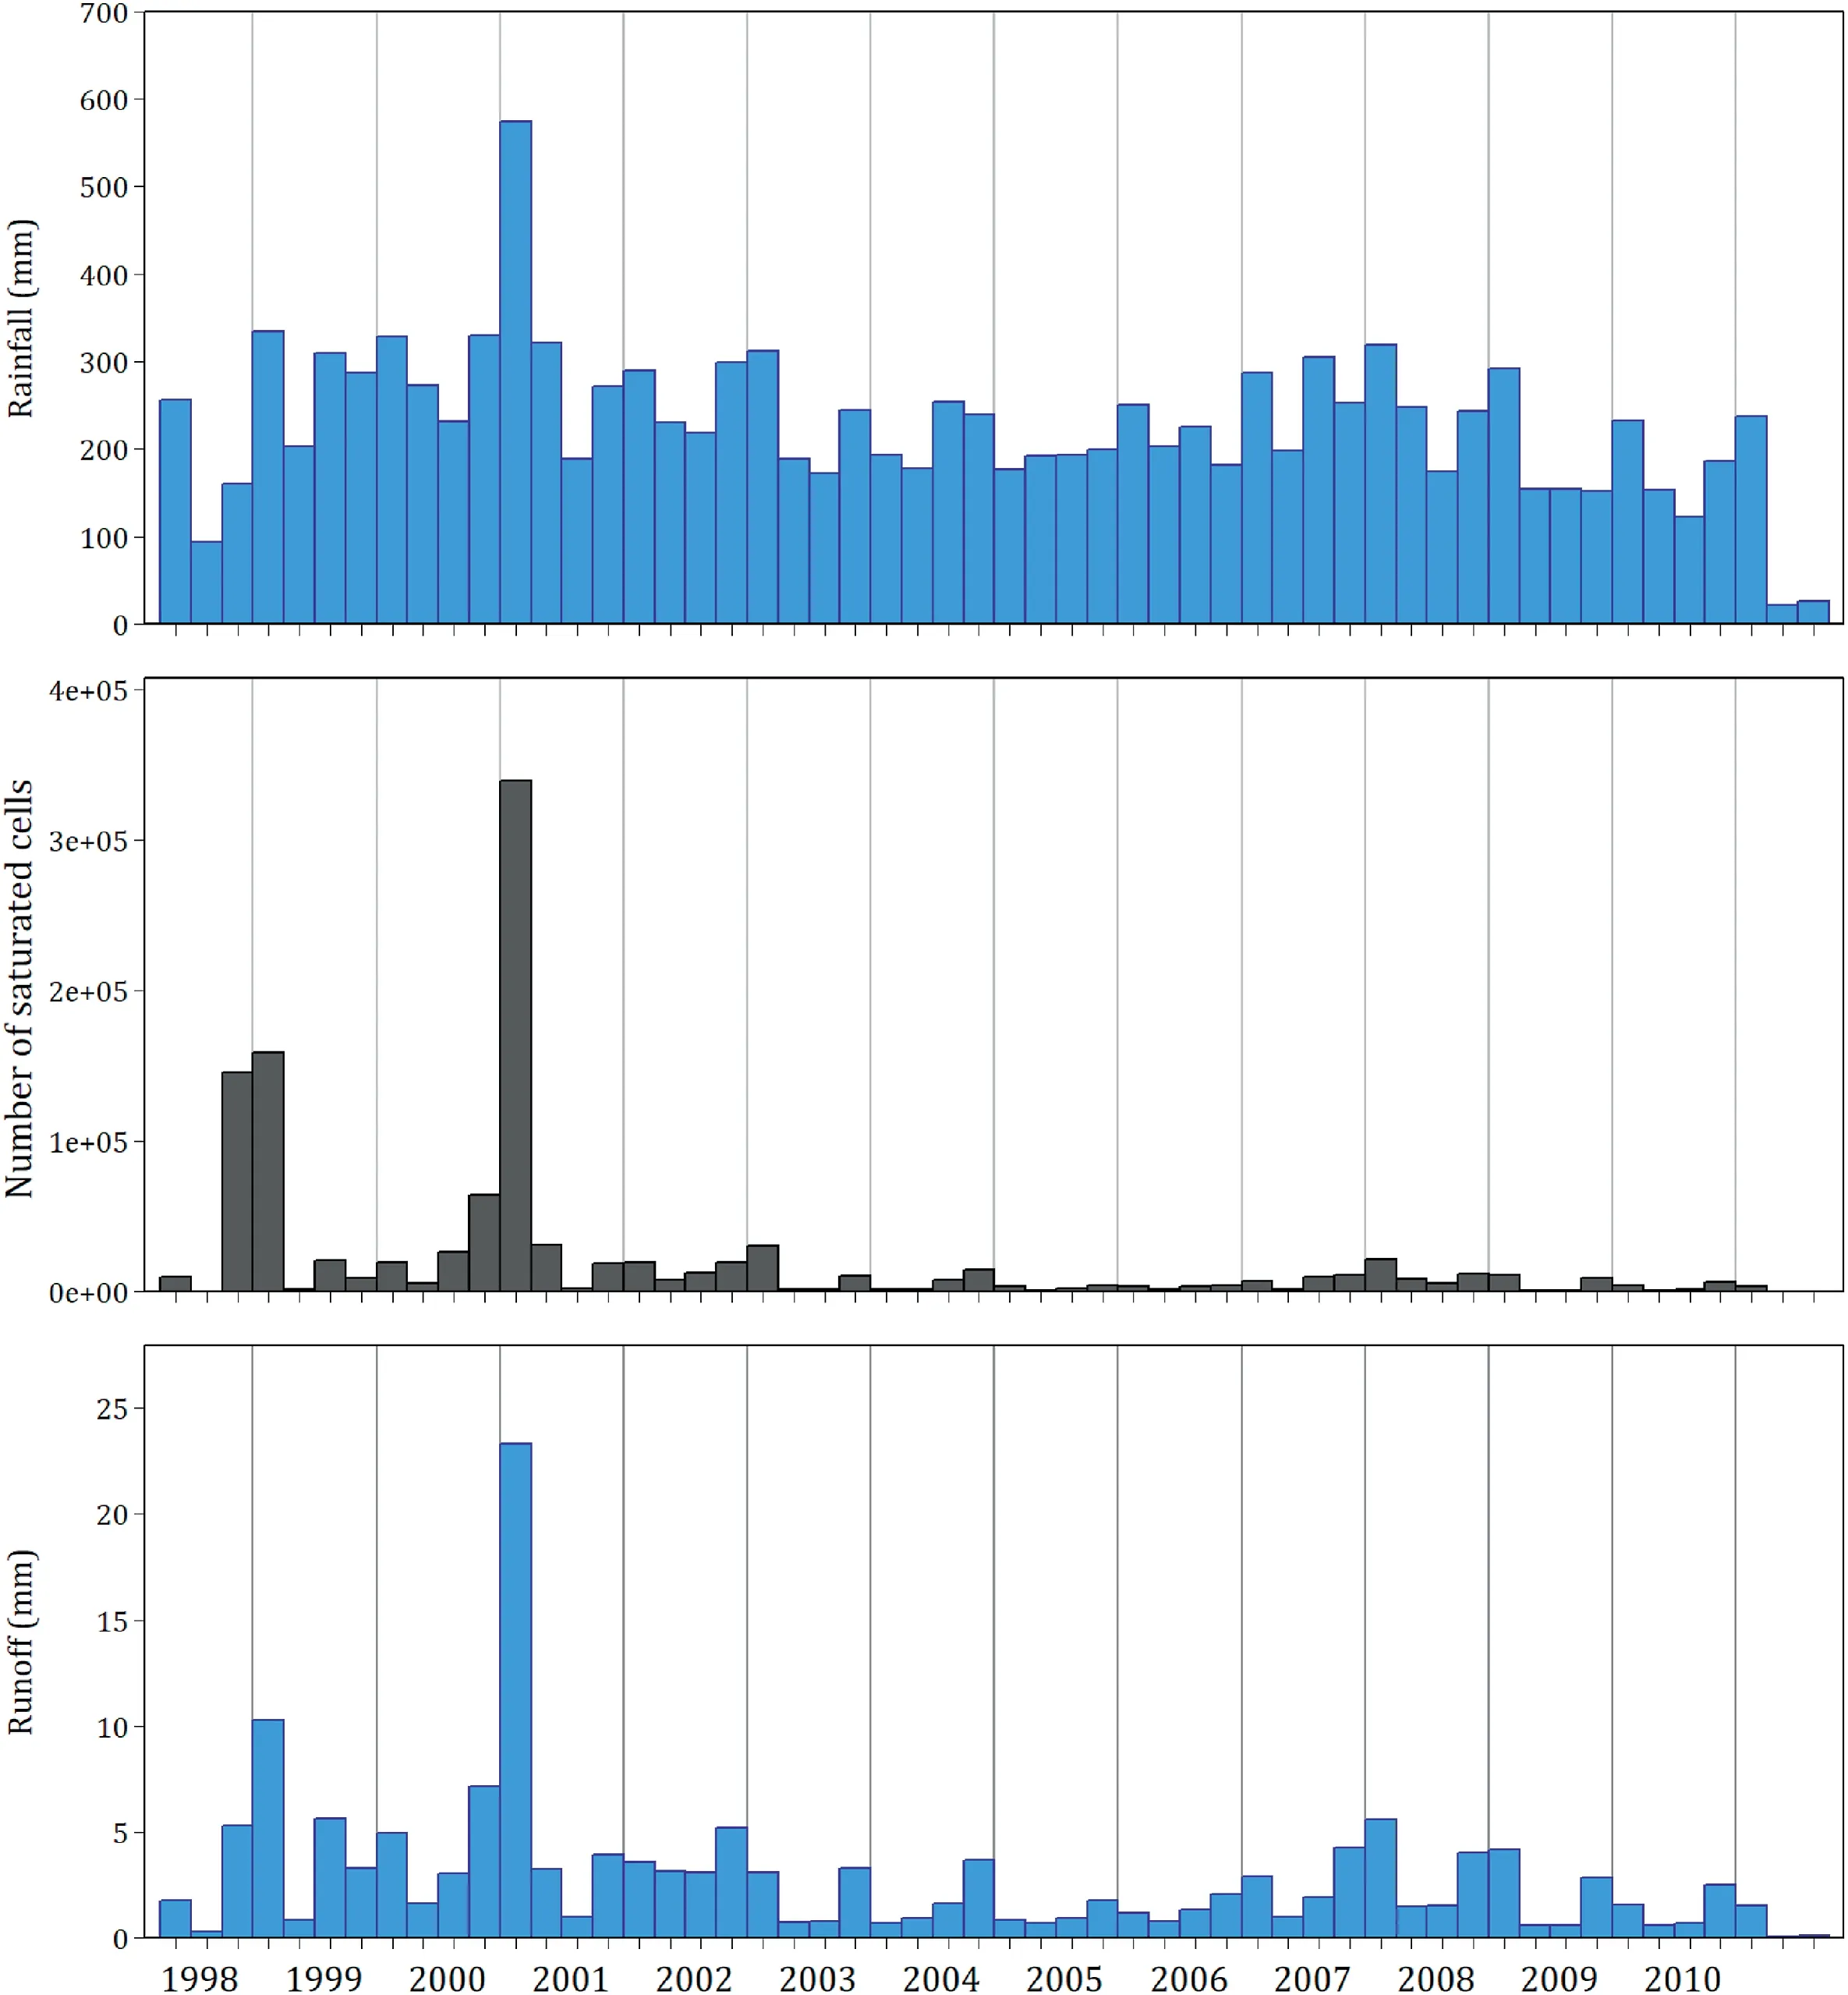
Fig.7.Rainfall, number of saturated cells and runoff depth calculated at the seasonal scale between 1998 and 2010 for the Austreberthe catchment.
In spite of low annual rainfall variability, the inter-annual variability of the runoff volumes and erosion rates at catchment outlets was high.The inter-annual variability of runoff and erosion is closely linked to the number of extreme events per year and their distribution through the year.The model was calibrated on a set of 35 representative rainfall events.The model performed equally well whether saturation-excess runoff was included during the calibration procedure or not, indicating the model robustness but suggesting potential equifinality issue.However, the model was unable to reproduce the runoff dynamics of three wet years included in the dataset if saturation-excess was not included in the model.It suggested that soil surface saturation, a process usually not taken into account when modelling runoff and erosion on cultivated well-drained luvisols of the European loess belts, might be an important process to account for.Interestingly, a seasonal analysis of the results suggested that saturation occurred during most of the modelled period, although sometimes at a limited intensity.The WaterSed model, able to model simultaneously infiltration-excess and saturation-excess runoff, may therefore be an interesting tool to study runoff and erosion in catchments where both processes are expected to occur.Although being a relatively simple model with limited parameters, it demonstrated its ability to model runoff including multiple (in this study, more than 780)rainfall-runoff events.It might therefore be a promising tool to study runoff and erosion across a variety of scale and help identifying the most relevant processes that should be studied further in a variety of context.
The first modelling studies in this context had demonstrated the need to use distributed models in order to account for hillslope spatial heterogeneities and redistribution processes (e.g.reinfiltration and deposition processes)at the rainfall event and hillslope scales.The current study brings a complement when moving to larger catchment (102-104km2), pointing to the need to integrate soil saturation processes.
Declaration of competing interest
The authors declare that they have no known competing financial interests or personal relationships that could have appeared to influence the work reported in this paper.
Acknowledgements
This research was funded by the AMORAD(ANR-11-RSNR-0002)project (Agence Nationale de la Recherche, Programme des Investissements d’Avenir).This work was also supported by the ANR project “RICOCHET: Multi-risk assessment on coastal territory in a global change context (2017-2021)” (ANR-16-CE03-0008).
Appendix A.Glossary
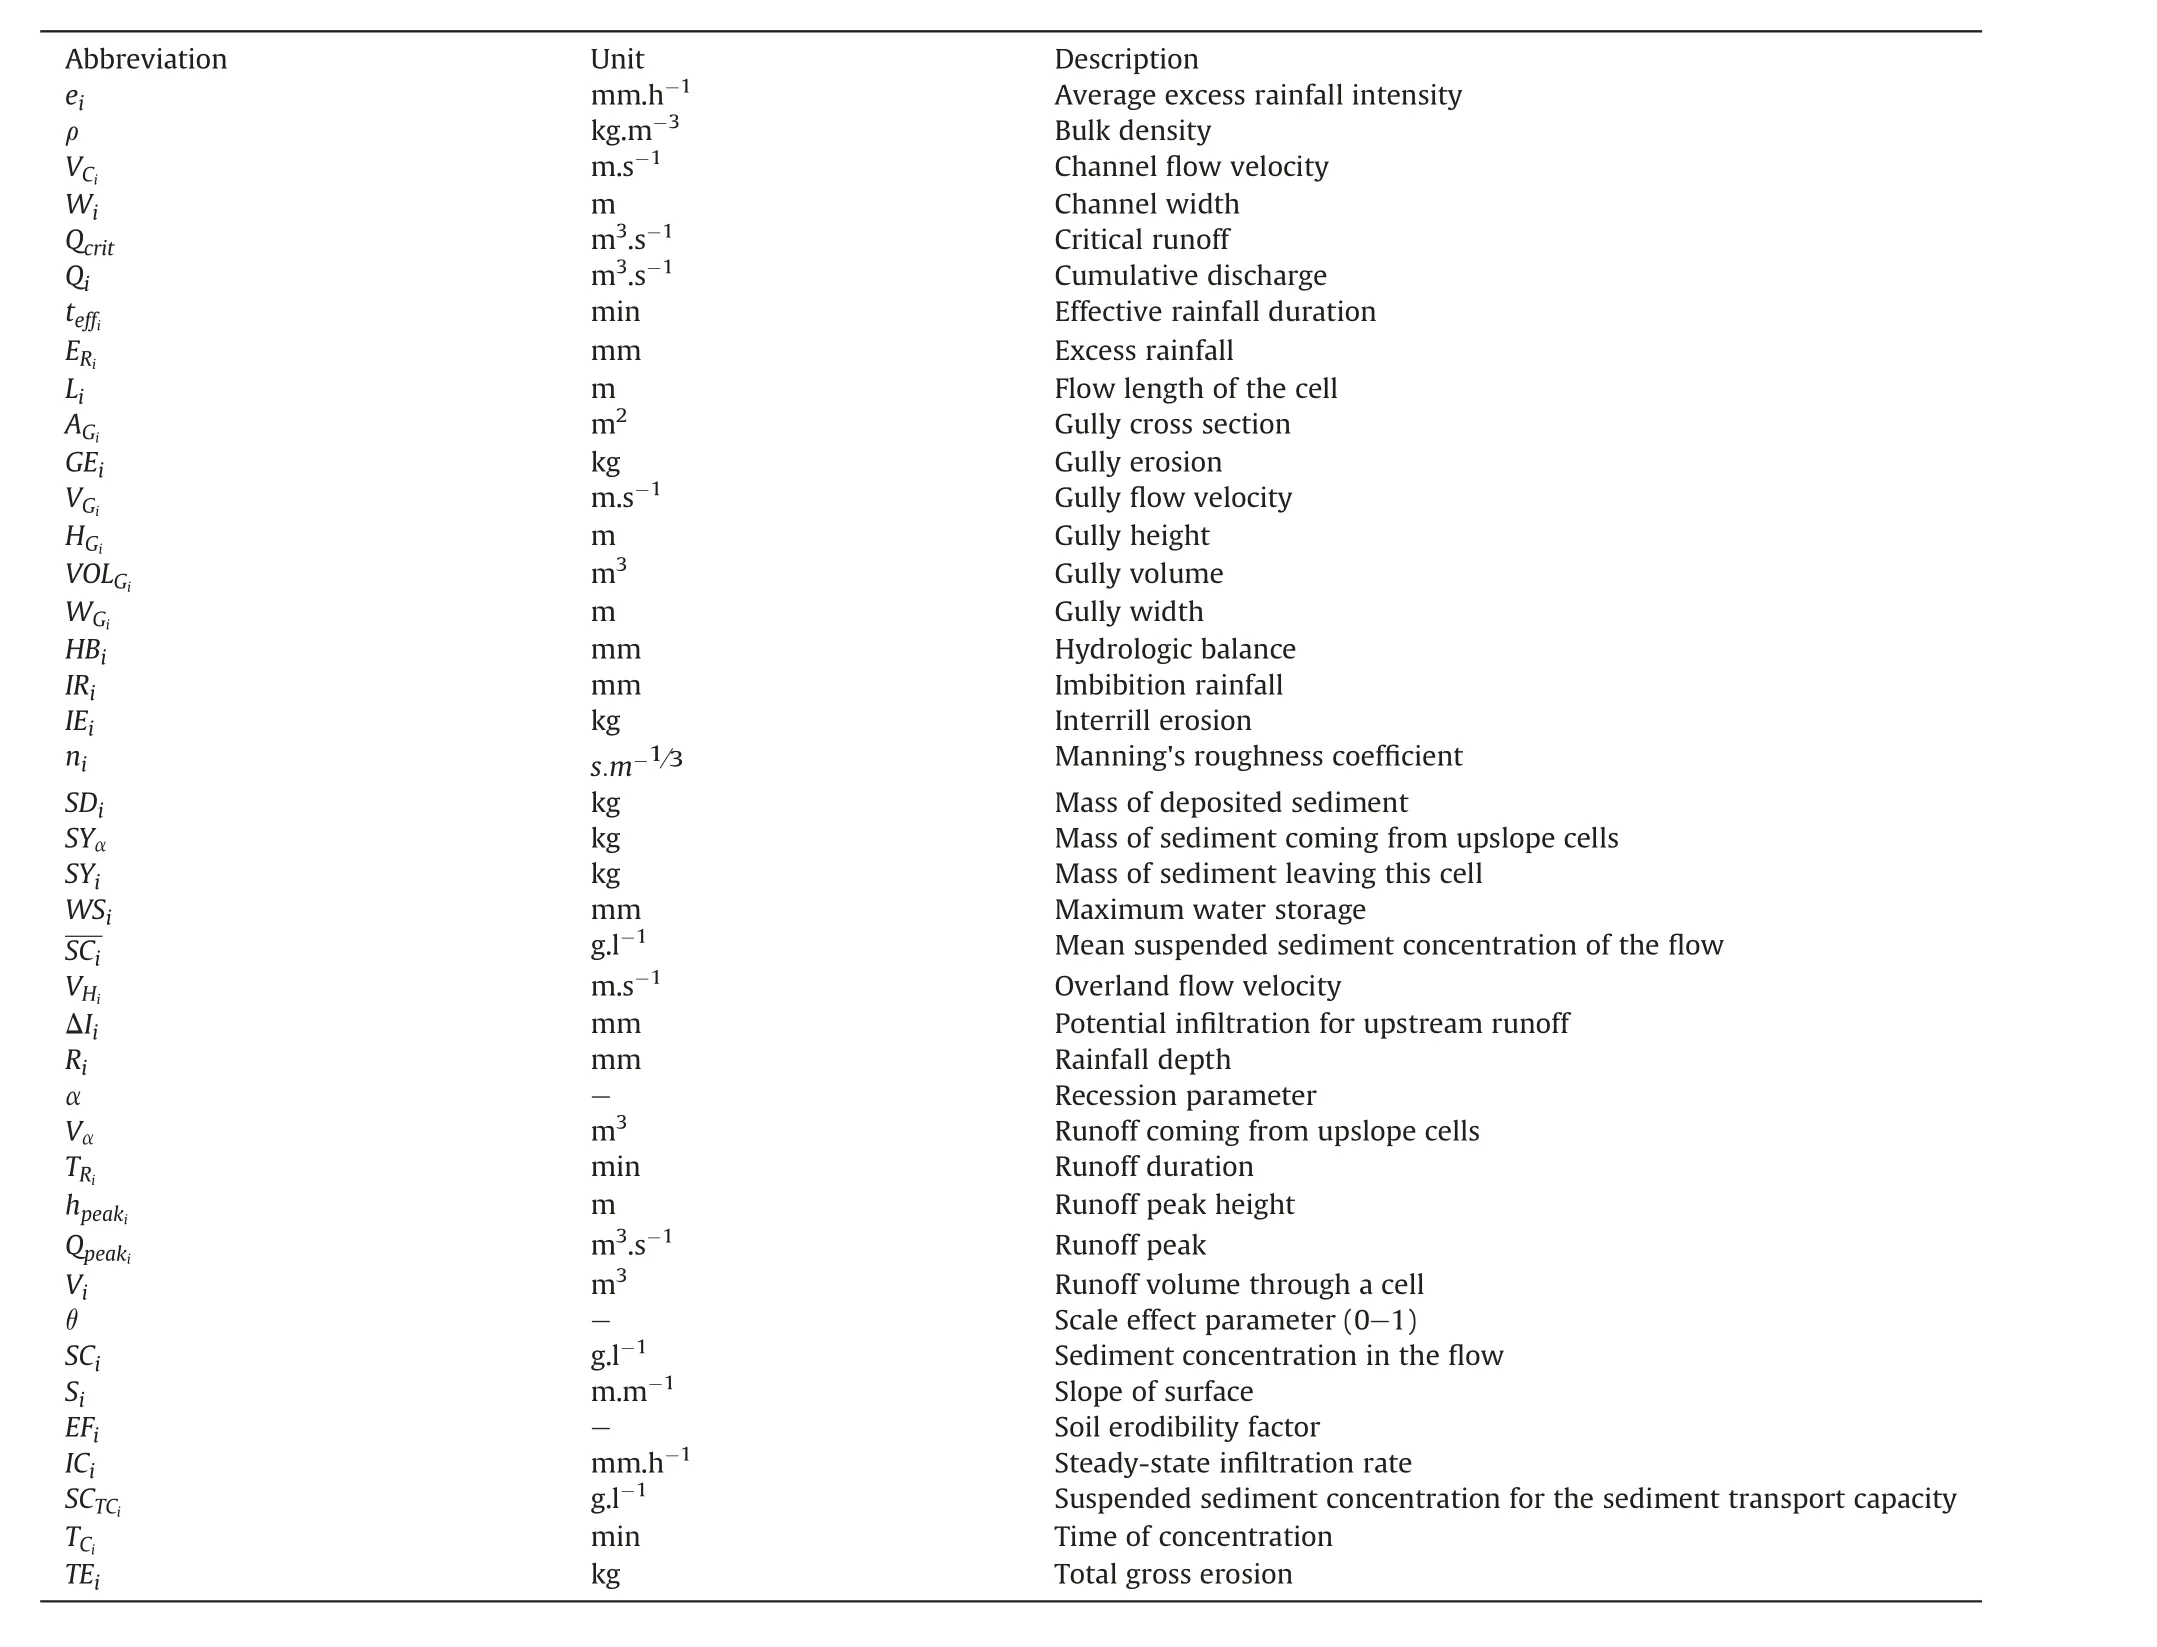
Abbreviation Unit Description ei mm.h-1 Average excess rainfall intensity ρ kg.m-3 Bulk density VCi m.s-1 Channel flow velocity Wi m Channel width Qcrit m3.s-1 Critical runoff Qi m3.s-1 Cumulative discharge teffi min Effective rainfall duration ERi mm Excess rainfall Li m Flow length of the cell AGi m2 Gully cross section GEi kg Gully erosion VGi m.s-1 Gully flow velocity HGi m Gully height VOLGi m3 Gully volume WGi m Gully width HBi mm Hydrologic balance IRi mm Imbibition rainfall IEi kg Interrill erosion ni s.m-1/3 Manning's roughness coefficient SDi kg Mass of deposited sediment SYα kg Mass of sediment coming from upslope cells SYi kg Mass of sediment leaving this cell WSi mm Maximum water storage SCi g.l-1 Mean suspended sediment concentration of the flow VHi m.s-1 Overland flow velocity ΔIi mm Potential infiltration for upstream runoff Ri mm Rainfall depth α-Recession parameter Vα m3 Runoff coming from upslope cells TRi min Runoff duration hpeaki m Runoff peak height Qpeaki m3.s-1 Runoff peak Vi m3 Runoff volume through a cell θ-Scale effect parameter (0-1)SCi g.l-1 Sediment concentration in the flow Si m.m-1 Slope of surface EFi - Soil erodibility factor ICi mm.h-1 Steady-state infiltration rate SCTCi g.l-1 Suspended sediment concentration for the sediment transport capacity TCi min Time of concentration TEi kg Total gross erosion
杂志排行
International Soil and Water Conservation Research的其它文章
- Legacy earthen berms influence vegetation and hydrologic complexity in the Altar Valley, Arizona
- Long-term trends of precipitation and erosivity over Northeast China during 1961-2020
- Atlas of precipitation extremes for South America and Africa based on depth-duration-frequency relationships in a stochastic weather generator dataset
- Towards a better understanding of pathways of multiple co-occurring erosion processes on global cropland
- Streamflow prediction in ungauged catchments by using the Grunsky method
- Calibration,validation,and evaluation of the Water Erosion Prediction Project (WEPP) model for hillslopes with natural runoff plot data
