Improvement of a temperature response function for divertor heat flux monitoring in fusion devices
2023-03-15XuanNhatSonBUIHirotoMATSUURAandYousukeNAKASHIMA
Xuan Nhat Son BUI, Hiroto MATSUURA and Yousuke NAKASHIMA
1 Quantum and Radiation Engineering Department, Osaka Prefecture University, Osaka 599-8570, Japan
2 Plasma Research Center, University of Tsukuba, Tsukuba 305-8577, Japan
Abstract Temperature response functions have been developed to investigate sensor design and divertor heat flux estimation in magnetically confined plasmas.The time-dependent heat flux can be derived by fitting the response function to experimental thermocouple(TC)data.Because the TC signals have a time delay to transit events such as discharge start or confinement transition, the time delay is taken into account in a temperature response function.Such a function accurately describes the signal from each TC channel with time delay in a sensor test using a neutral beam injection.Measurement for commercial TCs shows that the time delay is caused by the finite heat capacity of TC wire and contact heat resistance between TC and target surface.
Keywords: divertor, temperature response function, thermocouple system, primary delay
1.Introduction
International thermonuclear experimental reactor (ITER),which is currently under construction,is expected to be the first fusion device that produces net energy with fusion energy gain factor of more than 10.In steady-state,the plasma heat flux can reach 20 MW m-2and induce temperature increment in divertor plate, as well as other plasma-facing components(PFCs) [1, 2].SPARC tokamak, which is also under construction, is another candidate to obtain net energy with expected divertor parallel heat flux of more than 10 GW m-2[3].If the system’s cooling capacity is insufficient, the PFC target temperature will continue to rise, causing severe system damage.As a result, the heat flux must be kept under control for every fusion device to operate safely.Detached recombining plasma is a well-known method for reducing the heat load on the divertor plates [4].To verify the control ability of this process, developing divertor heat flux measurement is obligatory.This demands not only a value of temperature but also its time evolution for a precise and detailed heat flux evaluation.
Infra-red (IR) cameras with very high time resolution have been widely used in tokamaks to monitor divertor heat flux [5].This method does, however, have some drawbacks.Because an individual IR sensor can only measure temperature in a limited range, it is impossible to observe the temperature evolution from the start to the end of a discharge,making it impossible to evaluate the heat load for the entire plasma shot.Secondly, the range of surface emissivity by plasma-surface interaction may cause the uncertainties in temperature measurement [6].To compensate such uncertainties,IR thermometer needs repeated calibration with other thermometer such as thermocouples (TCs) or resistance temperature detector[7].In addition,if the camera positioning is not precise,the recorded images will deform and reduce the temperature accuracy.Since the sensor size in the divertor must be reduced and fast time response is required,using TCs is another solution for divertor plasma heat flux estimation.
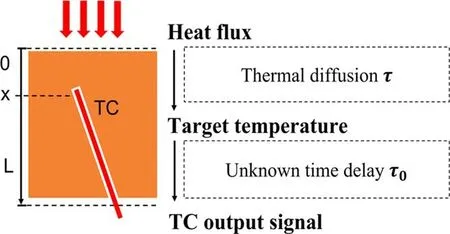
Figure 1.A schematic of a typical heat flux sensor.Target temperature can be delayed to the applied heat flux by thermal diffusion time τ, and unknown time delay τ0 in TC system can deform the output signals.
In [8], the heat flux evolution was indicated without temperature evolution, and how to deduce it was not fully explained.The time-dependent heat flux can be inversely evaluated from the TC temperature data using a suitable heat conduction model.Such a model assumes that the temperature measurement point is included in a control volume so that heat flux across the boundary, heat generation in the control volume,and internal energy evolution must all be balanced[9].The validity of our heat conduction model was confirmed via the experiment using hybrid directional probe in Heliotron J(Kyoto University, Japan) [10] and that using hybrid directional Langmuir probe in LHD (National Institute of Fusion Science, Japan) [11].
As an empirical phenomenon,a common time delay in the order of several hundred ms has been observed repeatedly in our sensors data.Figure 1 shows a schematic of a heat flux sensor which consists of a target with an embedded thermocouple inside.Target thickness and TC position from the irradiated surface are denoted by L and x, respectively.Regarding time delay in sensors, plasma heat flux causes an increase in target temperature with the delay of thermal diffusion time τ.By reducing target thickness L or setting TCs closer to the plasma irradiated surface, thermal diffusion τ can be lowered.
The target of this study is monitoring 1 MW m-2order heat flux change in a few 10 ms.Effect of time delay was considered in the heat flux measurements in Alcator C-mod [12].To overcome it, the surface TC [13] was developed and achieved very fast response.This method has recently been applied to the surface eroding TC to monitor heat flux in DIII-D[14].In Heliotron J divertor probes array (DPA) [15] and GAMMA 10/PDX calorimeter (University of Tsukuba-Japan) [16], TCs were set in the order of 1 mm from the irradiated surface.Even so,we were unable to effectively reduce the time delay in our TC output signal.The present work is conducted with consideration of the delay in the TC system such as circuit elements, TC radius, or contact between TC and target.Because it is difficult to categorize such delays without experimental measurement,we assume them to be an unknown time delay from the TC system,denoted by τ0,for a convenient calculation.To observe the evolution of heat flux in transient events such as discharge start, edge localized modes[17],Blob transport[18],or plasma detachment[19],we attempt to lower τ0to be from 10 to 100 ms.
Section 2 describes the primary delay mathematical model,which is used to describe TC signals subjected to time delay.Section 3 demonstrates the validation of our primary delay model using a calorimeter test with neutral beam short pulse.Section 4 discusses determining time delay in various experimental conditions.Section 5 is for discussion and section 6 is the summary.
2.Primary delay model
In mathematics,primary delay system with time delay τ0can be described as follows
where u(t) is system input, and y(t) is system output.Their relation is clearly given as
We developed several temperature response functions S(x, t) to investigate sensor design and sensor data analysis.Each function obeys the heat conduction equation and satisfies a certain boundary condition.S(x, t) describes the target temperature increment by the step-like heat flux
where t0is the duration of the constant heat flux, and the corresponding temperature increment during t0is
Temperature response functions for 3 different boundary conditions were provided in [7].Moreover, the asymptotic solution of insulation case in equation (4) of [7] contained a typo, the correct equation is described as follows
where t0is the heat pulse duration,κand α are heat conductivity and thermal diffusivity of target material,(2n+1)2,and
If the temperature response function(5)is combined with the primary delay equation(2),the influence of time delay τ0to S(x, t) can be described as
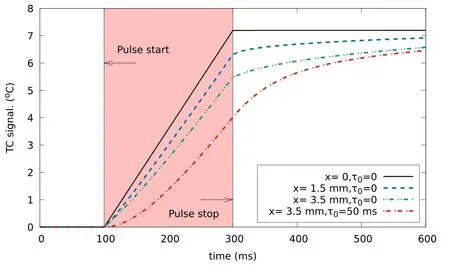
Figure 2.Effect of target diffusion time τ and the unknown time delay τ0 to TC output signal described by the primary delay model.
Using equations (4) and (6), the temperature evolution caused by the step-like heat pulse can be modeled.Figure 2 shows the model calculations for a copper target with a thickness of 1 cm.This target is assumed to be irradiated by a step-like heat pulse with a duration t0of 200 ms.If τ0is not taken into account and distance x between TC and the irradiated surface is small enough, the second term in equation (5) can be neglected.In this case, the TC signal demonstrates a linear increase during the timing of the heat pulse, as indicated by the black solid line.For signals deformed by thermal diffusion time τ, blue and green curves are modeled at x = 1.5, and 3.5 mm, respectively.The red curve describes the signal of TC set at x=3.5 mm with the effect of time delay τ0=50 ms.
The thermal diffusion time at x=3.5 mm delays both signals in the green and red curves.Moreover, the signal indicated by the red curve takes longer time to reach saturation due to the influence of the unknown time delay τ0.Accordingly, the heat flux estimation cannot be precise.To overcome this problem, experimentally reducing TC system time delay is necessary.Furthermore, artificially reconstructing the real temperature evolution from the observed signal has the potential to be promising.If the time delay τ0and derivative of output signal dy(t)/dt are obtained, the reconstructed temperature evolution can be deduced using equation (1).
3.Test with short pulse neutral beam
In[20],Osakabe et al proposed to experimentally deduce heat flux using a sensor consisting of two TCs.Our similar calorimeter,described in figure 3,was constructed to monitor the heat flux in the end-cell of GAMMA 10/PDX(University of Tsukuba) [9].The calorimeter includes two target components,each made of copper with a thickness of 10 mm.The TCs set at 1.5, and 3.5 mm from the irradiated surface correspond to diffusion time of 8 and 42 ms, respectively.
In this study, calorimeter response was checked in a neutral beam (NB) test stand which is used in GAMMA 10/PDX experiment.From the data of acceleration voltage and beam current,the energy of NB pulse is roughly estimated as 200 J.Insulation amplifiers(MTT Corporation MS3700)were used to improve the S/N ratio of TC signals.The NB pulse of approximately 10 ms induced relatively clear increments in TC signals with fluctuation from the power supply as shown in figure 4.Signals of various TC channels showed different responses.They started after NB pulse termination and reached the saturation value after several hundred ms.
Based on the calorimeter design and other parameters such as NB pulse timing,TC position x,received heat flux q0,and time delay τ0, the TC temperature evolution can be analytically reproduced using the primary delay model in equation(6).As shown in figure 5,the modelling calculations with τ0modification can clearly reproduce the experimental data whose fluctuation was removed by a low-pass filter with a cut-off frequency of 100 Hz.The main parameters for this calculation are shown in table 1.
Although the experimental and modeling data differed at times, the tendency in TC signal response can be described using the primary delay model.Further than the thermal diffusion time, other delays of approximately 80, 120, and more than 300 ms were assumed to involve the TC signals of channels 2, 3, and 1, respectively.
4.Time delay estimation
Through the test with NB short pulse, even though the TCs were set in the order of 1 mm from the irradiated surface for a faster response,another delay was expected to exist in the TC system.In this section, an investigation into time delay was conducted using commercial K-type TCs.
The time delay in the TC system was estimated in different experimental conditions.The experiment set-up is described in figure 6.A soldering iron was used as the heat source in the experiment.The heat receiving target,which is a molybdenum (Mo) plate with a thickness of 0.2 mm, had the same material and geometry as that of the plate-type calorimeter in Heliotron J DPA.TC was embedded behind the target and its signal was amplified to improve the S/N ratio before transmitting to an oscilloscope (OSC).The potential between TC and the soldering iron was recorded to check the connecting time between the heat source and target.From this timing, a temperature evolution can be generated analytically by the primary delay model in equation (6).Following that,the modeling calculation was compared to the experimental TC signal to determine the value of time delay.
Figure 7 shows a comparison of the experimental TC signal from a bare TC with a wire diameter of 1 mm and the corresponding model calculation.In this case,the heat source contacted TC in 0.18 s (from 1.88 to 2.06 s) resulting in the signal as indicated by the green scatter.The primary delay model can describe this signal well with the time delay of τ0=50 ms.The same experiments were carried out using bare TCs with wire diameter ranging from 0.25 to 1.5 mm.

Table 1.Primary delay model parameters in the NB test.

Figure 3.Design of calorimeter for heat flux estimation in GAMMA 10/PDX.Two TCs (channel 2 and channel 3) were embedded in in a same copper target.The TC in channel 1 was installed in another target for reference.
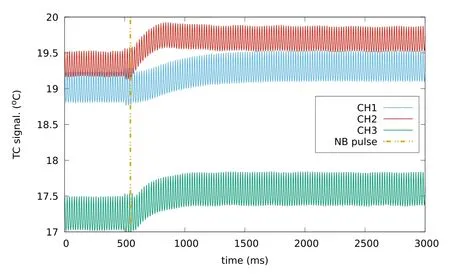
Figure 4.Raw TC signals from the neutral beam short pulse test.

Figure 5.Comparisons between model calculation and experimental TC signals after low-pass filtering in 3 channels (shot#210304-165921).
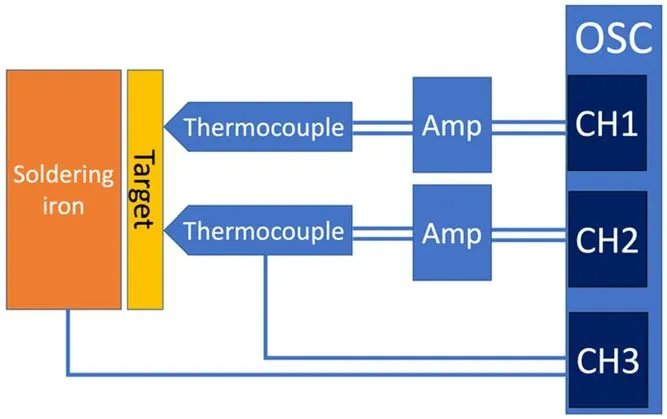
Figure 6.Experiment set-up for commercial TC time delay survey.
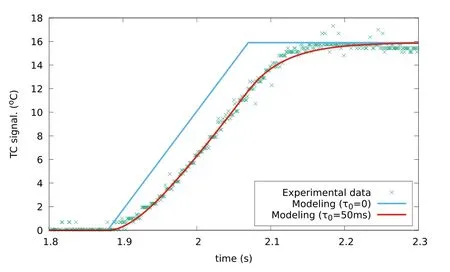
Figure 7.Result of the time delay survey for a bare TC with the radius of 1 mm.
Additionally, time delay in two different contact conditions between the TC and the target surface were also examined.To begin with, TC was only linked to the target.Second,using Kapton tape,TC adhered to the target.In each experiment, several values of time delay τ0were assumed,then the one that reproduced the best fit of modeling and experimental data was chosen as the representative value.Table 2 is the summary of the time delay investigation.
Time delay of insulation amplifiers in our TC system had been tested using the same method with estimated time delay τ0of approximately 2 ms.Subsequently, amplifiers may not have a strong influence on the time delay in a TC system.Concerning TCs, it was discovered that the intrinsic timedelay of each TC is proportional to its wire diameter.Moreover,the contact between TC and target surface can dominate the TC system time delay.If the same TC is tightly adhered to target surface,the corresponding time delay can be effectively reduced.

Table 2.TC delay estimated in different experimental condition.
5.Discussion
The primary delay model accurately describes temperature evolution under the influence of target thermal diffusion time and system time delay.In the NB test, the model calculation results fit better with signals from channels 1 and 3.The signal overshoot in channel 2 from 700 to 1200 ms is still being investigated.However, the hypothesis regarding time delay is not contradicted by previous research.Regarding TC issues, the intrinsic time delay of bare TCs is proportional to their wire diameters,owing to the differences in heat capacity.Furthermore,the time delay can be caused by the contact heat resistance between the TC wire and the target surface.If the TC is not tightly embedded,its output signal will have longer delay.From table 2, the longest time delay of 330 ms corresponds to the experiment in which the TC with 1 mm of wire diameter was only connected to the target surface.This delay was reduced to more than half(150 ms)when the same TC was tightly adhered to the target surface using Kapton tape.Using the same embedding method, TCs with smaller wire diameter could minimize the time delay to the expected range of 20-35 ms.
The TC system time delay τ0can be reasonably determined in advance with the well-defined response tests described in this paper.If a sensor has a good design and construction, the time-dependent heat flux during discharge start or plasma detachment can be reproduced.However,it is still difficult to distinguish fast-transient events like edge localize modes and Blob transport by using the sensors with embedded commercial TCs.
6.Summary
With the consideration of time delay in the TC system, a temperature response function has been modified that can successfully describe the delayed signals in experimental sensor data.According to the findings, the main causes of delayed signals in TC systems are the intrinsic delay of TC wires with finite heat capacity, and contact heat resistance between TC and target surface.Incorporating the primary delay model into the temperature response functions could be a promising method for future heat flux monitoring if the timed delay is measured in advance.When reducing such a time delay is impossible, a compensation method for reconstructing the real temperature evolution should be considered.This will be a task for further research.
Acknowledgments
The authors would like to thank the members of the GAMMA 10/PDX (University of Tsukuba) and Heliotron J (Kyoto University) for their collaboration in the experiments and helpful discussion.This work is partially performed with the support and under the auspices of the NIFS Collaborative Research Program (Nos.NIFS20KLPR051, NIFS20-KUHL099 and NIFS20KUGM153).
杂志排行
Plasma Science and Technology的其它文章
- Application of integrated simulation environment SIEMNED to the analysis of the MEPHIST-0 tokamak operation
- Degradation of sulfamethoxazole in water by dielectric barrier discharge plasma jet:influencing parameters, degradation pathway, toxicity evaluation
- Experimental investigation of dynamic stall flow control using a microsecond-pulsed plasma actuator
- Laser-assisted ablation and plasma formation of titanium explored by LIBS,QCM, optical microscopy and SEM analyses along with mechanical modifications under different pressures of Ar and Ne
- Study on the effect of focal position change on the expansion velocity and propagation mechanism of plasma generated by millisecond pulsed laser-induced fused silica
- Degradation of antibiotic contaminants from water by gas-liquid underwater discharge plasma
