A Novel Method of Deinterleaving Radar Pulse Sequences Based on a Modified DBSCAN Algorithm
2023-03-12AbolfazlDadgarniaMohammadTaghiSadeghi
Abolfazl Dadgarnia,Mohammad Taghi Sadeghi
Department of Electrical Engineering,Yazd University,Yazd,Iran
Abstract: A modified DBSCAN algorithm is presented for deinterleaving of radar pulses in modern EW environments.A main characteristic of the proposed method is that using only time of arrival of pulses,the method can sort the pulses efficiently.Other PDW information such as rise time,carrier frequency,pulse width,modulation on pulse,fall time and direction of arrival are not required.To identify the valid PRIs in a set of interleaved pulses,an innovative modification of the DBSCAN algorithm is introduced which is accurate and easy to implement.The proposed method determines valid PRIs more accurately and neglects the spurious ones more efficiently as compared to the classical histogram based algorithms such as SDIF.Furthermore,without specifying any input parameter,the proposed method can deinterleave radar pulses while up to 30%jitter is present in the associated PRI.The accuracy and efficiency of the proposed method are verified by computer simulations and real data results.Experimental simulations are based on different real and operational scenarios where the presence of missing and spurious pulses are also considered.So,the simulation results can be of practical significance.
Keywordst: deinterleaving; radar pulse sequences;density based clustering;pulse descriptor word
I.INTRODUCTION
One of the most important challenges of the Electronic Support Measure (ESM) and Electronic Intelligence(ELINT) systems is how to separate pulses from different radar emitters and assign them into different groups accordingly [1].In such systems,each group of pulses is known as a target.It is essential for each target to have true pulses,i.e.every pulses of a specific target must belong to a specific emitter too.
Generally,in modern Electronic Warfare (EW) environments the process of sorting radar pulses is done within two steps.First,based on the information of Pulse Descriptor Word(PDW) including Time of Arrival (ToA),Pulse Width (PW),Direction of Arrival(DoA),Radio Frequency (RF) and Pulse Amplitude(PA) (or power),a clustering process is performed in order to simplify the deinterleaving process.Of course,in some systems more features are included in PDW,which are rise time,band width (BW),fall time and modulated on pulse(MoP).Then interleaved pulses of different emitters that belong to a same cluster are deinterleaved after Pulse Repetition Interval(PRI)estimation process.Adopting PDW and the features which can be directly derived from PDW,is the main focus on studies in this field.Some efforts in this field can be found in [2—7].But the process of deinterleaving radar pulses is not so easy due to two main reasons: plurality of radars with similar parameters and existence of radars with variable parameters.Variation of the radar parameters is very popular in modern Multi Function Radars (MFRs) and some researches such as[2]and[3]address this issue.In such a condition,DoA is a critical parameter in real time applications,because radars cannot change their positions as fast as their PRIs.So,ideally DoA stays constant (regardless of Direction Finding (DF) errors) in every analysis window.Some other parameters such as scan time and scan type are also helpful.For example,in[2],in addition to DoA,RF and PW,scan time is used as the fourth feature which helps to improve the deinterleaving of radar pulses in dynamically varying signal environments.However,scan time is usually achieved after a long period of time.For instance,for a radar which circularly scans its surroundings with a speed of 30 Rounds Per Minute (RPM),(the maximum simulation value in [2]),at least 8 seconds of data should be received in order to estimate the scan time assuming that the period can be estimated after 4 successive scans.Therefore,such methods cannot meet the speed requirements of online applications.
In recent years,Machine Learning (ML) and Deep Learning(DL)methods have been applied in this context [8—16].These approaches are used for identification,recognition and classification of radar signals,so they can be used for extracting BW and MoP features which are very valuable properties for deinterleaving radar pulses.But,unfortunately these features are not easily extracted.First,it is necessary to transform RF signals to Intermediate Frequency (IF) band and then convert them to digital samples with a proper rate.These processes require extra hardware which significantly increase the cost and size of the systems.Moreover,for adding BW and MoP to PDW,the feature extraction methods should be implementable on processing cards.
Another feature which obtains from PDW information without any need to extra hardware and recording data for a long time,is PRI.It is a very good separating feature which can be used in clustering process [17—21].The main problem with the PRI is that several pulses(between two to tens,based on the modulation complexity)of a same target should be available in order to estimate the related PRI accurately.Therefore,irrespective of sorting method,estimating valid PRIs in a set of interleaved pulses is an important issue in modern ESM and ELINT systems[22—24].Moreover,in a set of interleaved pulses of different sources with similar parameters,the only distorted parameter which can be detected in raster plot is PRI(first difference of ToA vs.ToA).In this framework,main PRI modulation types have to be taken into account[1].
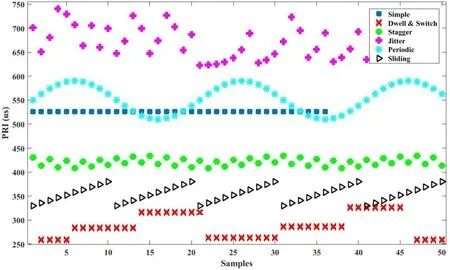
Figure 1.Six different types of PRI modulation.
Generally,radars have six types (modulations) of PRI namely simple,dwell and switch,staggered,jittered,sliding and periodic [1].In simple modulation,a fixed value for PRI is considered and radar emits its pulses with the fixed period.Only a very low jitter (less than 1 percent) can be tolerated in this type of modulation.In dwell and switch modulation,radar has some different values for PRI and after sending several pulses with a specific PRI value in dwell time,it switches to another value and continue sending with that period until the second switch time and this routine continues up to the last PRI value (level).Staggered PRI,similar to dwell and switch,contains several levels of PRI,but in this modulation,radar switches between these values pulse to pulse.In ascending/descending sliding modulation,radar starts with a specific PRI,increases/decreases its value linearly,stops in another specific PRI and continues sending with the same strategy.Jittered PRI is the most disordered one in which PRI varies up to 30%of a mean value.Finally,in periodic(wobulated)PRI modulation,a central value is considered for the PRI and the value is changed sinusoidally.In Figure 1,these six kinds of PRI modulation are depicted.
Therefore,to detect radars with different PRI modulation,deinterleaving method must be robust against high percentages of jitter.In this paper,a powerful method for deinterleaving of radar pulse sequences is proposed.The method that is a modified form of Density Based Spatial Clustering of Applications with Noise (DBSCAN) algorithm is robust against high variations of PRI and destructive effects of missed and spurious pulses.It is shown that this method is more accurate and faster in comparison with the traditional histogram based methods.In the next section,after a brief discussion on well-known DBSCAN clustering method,a modification to this algorithm is proposed which is suitable for deinterleaving purposes.Then,a complete discussion of proposed method is presented in Section III and its efficiency is verified via computer simulation in Section IV.Section V is dedicated for evaluating the method with real radar data.Some ideas for future work are presented in Section VI and finally,we conclude our paper in Section VII.
II.MODIFIED DBSCAN ALGORITHM
Before introducing a proper modification of traditional DBSCAN algorithm,which is useful for recognizing valid PRIs in a set of interleaved pulses,let us briefly review the main algorithm and its definitions.The primary aim of DBSCAN algorithm proposed by Ester et al.(1996) is to discover arbitrarily shaped clusters in a multidimensional feature space[25].To describe the algorithm,it is necessary to define and note several concepts first:
2.1 Neighbourhood of a Point
Theϵ_Neighbourhood of a point x is defnied as:
whereyis the set of points in the neighborhood ofx,Dis the data set,d(.,.) introduces a certain distance function andϵis an important input parameter called neighborhood radius[26].
2.2 Directly Density-Reachable
A pointxis directly density-reachable from a pointyif two conditions are satisfied:
1.x ∈Nϵ(y);
2.|Nϵ(y)|≥Nmin,where|Nϵ(y)|is cardinality and denotes the number of points inNϵ(y)andNminis the other input parameter which determines the minimum number of points in a core point neighborhood([26]).
2.3 Density-Reachable
A pointxis said to be density-reachable from a pointyif there exist a chain of directly density-reachable points starting fromxand terminating toy.The mathematical representation of this definition is as follows:In a sequence of pointsx=x1,x2,...,xi=y,xis density-reachable fromyifxjis directly densityreachable fromxj+1for allj=1,2,...,i −1([26]).
2.4 Density-Conected
Two pointsxandyare said to be density-connected if both of them are density-reachable from a common core point ([26]).A point with at leastNminpoints in its neighborhood is called core point.The above definitions can be visualized as shown in Figure 2.It is clear that directly density-reachability and densityreachability are not symmetric in general; i.e.ifxis directly density-reachable fromy,there is no warranty foryto be directly density-reachable fromx.Densityconnectivity,however,is a symmetric concept([26]).
Now,the concept of a cluster can be understood using above definitions.A clusterCis a subset of whole data setDand is defined as a set of densityconnected points with maximum density-reachability.Mathematically,a cluster must satisfy the following two conditions:
1.Maximality:∀xi,xj ∈Difxi ∈Candxjis density-reachable fromxi,thenxj ∈C.
2.Connectivity:∀xi,xj ∈C,xiandxjare densityconnected.
The original DBSCAN algorithm is widely used today.This is due to its ease of implementation and its ability to find arbitrary shaped clusters.Moreover,the algorithm is robust against noise and outlier.However,this algorithm involves some limitation and disadvantageous.The major limitation is that the algorithm performance is highly dependent on two input parameters (ϵandNmin).Improper selection of each parameter will degrade clustering results dramatically.Therefore,some researchers have focused on various possible ways to overcome this problem e.g.[27—31].Also,in some applications,it has been shown that the original DBSCAN algorithm does not lead to satisfactory results and some modifications are required.The reader can refer to [32],[33],and [34] to see several modifications.
In this paper,according to our special feature space,we introduce a modified version of the DBSCAN algorithm (MDBSCAN) which successfully discovers valid PRIs of different radars in an interleaved set of pulses.The feature space considered here consists of two dependent parameters: TOA and its difference,say PRI.According to definitions,ifkthandkth+1pulse of a specific radar are received at timeTOAkandTOAk+1respectively,then:
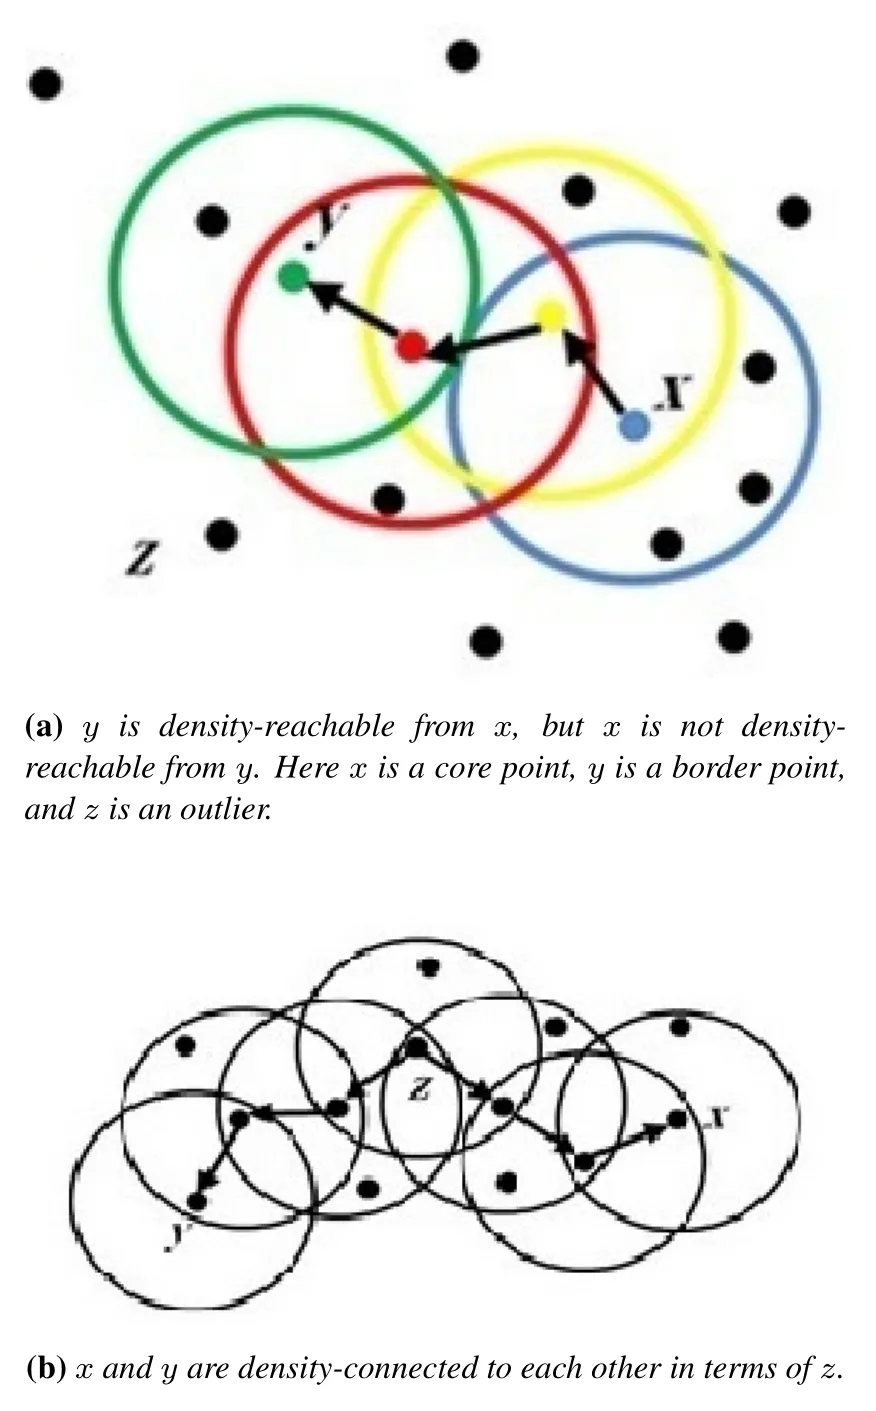
Figure 2.Concepts of density-reachability and densityconnectivity.The parameter Nmin is set as 3.
So,if we considerTOAas x-axis andPRIas yaxis in our two dimensional feature space,the neighborhood around a pointacan be defined as:
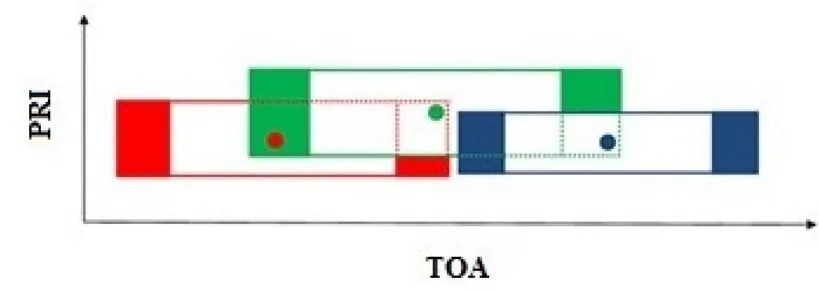
Figure 3.Representation of points in feature space and their corresponding neighbourhood.Note that according to(3),the neighborhood regions at both sides of a point must be square and figures may not be scaled properly.
where(xa,ya)represents the location of a point in the feature space andjitis maximum tolerable jitter associated with PRI which is at most 30% of central PRI.Obviously,this neighborhood has various areas for different points according to their PRIs(unlike the original DBSCAN algorithm in which neighborhood is only based on a predetermined radius using specific distance function).The concept of neighborhood can be understood from Figure 3,in which different colors distinguish each point and its corresponding neighborhood.As it can be seen,it is probable for a pointato be in the neighborhood of another one,sayb,whilebis not in the neighborhood ofa.
Except the neighborhood concept,all other definitions are the same for the proposed modified algorithm and the original one,as illustrated in Figure 4.Of course,it must be noted that in the modified version,there is no need to a predetermined value for neighborhood radius predetermination since this parameter is automatically adjusted according to PRI at each point(see((3))).On the other hand,it can be shown that the maximum number of neighbors for a point is 2 (see Lemma 1,Figure 5 and Figure 6)andNminis necessarily 1.Therefore,no input parameter is required.
Lemma 1.According to the neighborhood definition proposed for the modified DBSCAN,at most 2 points can lie in the neighborhood of a point (one point at each side)and consequently Nmin=1.
Proof.Suppose two points lie in the right side of a point neighborhood as depicted in Figure 5.Using(3):
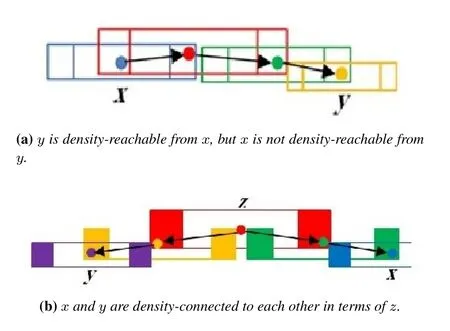
Figure 4.Concepts of density-reachability and densityconnectivity in modified DBSCAN algorithm.
and
On the other hand,from the primary assumption and as illustrated in Figure 5:
But,sincea,bandcare successive pulses,the conditions satisfied foraandbmust also be satisfied forbandc.So:
Therefore 4 conditions forxcmust be satisfied simultaneously:
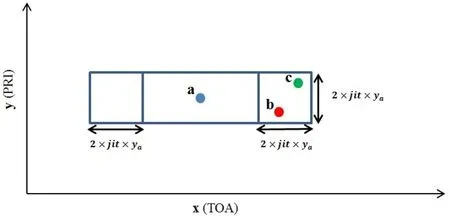
Figure 5.Two points lie in a point neighbourhood.
Butyaandybare related according to (4).So (8)can be written as:
From(9a)and(9d)we have:
whereas from(9b)and(9c):
The acceptable bounds for jit can be obtained by intersection of (10) and (11) (0.382< jit <1.618)which is in contrast with our primary assumption that maximum jitter value is 30%of PRI.So,xcdoes not satisfy 4 conditions of (9) simultaneously.A similar result will be achieved if we suppose two points lie in the left side of the point neighborhood.
To see how the algorithm discovers valid PRIs in a set of interleaved pulses,consider a simple scenario as shown in Figure 6.In this scenario,pulses of three different emitters with 1 ms,0.33 ms and 1.3 ms PRIs are interleaved.In Figure 6a,amplitude of the pulses is plotted versus their TOAs whereas in Figure 6b the neighborhood around each point is highlighted.As it can be seen,in some periods of time,several successive pulses are received from the same emitter so the algorithm must group them together as a cluster,but in periods that interleaving is occurred no valid PRI is discovered and the algorithm must form no cluster.This routine is illustrated in Figure 6c,in which 6 clusters are discovered,despite the fact that the pulses of three radars were interleaved.This conflict can be easily solved by a meaningful strategy as a subroutine of the complete algorithm and will be discussed in the next section.The other concern related to this routine is that only two valid PRIs out of three radar PRIs can be seen in the formed clusters.The radar withPRI=1.3msis not discovered,moreover a spurious PRI around 0.17msis reported.In the next section,how to overcome these defeats will be fully described and a novel method to deinterleave radar pulse sequences is presented.
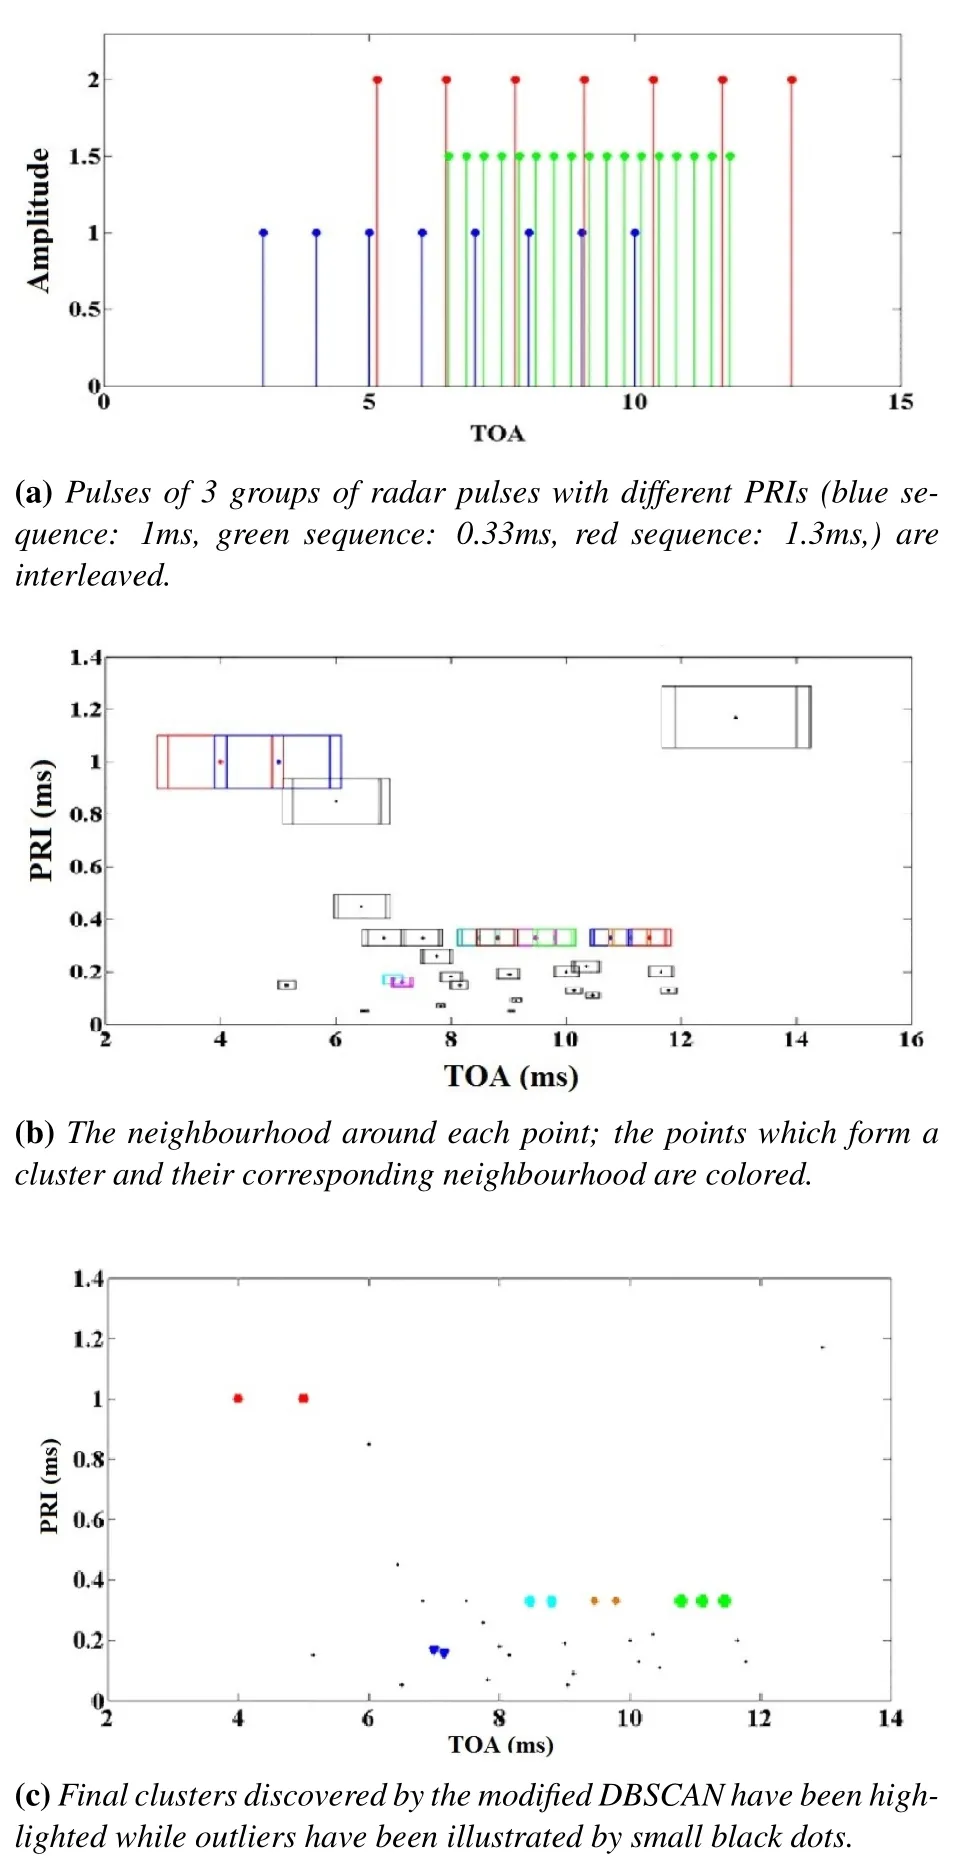
Figure 6.Interleaving of 3 pulse sequences and the final clusters discovered by the MDBSCAN algorithm.
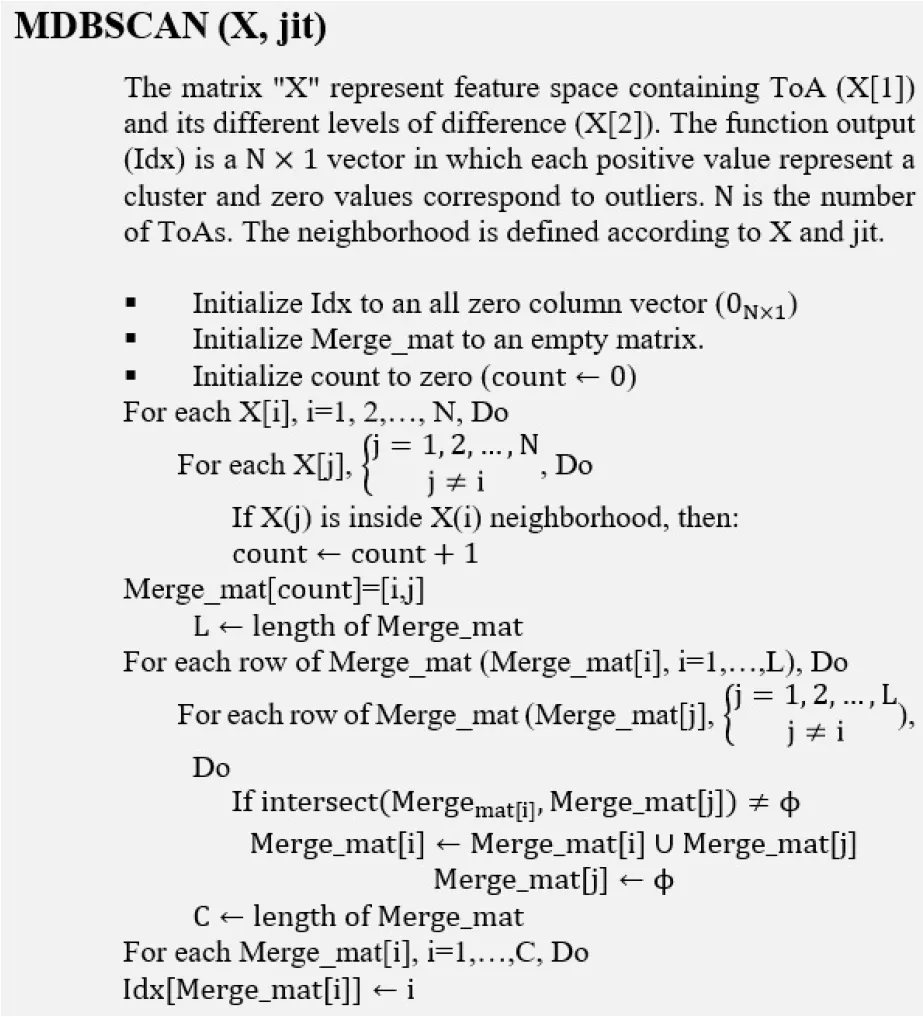
Figure 7.MDBSCAN subroutine.
III.THECOMPLETEPROPOSED METHOD
As mentioned in the previous section,the aforementioned modified DBSCAN,whose pseudo code is depicted in Figure 7,is a good start.This algorithm is able to find several valid PRIs in a set of interleaved pulses.However,if the algorithm is terminated in this primary stage,a satisfactory result may not be obtained due to the mentioned defects.
The problem of spurious PRIs can be removed by searching for a sequence of the detected PRI.The pseudo code of this subroutine is depicted in Figure 8.In fact,if only a very few pulses are found for a specific PRI,that PRI is considered as a spur one.On the other hand,if considerable pulses are discovered for a PRI,those pulses are a target candidate and,are known as a trusted target which must be saved in the related database.The trusted target pulses are then removed from the set of interleaved pulses and a similar routine is performed from the beginning.This repetitive procedure,extracts more valid PRIs.For example,in the scenario discussed in Figure 6,after finding two valid PRIs (0.33msand 1ms) and expanding them,blue and green pulses are deleted from the whole set and the other valid PRI (1.3ms),i.e.the red pulses,is discovered.Therefore,both mentioned problems in previous section can be solved.
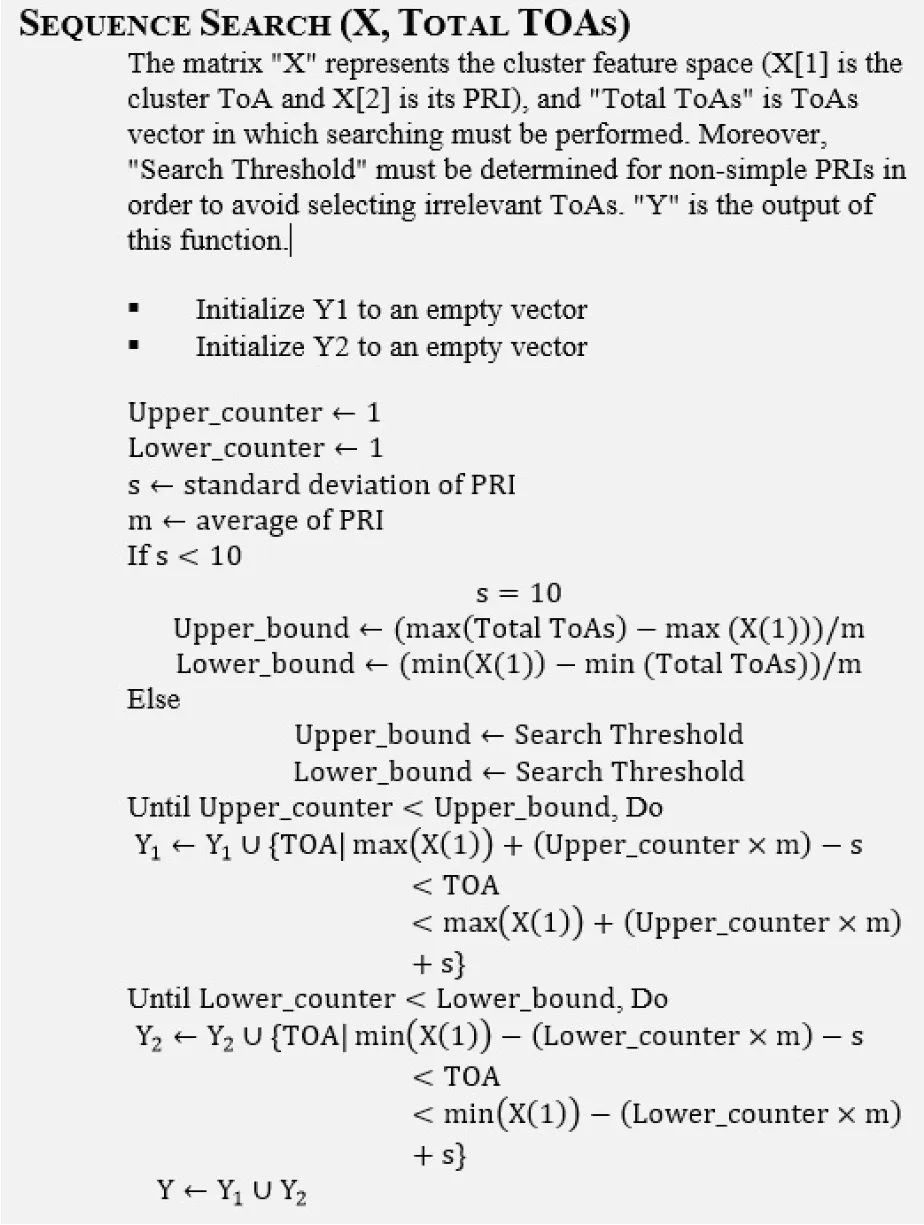
Figure 8.Sequence Search subroutine.
The other question about the proposed method is how to deal with the situations where several clusters are discovered by the modified algorithm.Another subroutine calledchoosing the best clusteranswers this question (for complete pseudo code,refer to Figure 9.This subroutine underlines that the cluster with maximum number of members is preferable,but if two or more clusters equally satisfy this condition or all clusters have just two members,the one with least standard deviation of PRI is selected.

Figure 9.Choosing the Best Cluster subroutine.
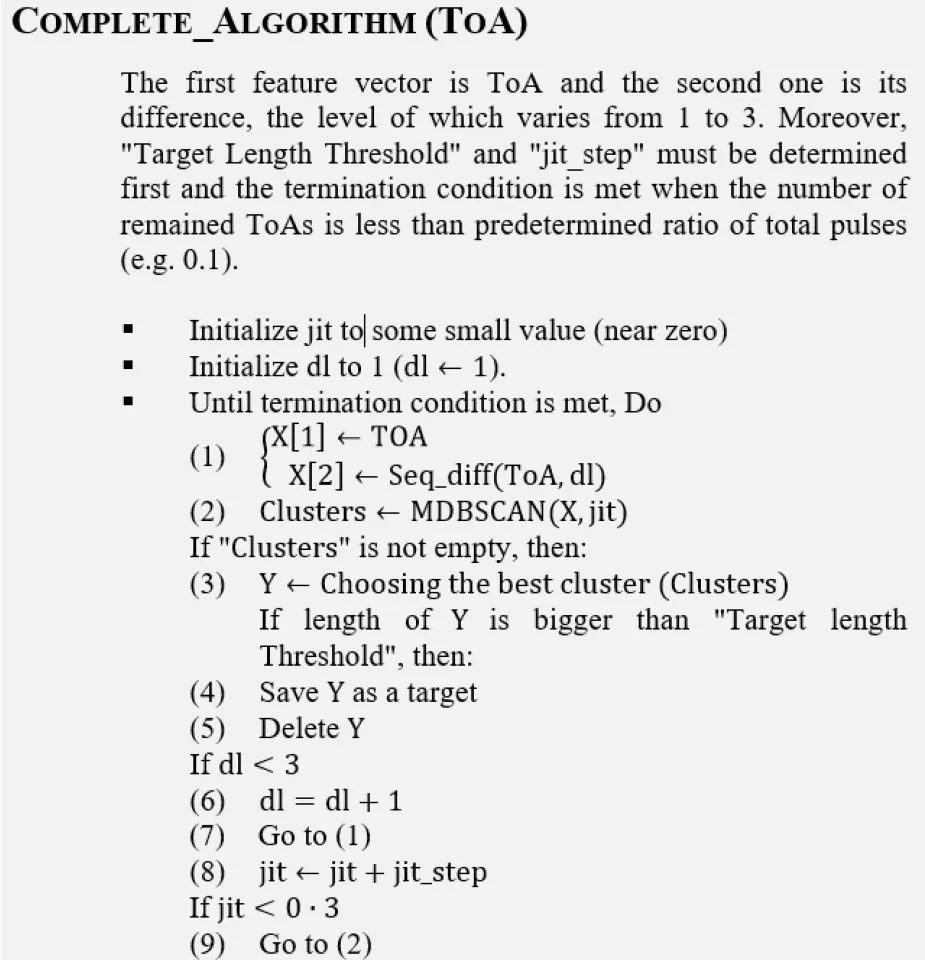
Figure 10.Complete pseudo code of proposed algorithm.The function Seq −diff(TOA,i)computes ith difference level of TOA.
Another important issue is that the modified DBSCAN algorithm leads to different neighbourhood regions for various jitter values and consequently different clusters are formed.So,the above routines have to be repeatedly executed for different jitter values.It should be noted that it is logical,of course,to start with low jitter values (around zero) to find crisp PRI values of simple modulation and then increase this value smoothly to discover other types of modulations step by step.Finally,we should also care about the situations in which no valid PRI is obtained from the considered feature space,ToA and its first difference level(dl).In such situations,valid PRIs can be determined from higher level differentiations of ToA.Our simulations show that,despite traditional histogram based methods such as Cumulative Difference (CDIF) and Sequential Difference (SDIF) in which the levels of difference may be large,in this algorithmdl=3 is a good choice for the most cases even with high pulses densities.
Therefore,as it can be seen from the complete pseudo code of the proposed algorithm in Figure 10,for each jitter value and for the first,second and third levels of differences,modified DBSCAN,choosing thebest clusterandsequence searchsubroutines should be iteratively performed.
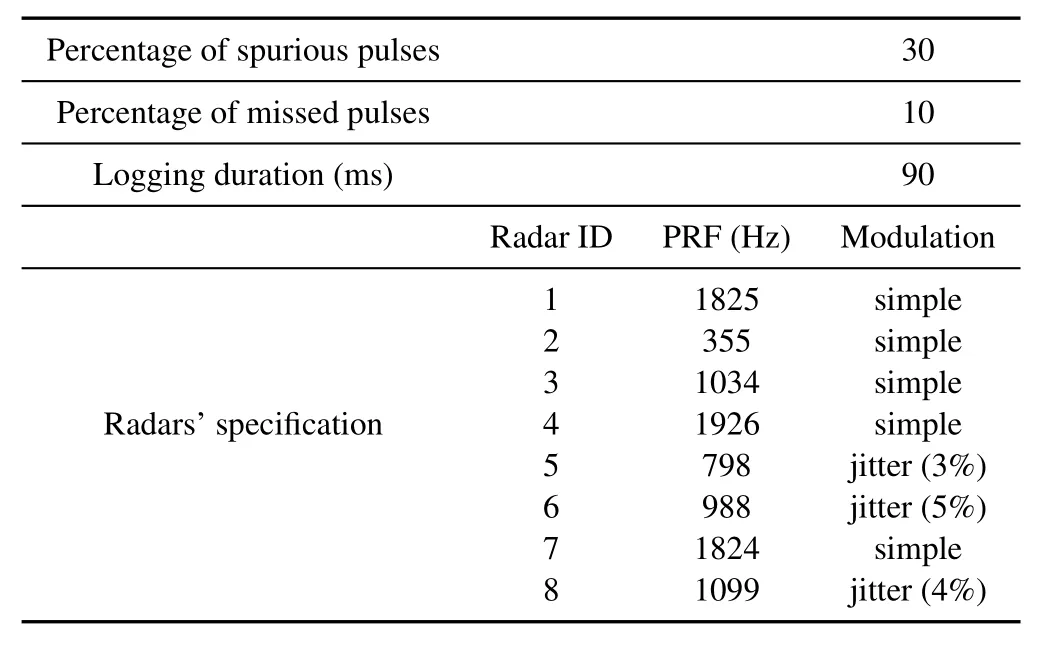
Table 1.The complete specifications of scenario 1.
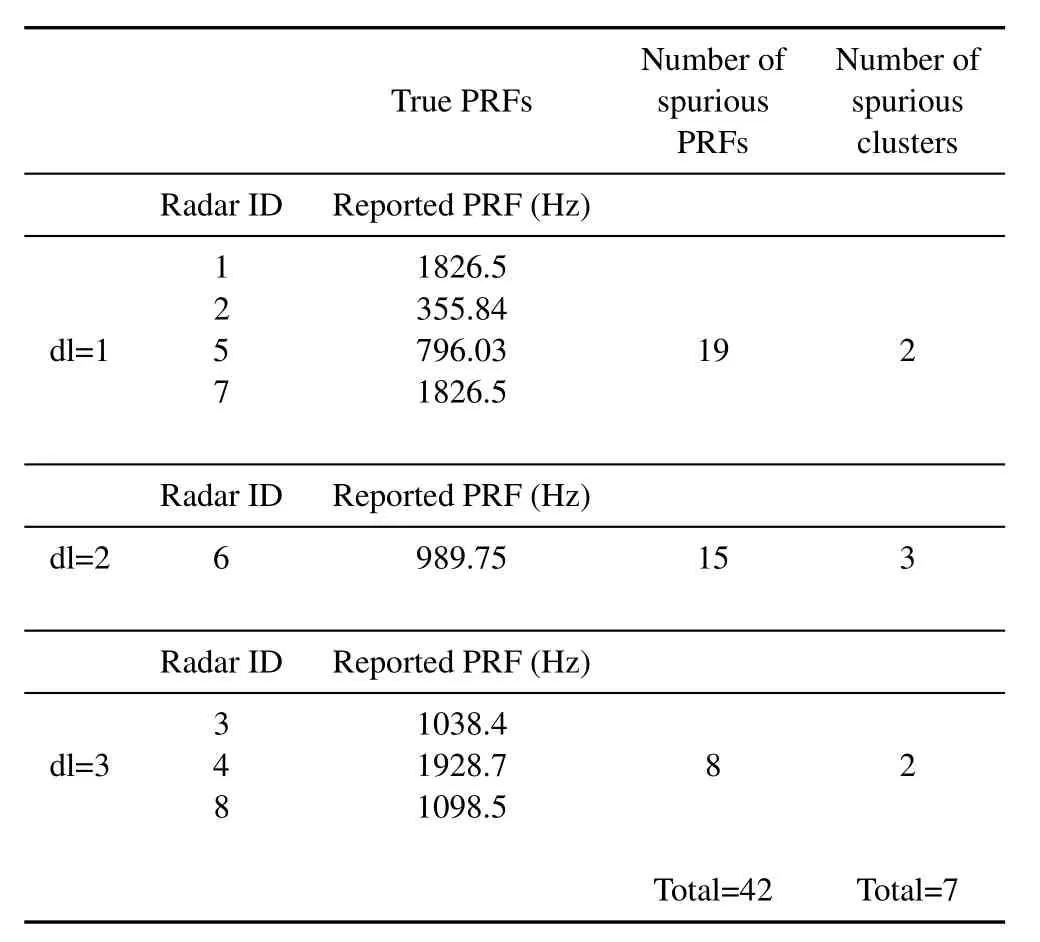
Table 2.True and spurious PRFs and clusters reported by SDIF(Scenario 1).
IV.SIMULATION RESULTS
In the previous section,we presented and described the proposed algorithm for deinterleaving of radar pulse sequences.In this section,the accuracy and efficiency of the proposed method is evaluated via computer simulations.
First,various scenarios are considered which differ from each other in number of radars,percentage of spurious pulses,percentage of missed pulses and radars’ PRI modulations.Then,the efficiency of the proposed method in each scenario is compared with those of two traditional methods,Fast Fourier Trans-form(FFT)and SDIF.In all scenarios,real radar PRIs are simulated and interleaved based on real and operational conditions.We have tried to consider modern EW conditions for marine,aerial and ground ESM and ELINT systems.
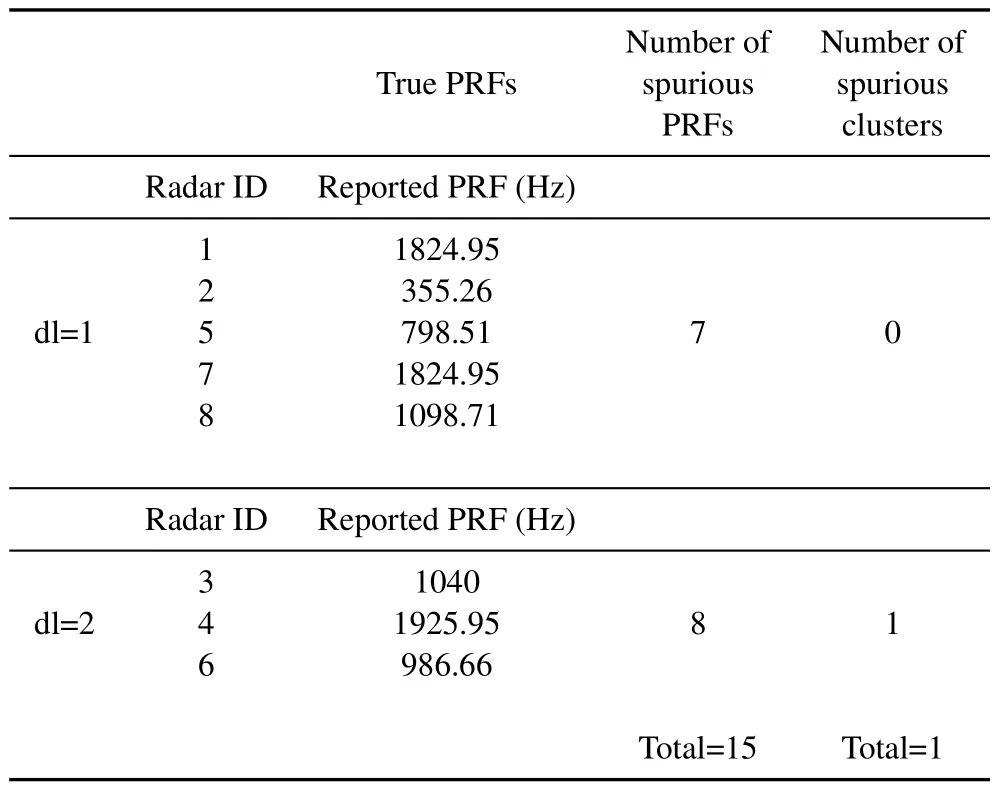
Table 3.True and spurious PRFs and clusters reported by MDBSCAN(Scenario 1).
4.1 Scenario 1
As the first scenario,let us consider an almost simple case,in which 5 out of 8 assumed radars have simple PRIs,and the reminders have jittered PRIs with at most 5% variation around central one.The complete specifications of this scenario can be seen in Table 1.It must be noted that in the present EW environments,the number of active radars is much more than 8 radars(usually several tens to several hundred radars are present in practice),but due to shortness of the assumed logging times (70−400ms),the probability of presence of more interleaved radar pulses is poor.Such a logging time accelerates the deinterleaving process which is useful in online applications.In this condition,almost no valid PRF can be detected from FFT,because there is no dominant peak in PRI frequency domain and this method is not able to discover exact PRFs.Of course,if we focus on its output,just a multiple of a valid PRF can be found(2PRF6=2026Hz)and the other peaks including first and second local maximums are irrelevant with any of assumed PRFs.Therefore,FFT does not work properly in this simple scenario.
SDIF works much better than FFT,so that it discovers all the valid PRIs as shown in Table 2.It should be noted that these results are based on this fact that all the required parameters such as bin width and threshold curve were adjusted for this scenario.Another important issue is the number of spurious PRIs reported by the algorithm (i.e.those PRIs that exceeds the threshold curve in ToA difference histogram).The less the number of spurious PRIs,the better the algorithm operates,since for each PRI,a sequence search routine must perform which merely leads to waste in time for spurious PRIs.Furthermore,searching the sequence with spurious PRIs may result in spurious radar targets with considerable number of pulses.For instance,in this scenario,the total number of spurious PRIs reported by SDIF is 42 and the number of spurious final clusters is 7 for first,second and third levels of differences.
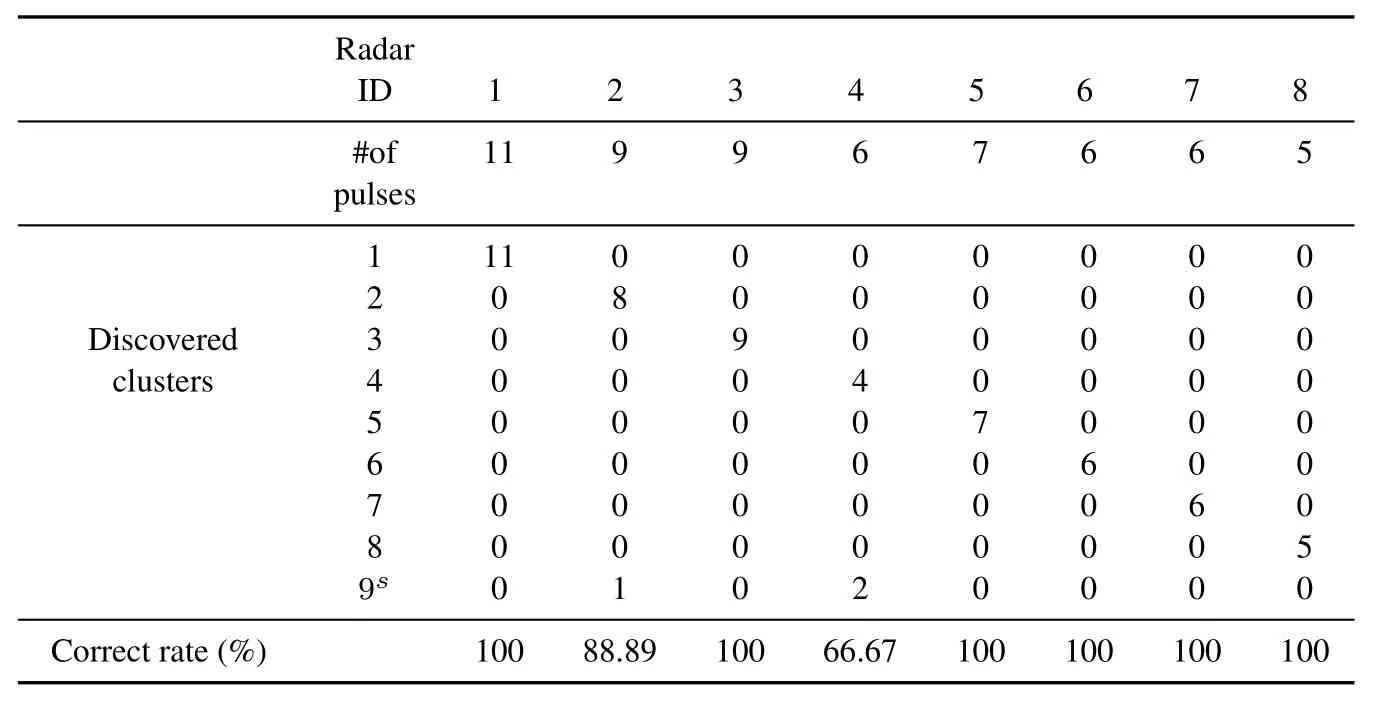
Table 4.Confusion matrix of final clusters obtained by MDBSCAN(Scenario 1).The superscript‘s’shows that the cluster is a spurious one.
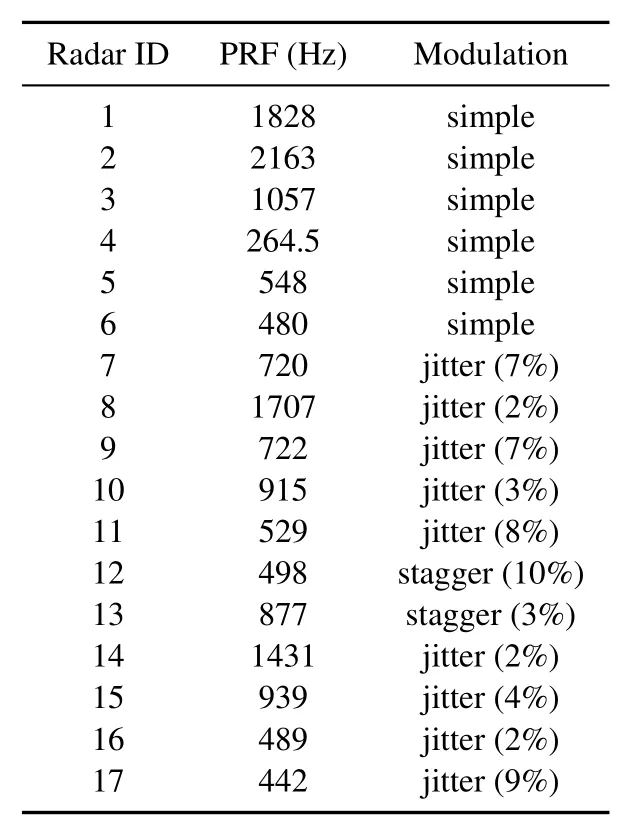
Table 5.The complete specifications of scenario 2.
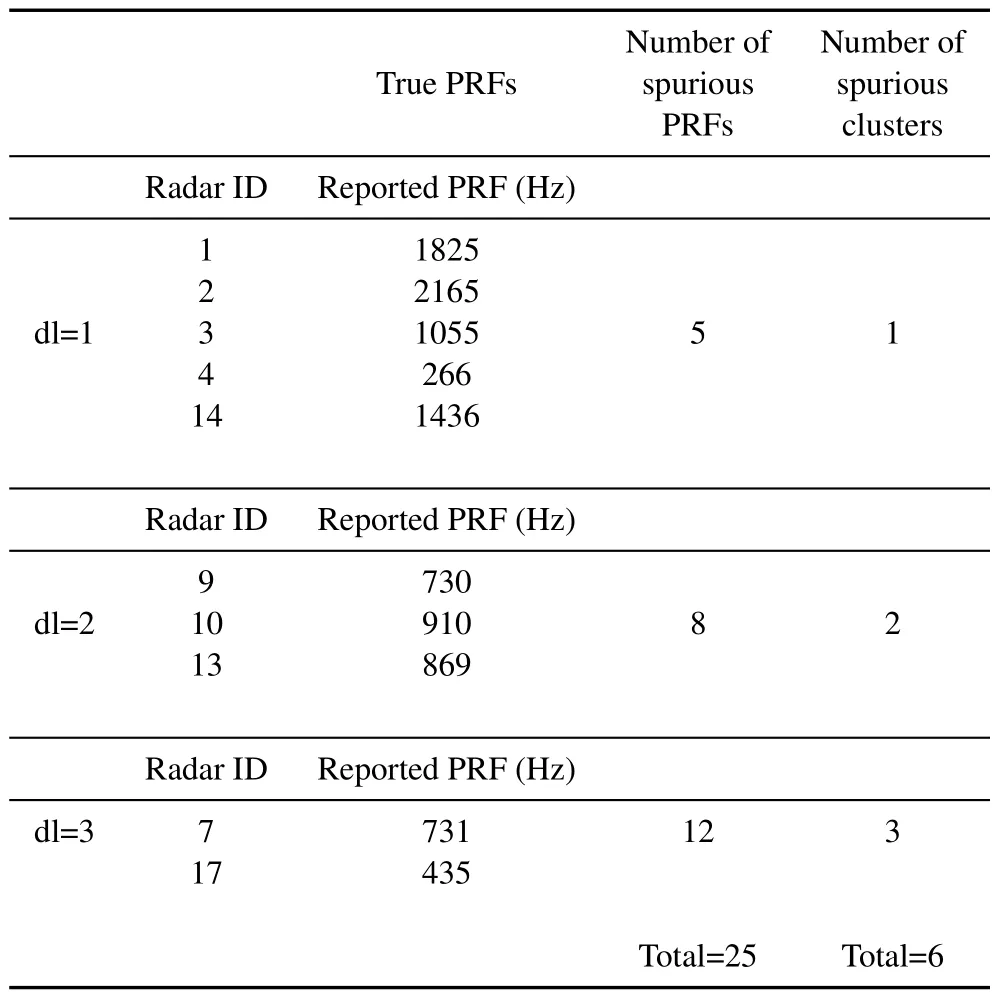
Table 6.True and spurious PRFs and clusters reported by SDIF in optimum case(Scenario 2).
The proposed MDBSCAN method leads to the best results.It discovers all the valid PRIs accurately,establishes reliable clusters with high correct rate (with the average of about 94.5%) and performs all operations fast and efficiently in comparison with SDIF with the same level of difference.In addition,the number of spurious PRI is about one third of that of SDIF(15)and just one spurious target is finally reported.Table 3 encloses the results.As it can be seen from the table,the other achieved improvement is that all the eight radars are discovered in the first and second difference levels,which makes the algorithm faster than the SDIF.Moreover,the reliability of final clusters as a criterion of the accuracy of the proposed method can be verified by confusion matrix depicted in Table 4.In this table,the superscript“s”indicates that the target is a spurious one.Note that the spurious target consists of 5 pulses,2 of which are really outlier.As it can be seen,just 3 pulses of true clusters are assigned to the spurious one and no pulse of a true cluster is erroneously assigned to the other i.e.all discovered targets have true parameters.
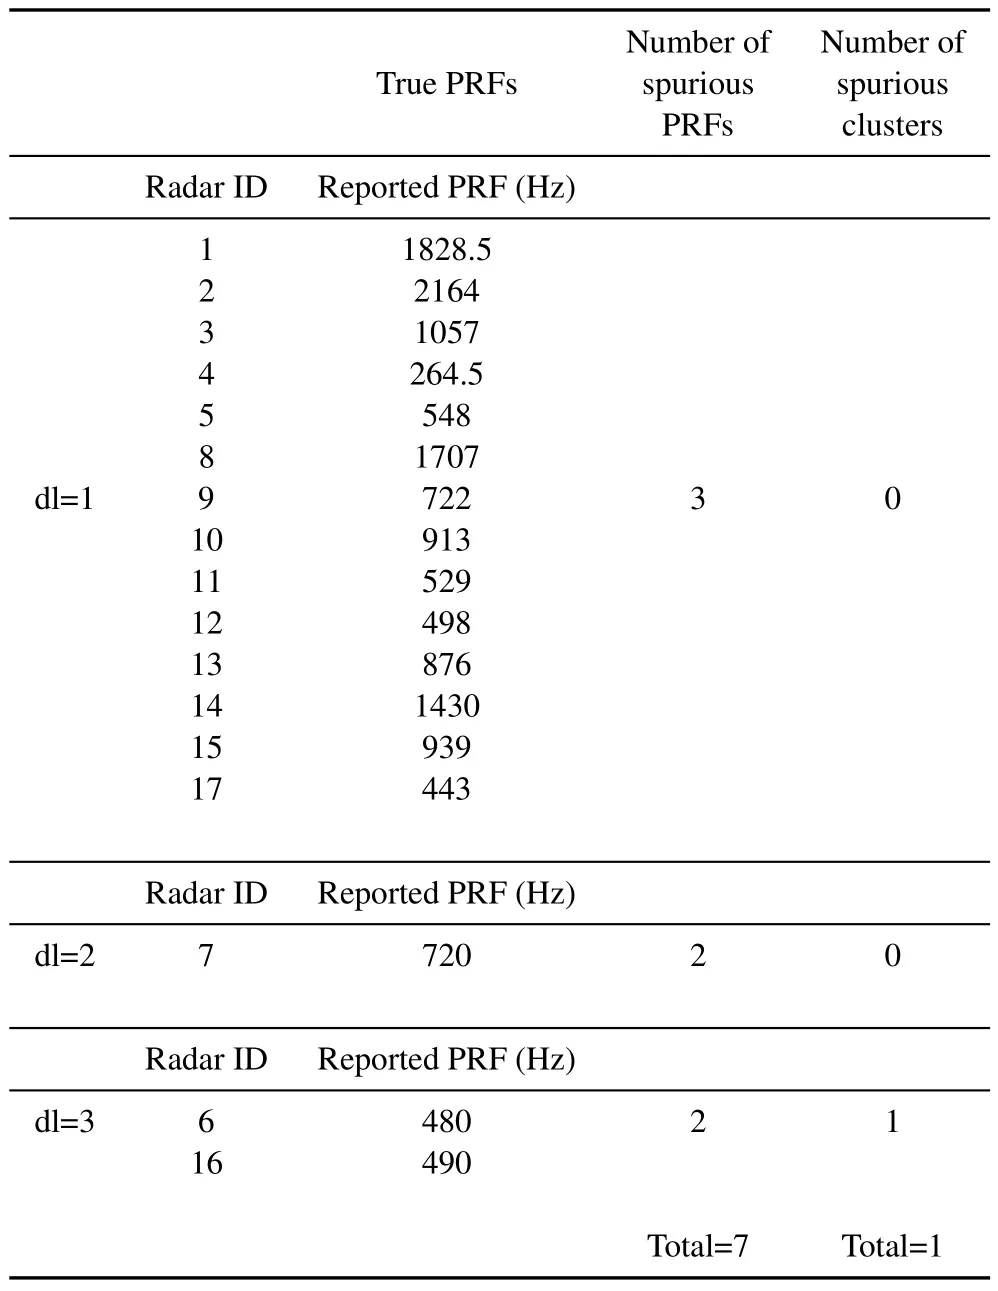
Table 7.True and spurious PRFs and clusters reported by MDBSCAN(Scenario 2).
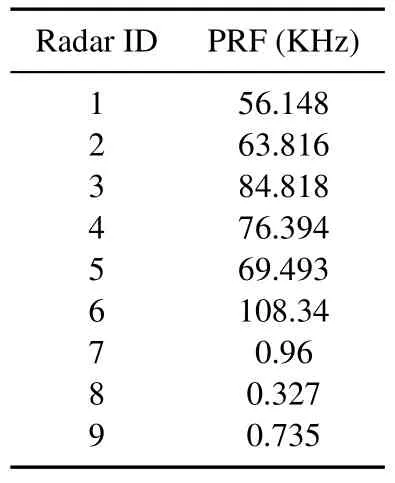
Table 9.The complete specifications of scenario 3.
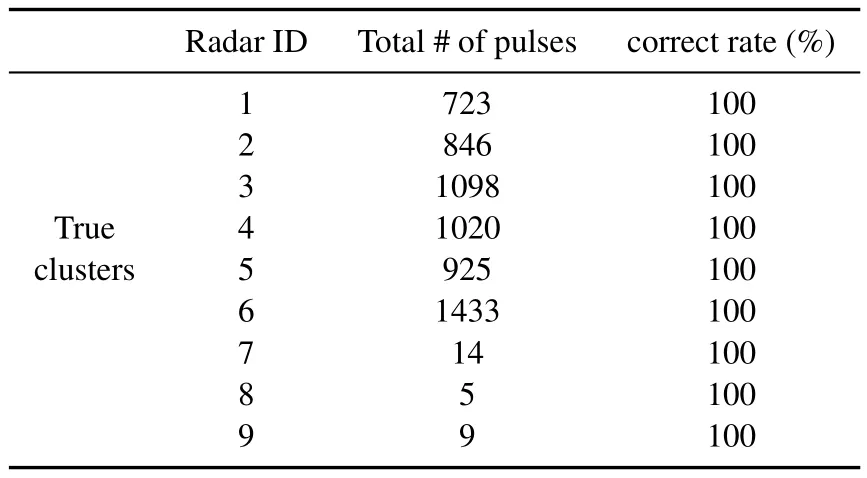
Table 10.Correct rate of final clusters obtained by MDBSCAN(Scenario 3).
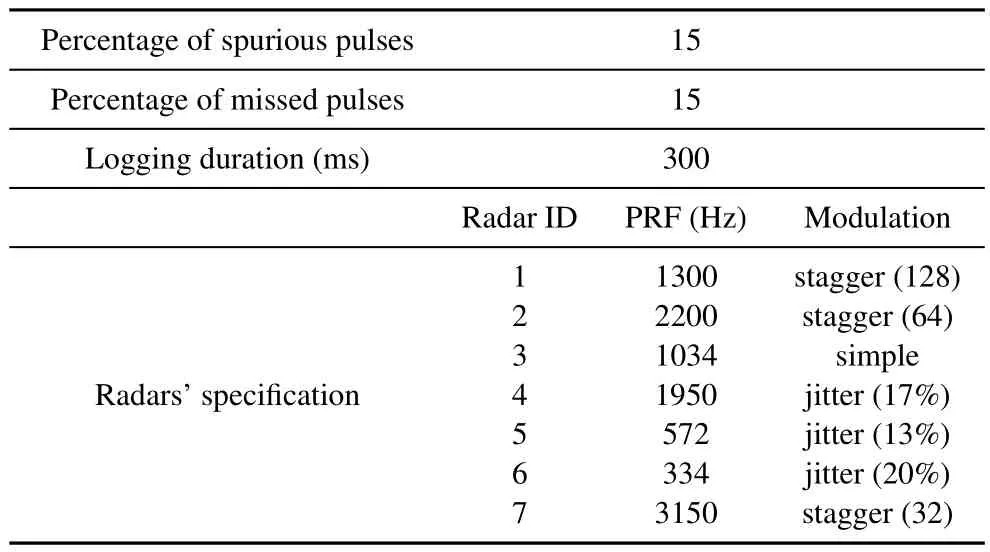
Table 11.The complete specifications of scenario 4.
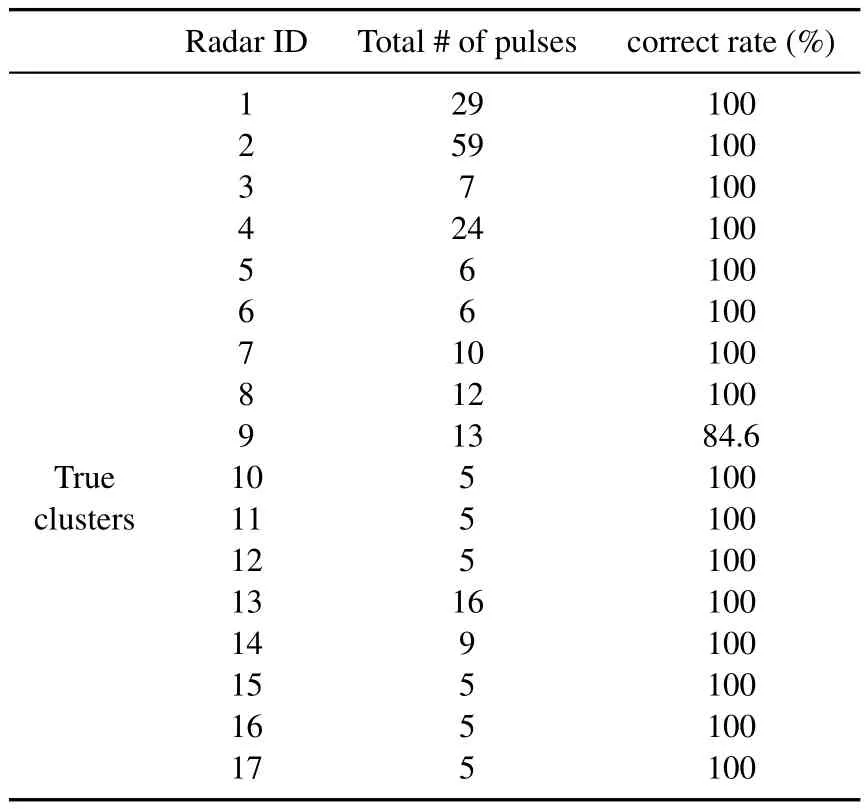
Table 8.Correct rate of final clusters obtained by MDBSCAN(Scenario 2).
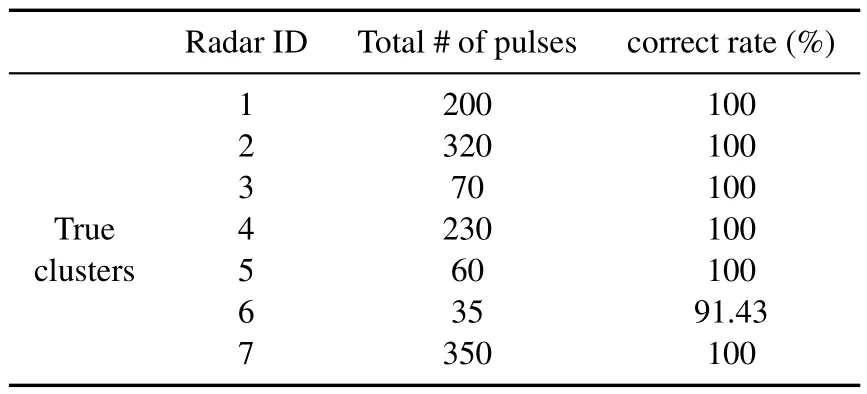
Table 12.Correct rate of final clusters obtained by MDBSCAN(Scenario 4).
4.2 Scenario 2
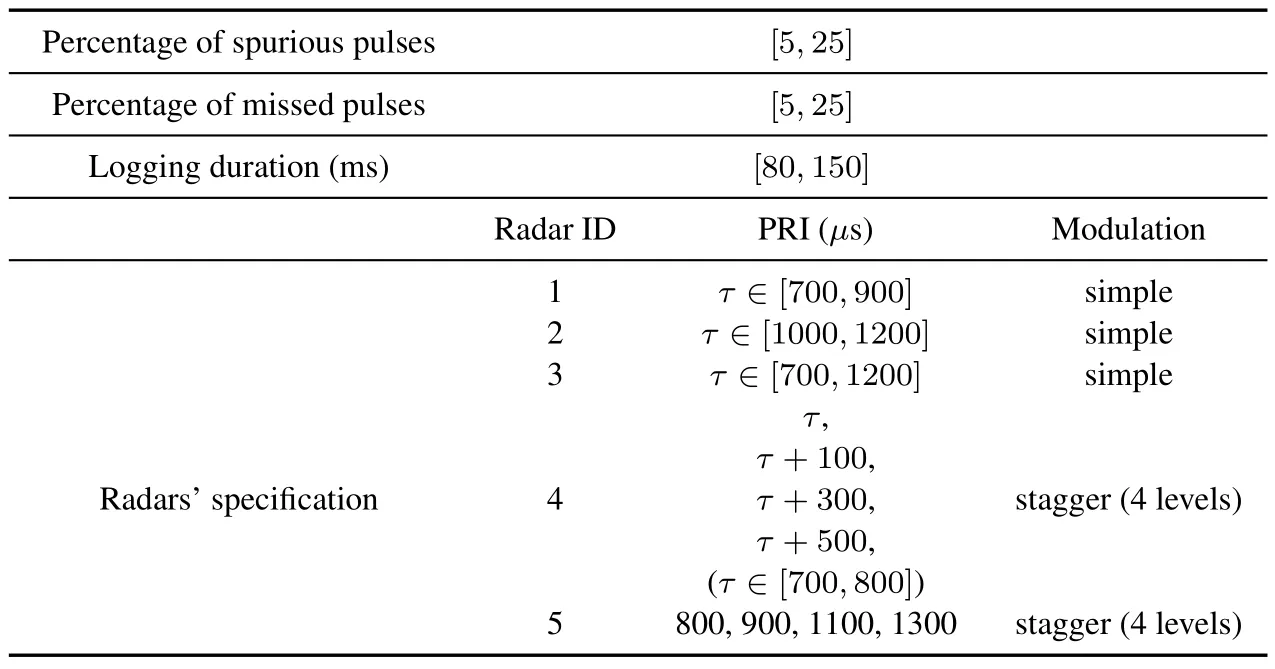
Table 13.The complete specifications of simulated scenario in[4].
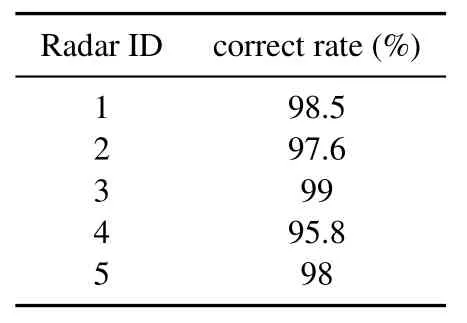
Table 14.The average correct rate of final clusters obtained by MDBSCAN corresponding to the scenario described in Table 13.
In previous scenario,an ordinary condition was simulated.But,a real EW environment is not always so simple.In the second scenario,a more complex environment is simulated in which the total logging time is 400msand the number of emitters is 17 (9 jitter+2 stagger+6 simple).Moreover,the percentages of spurious and missed pulses are 15 and 20 respectively(see Table 5).In this table,for all modulations,except the simple one,the percentage of PRI variations from its mean value is written in parentheses next to the modulation type.
As expected,FFT led to very weak results,the details of which are not reported here.The performance of the SDIF algorithm highly depends on its relevant parameters,so that for many combinations of histogram bin width and the threshold curve,few valid PRIs are discovered or many spurious ones are reported.The results of the best case among so many ones are shown in Table 6.It can be seen that using the best parameters,at most 10 radars can be discovered whereas 6 spurious ones are reported.Finally,using the MDBSCAN algorithm,all the emitters are discovered and only one spurious cluster is reported which is the result of 4 spurious PRI in different levels of differences (Table 7).The performance of this method has been analysed in Table 8.
4.3 Scenario 3
In the above scenarios,various combinations of moderate PRF radars were considered,and the efficiency of the proposed method was observed.In this scenario,however,several high PRF (55KHz −110KHz)radars are considered to be combined with some moderate PRF ones (300 Hz - 1 KHz) in order to assess the ability of the proposed algorithm in a more complicated and realistic situation.The complete specifications of scenario are depicted in Table 9 in which 6 high PRF radars are interleaved with 3 moderate PRF ones in a 70 ms logging time.As it can be seen from Table 10,all targets are successfully detected and no erroneous assignment is occurred using the proposed method.Moreover,no spurious target is reported though some PRFs are high and some are moderate.
4.4 Scenario 4
As another scenario,let us consider some radars with complex PRI patterns.In the previous scenarios,we considered at most 16 levels of PRI for stagger modulation and expressed its deviation from the central PRIby means of the percentage of jitter to be more consistent with the notation of the proposed algorithm.In this scenario,however,stagger radars with more than 16 i.e.up to 128 levels are considered and the performance of the method is evaluated.Furthermore,jitter PRI radars with highjit(more than 20%) are simulated.See Table 11 for complete specifications of this scenario.
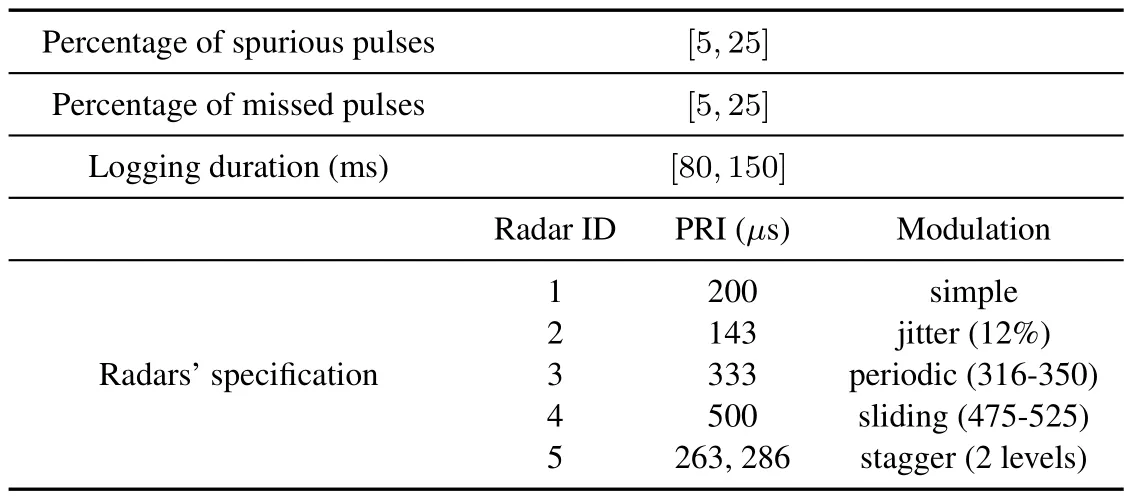
Table 15.The complete specifications of simulated scenario in[17].
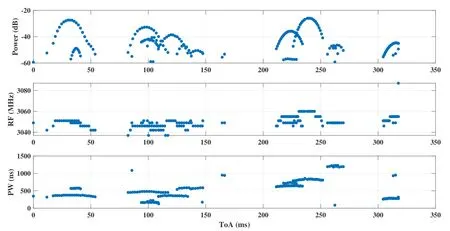
Figure 11.Interleaved pulses of 14 marine navigation radars in S band.Received power,RF and PW of each radar is plotted versus ToA.As it can be seen some spurious and missing pulses are included naturally in real radar data.
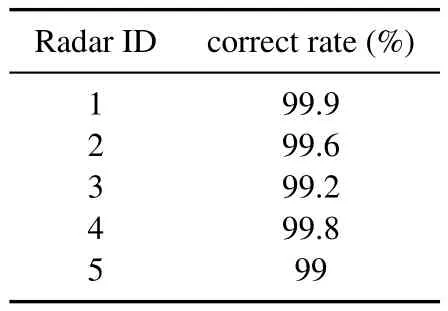
Table 16.The average correct rate of final clusters obtained by MDBSCAN corresponding to the scenario described in Table 15.
As it was expected,the method works well in this scenario too.This is due to this fact that we modeled deviation from a central PRI with the parameterjitirrespective of the number of PRI levels in periodic patterns(like stagger).Furthermore,this parameter is changed step by step from small value(near zero)up to 0.3(corresponding with 30%tolerable jitter),so jitter PRI radars with high jit are also detectable in a set of interleaved pulses.Table 12 illustrates the performance of the proposed algorithm in this scenario.
4.5 Scenario 5
As the last scenario,we consider the situations simulated in recent state-of-the-art papers.In[4],by using Recurrent Neural Networks (RNNs),a classification,denoising and deinterleaving method was proposed.In this work,five classes of radars which differ in PW and PRI were simulated.Although our method is completely different from that of the method reported in this paper,we use the same simulation scenario for further evaluation of the proposed method.Table 13 contains details of this scenario in which only PRI information is kept and PW values and patterns are omitted.1000 Monte Carlo simulations were performed for differentτ(see Table 13 or TABLE I in[4]),logging times,number of pulses and percentages of missing and spurious pulses.Table 14 illustrates the average performance of the proposed algorithm in this scenario.As it can be seen,the method performs well in this scenario too.It has to be noted that the only used feature in the proposed method is PRI.
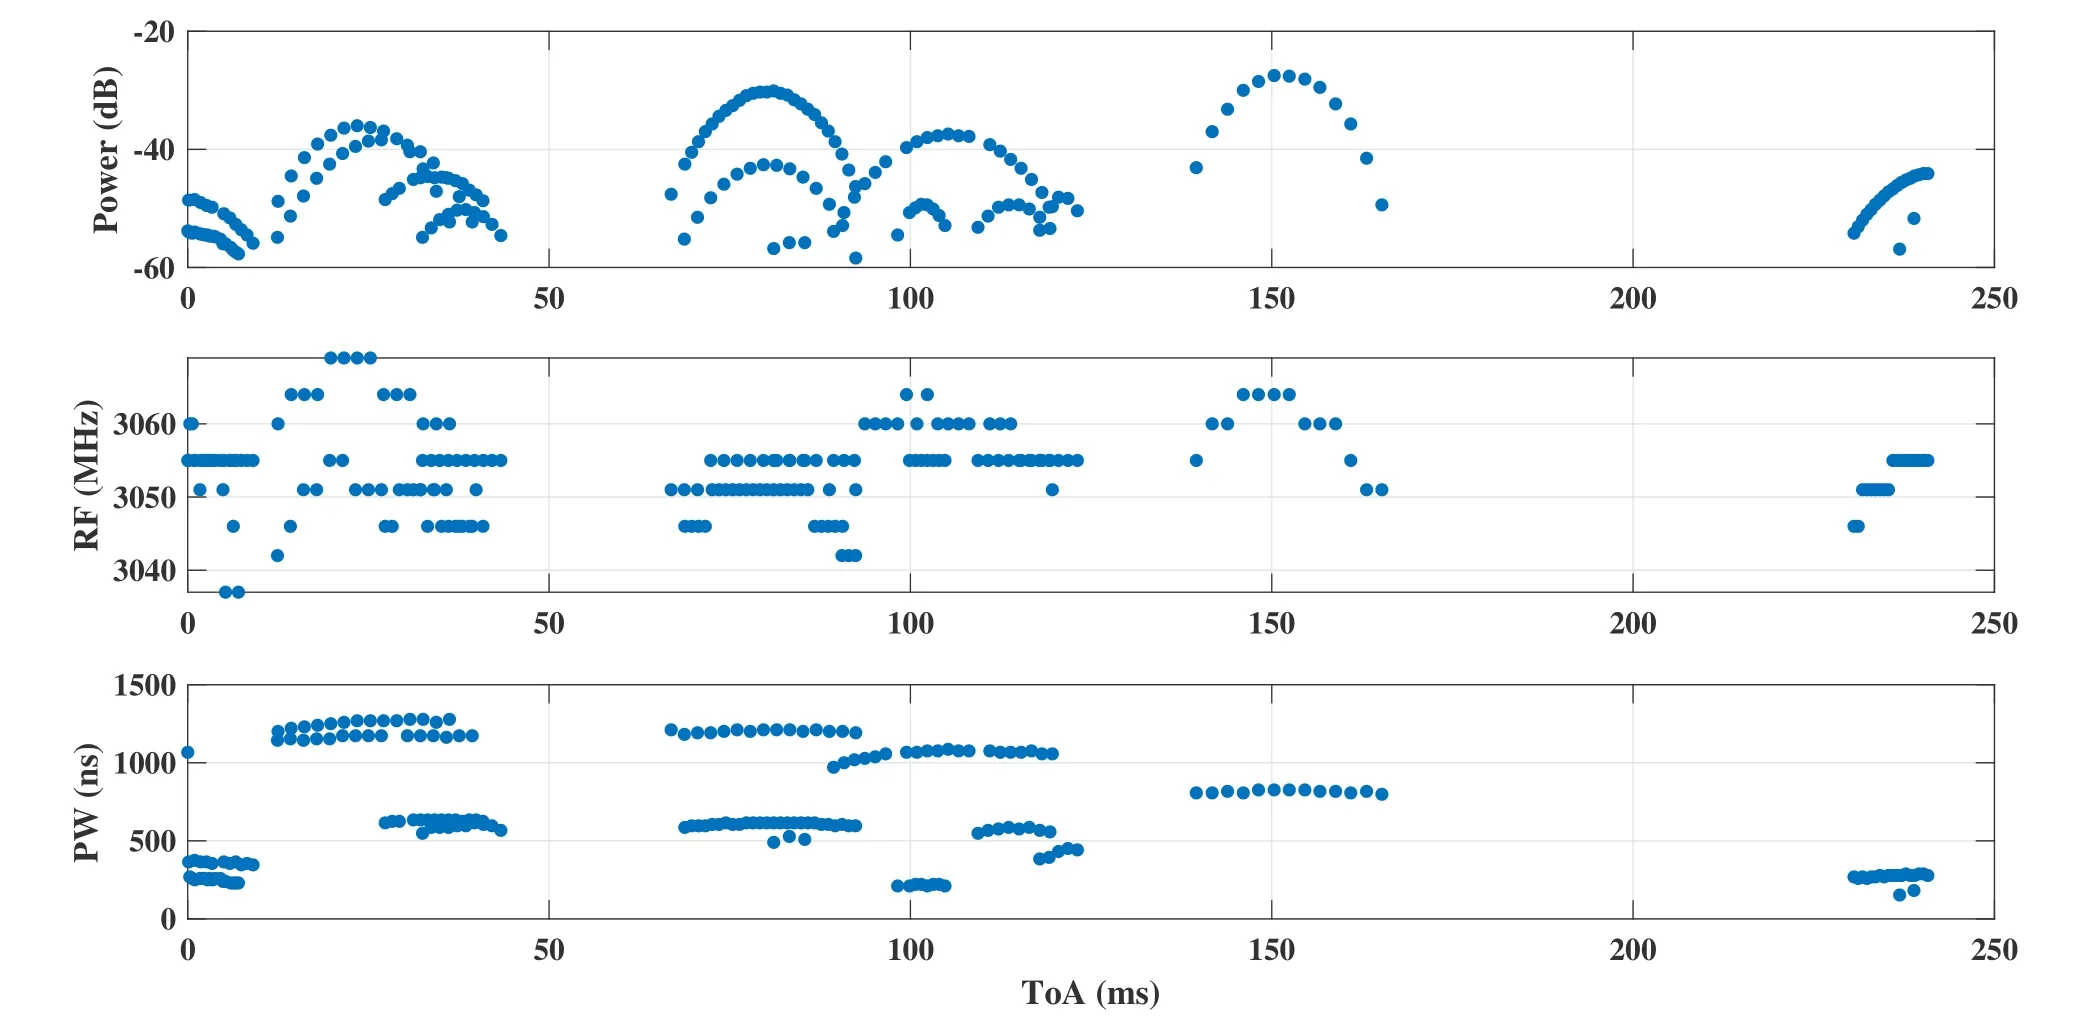
Figure 12.Interleaved pulses of 13 marine navigation radars in S band.Received power,RF and PW of each radar is plotted versus ToA.As it can be seen some spurious and missing pulses are included naturally in real radar data.
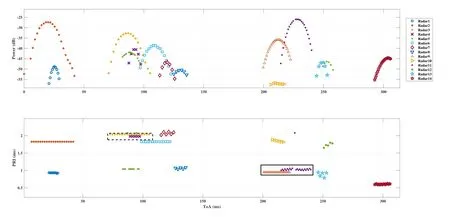
Figure 13.Deinterleaving results of propose algorithm on real radar data depicted in Figure 11 and the extracted PRIs corresponding to each radar.
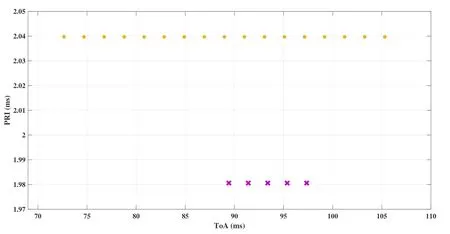
Figure 14.The magnified area of dashed line rectangle in Figure 13.
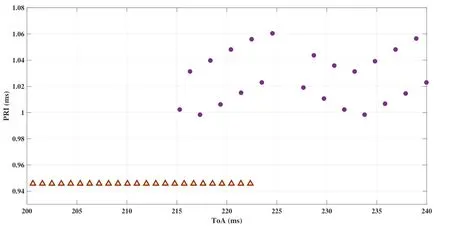
Figure 15.The magnified area of solid line rectangle in Figure 13.
In[17],another deinterleaving method was reported which outperforms traditional histogram based algorithms.In that paper,5 different PRI types and values were simulated according to Table 15.Although the method works better than other well-known histogram based algorithms in most conditions,it must be noted that the adopted analysis window is too long(0.5 s) which is not suitable for online applications.Moreover,a large number of pulses is considered for each radar in the analysis window which rarely occurs in real world because of radar antenna scan,it’s side lobes and back lobes and other destructive effects that avoid receiving pulses in Elint and ESM receivers(see Section V).So,assuming a more realistic condition for the number of pulses and a shorter analysis window,we generated the data and applied our algorithm.The average correct rate for each radar detection over 1000 simulations is shown in Table 16.These results confirm the superiority of our proposed method.Moreover,as mentioned in [17],the traditional histogram based algorithms re-calculate the histogram when a candidate PRI is achieved,so the computational complexity is of the order ofO(kn2)wherekis difference level andnis the number of pulses.However,similar to the method reported in[17],the complexity of our proposed method isO(kn),because the re-calculation of histogram is not needed.It has to be noted thatkin our all scenarios is at most 3 (including the experiments which are reported in the next section) which makes it to respond faster in comparison to histogram based methods and also the method proposed in[17].
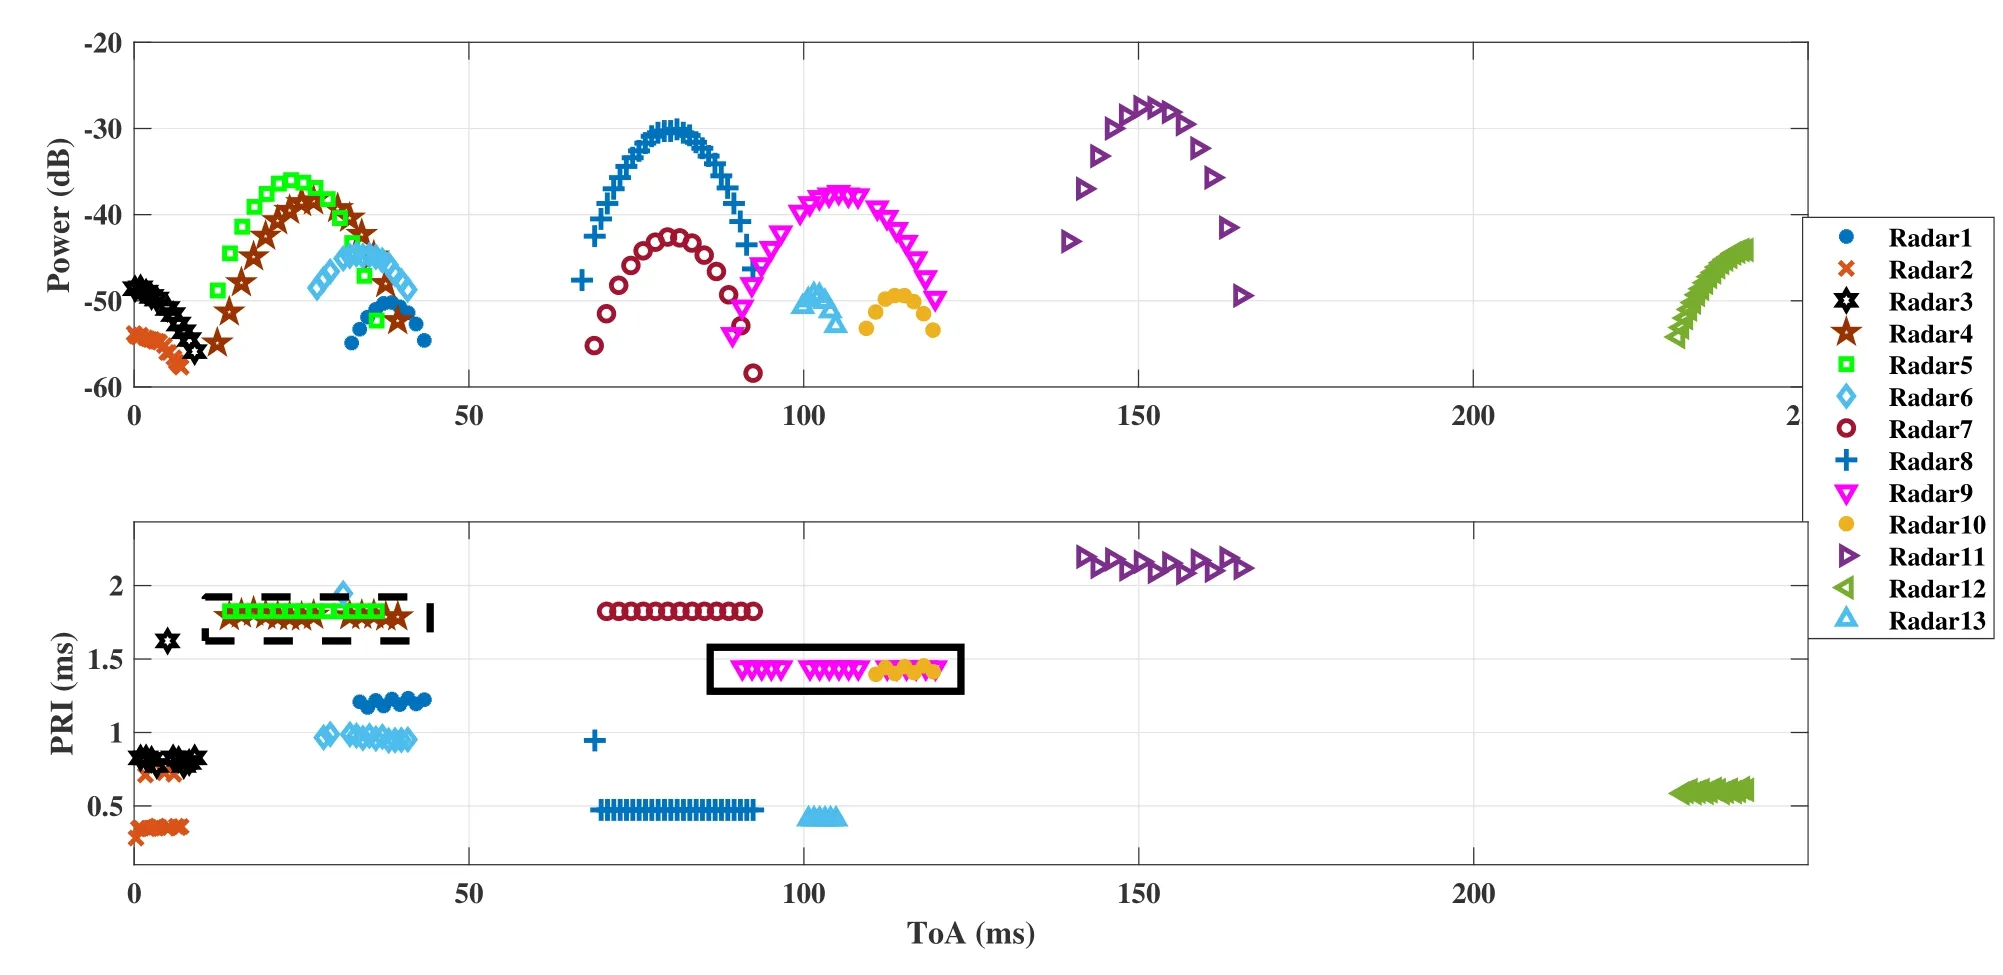
Figure 16.Deinterleaving results of propose algorithm on real radar data depicted in Figure 12 and the extracted PRIs corresponding to each radar.
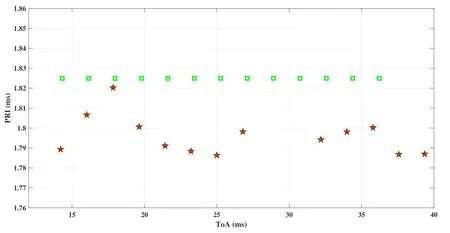
Figure 17.The magnified area of dashed line rectangle in Figure 16.
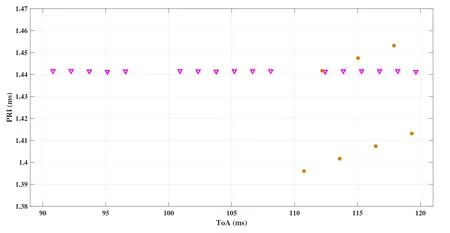
Figure 18.The magnified area of solid line rectangle in Figure 16.
V.EXPERIMENTAL RESULTS USING REAL WORLD DATA
After evaluating the performance of the proposed method using computer simulations,it is necessary to test the method with real world data gathering from dense environments.Figure 11 and 12 illustrate two windows of real radars’PDWs.In each figure,pulses from more than 10 navigation marine radars are interleaved in a short period of time.As it can be seen from the figures,frequency information is almost useless in these scenarios,because all the frequencies are lied in a limited frequency band(3040−3070MHz)and the frequency fluctuations of a single radar target is comparable with this narrow band.PW information is much better,but its value is also similar for most interleaved radars.No other information is available.The proposed method is helpful in both scenarios,because it finds the most discriminant feature (PRI)properly.The results of our deinterleaving algorithm for the scenario depicted in Figure 11 are illustrated in Figures Figure 13-15.Also,Figures 16-18 show the output for the scenario depicted in Figure 12.In these figures,the pulses of each specific radar are illustrated with a certain color and shape.As it can be seen,the method deinterleave each radar pulses from those of the other ones successfully despite high percentages of jitter PRIs,incomplete stagger PRIs,very close valued PRIs (see Figures 14,15,17 and 18) and the presence of missing and spurious pulses.Since,the number of pulses is small compared to the number of radar targets in both scenarios,SDIF and other histogram based methods are almost useless.
VI.FUTURE WORK
We presented a method to deinterleave radar pulses using only ToA information.Although the method does the job well and quickly,it is necessary to merge different modes of a multi-function radar after deinterleaving.The merging method and how to implement it,can be an interesting topic to continue this paper.On the other hand,as we mentioned previously,the features which are extracted from IF signals are so useful in clustering process.However,the implementation of the extraction methods on today’s hardware frameworks needs more studies and investigations.
VII.CONCLUSION
We proposed a fast and efficient method to deinterleave radar pulse sequences in modern realistic EW environments using only ToA information.The proposed method namely MDBSCAN algorithm,is a modification of the traditional DBSCAN method.It was shown that the modified method is very efficient for determining valid PRIs in a set of interleaved radar pulses,even with high jitter values.Moreover,a sequence search subroutine was added to the algorithm in order to find other pulses associated to the discovered PRIs.If the total number of the pulses related to a PRI exceeds a predetermined threshold,those pulses were known as a true target.These pulses are then removed and the search algorithm is repeated.How to select which PRI to start with for searching the sequence,is another important issue which must be considered,hence another subroutine was introduced which is able to select the most reliable PRI.It was shown that the algorithm performs very well in different scenarios generated by computer simulations.Moreover,the method works successfully for deinterleaving of the radar pulses of commercial ships.In addition to good accuracy,the method has lower computational complexity compare to histogram based methods.
VIII.ACKNOWLEDGEMENT
The authors would like to thank the Radar and Sonar Research Laboratory in Yazd University for providing the real world data.
杂志排行
China Communications的其它文章
- Quality-Aware Massive Content Delivery in Digital Twin-Enabled Edge Networks
- Edge-Coordinated Energy-Efficient Video Analytics for Digital Twin in 6G
- Unpredictability of Digital Twin for Connected Vehicles
- Endogenous Security-Aware Resource Management for Digital Twin and 6G Edge Intelligence Integrated Smart Park
- Digital Twin-Assisted Knowledge Distillation Framework for Heterogeneous Federated Learning
- Design and Implementation of Secure and Reliable Information Interaction Architecture for Digital Twins
