Reasoning Disaster Chains with Bayesian Network Estimated Under Expert Prior Knowledge
2023-02-26LidaHuangTaoChenQingDengYuliZhou
Lida Huang · Tao Chen · Qing Deng · Yuli Zhou
Abstract With the acceleration of global climate change and urbanization, disaster chains are always connected to artif icial systems like critical infrastructure.The complexity and uncertainty of the disaster chain development process and the severity of the consequences have brought great challenges to emergency decision makers.The Bayesian network (BN) was applied in this study to reason about disaster chain scenarios to support the choice of appropriate response strategies.To capture the interacting relationships among dif ferent factors, a scenario representation model of disaster chains was developed, followed by the determination of the BN structure.In deriving the conditional probability tables of the BN model, we found that, due to the lack of data and the signif icant uncertainty of disaster chains, parameter learning methodologies based on data or expert knowledge alone are insuf ficient.By integrating both sample data and expert knowledge with the maximum entropy principle, we proposed a parameter estimation algorithm under expert prior knowledge (PEUK).Taking the rainstorm disaster chain as an example, we demonstrated the superiority of the PEUK-built BN model over the traditional maximum a posterior (MAP) algorithm and the direct expert opinion elicitation method.The results also demonstrate the potential of our BN scenario reasoning paradigm to assist real-world disaster decisions.
Keywords Bayesian network · Expert prior knowledge · Parameter learning · Rainstorm disaster chain · Scenario reasoning
1 Introduction
A disaster chain refers to the phenomenon that a series of secondary disasters are caused by a certain primary disaster, forming a complex process of disaster transmission and amplif ication (Shi 1996).As an illustration, the Wenchuan Earthquake brought about several severe disasters such as secondary collapse, landslides, and debris f lows, while Typhoon Lekima caused rainstorms and f loods, residential structure damage, power failure, and so on.Disaster chains show uncertainty, ambiguity, and randomness.In addition,emergency decision makers may get increasingly perplexed and fail to make the best decisions due to the complexity of various disasters and the heterogeneity of information from several sources.The scenario-based decision-making methodology has been widely used to address this issue, improve the readiness for disaster chains, and take proactive actions(Moehrle and Raskob 2015).Scenario reasoning helps to analyze the disaster developing process and review existing emergency response capabilities.A scenario-response paradigm can be an improvement over the conventional prediction-response paradigm, ef fectively increase disaster awareness, and enhance the ability to make emergency decisions (Zhang and Liu 2012).
Disaster scenario reasoning can answer inquiries such as “What is the situation now?” and “What if the situation persists?” (Alexander 2013).There are three types of scenario reasoning methods for emergency management: case-based, simulation-based, and network-based(Liu et al.2018).Network-based methods are particularly widely used in disaster chains (Sakahira and Hiroi 2021).These methods model the relationship between disasterrelated elements in a networked manner, where elements like disaster events and response measures are nodes and correlations and causal relations are links.The Bayesian network (BN) is one of the probabilistic graphical models that def ine the interaction between nodes (a group of variables) as a directed edge of a conditional probability distribution.The use of BN in conjunction with the scenario analysis method to establish scenario reasoning based on probability calculation has become a research hotspot in the f ield of emergency management in recent years.To predict and examine the chain reaction path and possible losses of rainstorm situations, Qiu et al.( 2014)suggested a BN-based modeling method.A quantitative multi-risk management model using BNs was put forth by Liu et al.( 2014) to assess the cascading hazard of the tsunami triggered by a rockslide.Comes et al.( 2015) introduced group decision theory and multi-attribute decision theory into the construction of a Bayesian network to get the opinions of domain experts on the development trend of uncertain disasters.Han et al.( 2019) combined the BN and the ArcGIS software to create a hazard chain assessment model for the Changbai Mountains in China.When fresh evidence (beliefs, monitoring data), which may be updated by users using BNs, appears in a particular node,they can update not just the f inal outcomes but also all the information in the network (Hosseini and Ivanov 2020).By capturing the model’s uncertainty in this manner, the BN of fers a nearly real-time scenario reasoning process.
In emergency decision-making research, the structure of BN is usually determined relying on expert knowledge since the algorithm might not be able to accurately identify and simulate hazards and their interactions (Chen and Pollino 2012).It is known that the graphical structure’s complexity and dependability are essential components to its success.However, the more complex the structure of a BN is, the more dif ficult it is to learn the parameters (the conditional probability tables, CPTs).On the one hand, for emergencies, datasets are often sparse, which lowers the precision of parameter estimates.On the other hand, it is challenging for the experts to deliver precise quantitative CPTs.A workable solution to this problem is to combine parameter learning with additional knowledge provided by experts (Zhou et al.2016; Hou et al.2020).Various methods have been created to include more qualitative constraints by domain expert knowledge.Convex optimization (de Campos and Ji 2008) introduces constrained parameter spaces or penalty functions.In the limited parameter space of the maximum a posterior (MAP) algorithm, aualitative maximum a posterior(QMAP) creates a Dirichlet priori from a Monte Carlo random sample (Chang and Wang 2010).The QMAP methods exhibit good estimation outcomes, assuming that it is possible to obtain all convex parameter constraints.However,practically speaking, this assumption is nearly impossible.It is frequently dif ficult to properly prepare for these comprehensive constraint sets because of the complexity of BNs in relation to emergencies and the limitations of domain knowledge cognition.
In this study, to leverage expert-based information, we provided an algorithm for parameter learning—parameter estimation under expert prior knowledge (PEUK).The prior knowledge of CPTs is obtained from direct elicitation by asking experts to give conf idence intervals using a probability scale.Then the maximum entropy principle is applied to balance expert knowledge and parameter learning.When the data learning outcomes perform better in the test set,PEUK tends toward the traditional MAP method; otherwise,it tends toward expert prior knowledge.Building on this proposed algorithm, we formalized our disaster chain scenario reasoning solution with a Bayesian network.A scenario representation model of disaster chains—the hazard, emergency, hazard-af fected object, emergency response measure,consequence (HEOMC) framework—was developed, and the rainstorm chain was taken as an example to show the construction process of the model.With the scenario representation model, the conf iguration, training, and application of a Bayesian network for scenario analysis and decision support are described.Our work of fers two contributions:(1) Using a f lexible and extensible BN model, a scenario representation model is created that improves our ability to simulate a disaster chain and provides a more practical level of preparedness; (2) By combining expert previous knowledge and case data, the PEUK algorithm innovates the BN parameter learning process.
The rest of this article is divided into the following sections.Section 2 proposes the disaster chain scenario representation model.Section 3 describes how to generate a BN for scenario reasoning and illustrates the benef its of the PEUK parameter learning algorithm.Section 4 discusses the impact of our method on the practice of the scenarioresponse based disaster response strategy.Section 5 concludes the article by considering potential paths for additional research.
2 Representation Model for Disaster Chain Scenario
Scenario is initially a depiction of a future condition and a tendency for an event to change from its current state to a future one.Recently, customizing scenario’s def inition and representation has gained more attention in emergency management.Comes et al.( 2011, 2015) def ined scenario as a specif ic emergency circumstance, as well as its growth and ef fects.Wu et al.( 2013) def ined scenario as an ordered collection of distinct instances that includes a description of the environment, context, actors, and actions.
The purpose of emergency management is to help decision makers protect items from catastrophe damage (Fan et al.2013).The ef fective collection of information about the af fected objects and the disaster chain damages is the only way to make sound decisions.As a result, creating a representation model for each damaged object of the disaster chain is a critical ef fort in creating scenarios.
2.1 The Hazard, Emergency, Hazard-Af efcted Object, Emergency Response Measure,Consequence (HEOMC) Representation Model
Considering a hazard af fecting an object as a basic event, a disaster chain scenario in this study has f ive elements: initial hazard (denoted byH), emergency event (denoted byE),hazard-af fected object (denoted byO), emergency response measure (denoted byM), and consequence (denoted byC).We formalized our disaster chain scenario construction method as the HEOMC framework, as seen in Fig. 1.Figure 1 a shows the relationship between these f ive elements,and their detailed def initions are as follows:
(1)Initial hazard(H) A source of initial danger in the natural or human-made environment that can adversely af fect human life, property, or various activities.In this study, rainstorm is taken as the initial hazard.
(2)Emergency(E) An event that occurs when a hazardaf fected object is acted upon by a hazard, such as a geologic hazard, waterlogging, landslide, and so on.
(3)Hazard-af fected object(O) Spatial entities that are directly inf luenced by hazards, such as construction sites, water conservancy facilities, urban transportation infrastructure, people, and so on.
(4)Emergency response measure(M) Measures that are taken to control hazards and eliminate their inf luence on objects, which can be divided into two types—precautions and rescue measures.
(5)Consequence(C) Injuries and deaths, and property losses caused by hazards.
The disaster chain can be identif ied either through the causal relationship between successive occurrences of disaster events (Yu et al.2020; Yu et al.2023) or based on the spatial correlation of disasters (Balbi et al.2016;Zhong et al.2017).In our study, a disaster chain scenario can be represented as a combination of these f ive elements:Si={H0,Oi,Ei,Mi,Oij,Eij,Mij,Oijk,Eijk,…,C}.We disentangle the complex spatial and temporal relationships among disaster chains through hazard-af fected objects, where hazards or emergencies act on dif ferent hazard-af fected objects,leading to new emergencies or dif ferent disaster consequences.For instance, when a rainstorm acts on geological hazard zones, a new emergency caused by mudslide may occur and acts on roads, causing road damage, which can be regarded as a disaster chain; a rainstorm directly acts on the road and causes ponding and circuit breaking, which can be regarded as another disaster chain.Figure 1 b shows a representation of disaster chains.
2.2 Rainstorm Chain Scenario Diagram
Based on the HEOMC framework, we took rainstorm as the initial hazard, analyzed its inf luence on various objects,and identif ied disaster chains to construct a scenario for the rainstorm.Six hazard-af fected objects are considered,including construction sites, urban transportation infrastructure, old bungalows and low-lying yards, water conservation facilities, geological hazard zones, and mining areas.Correspondingly, possible induced emergencies include waterlogging, houses f looded and collapsed, f loods, mudslides,dam breaks, and so on.
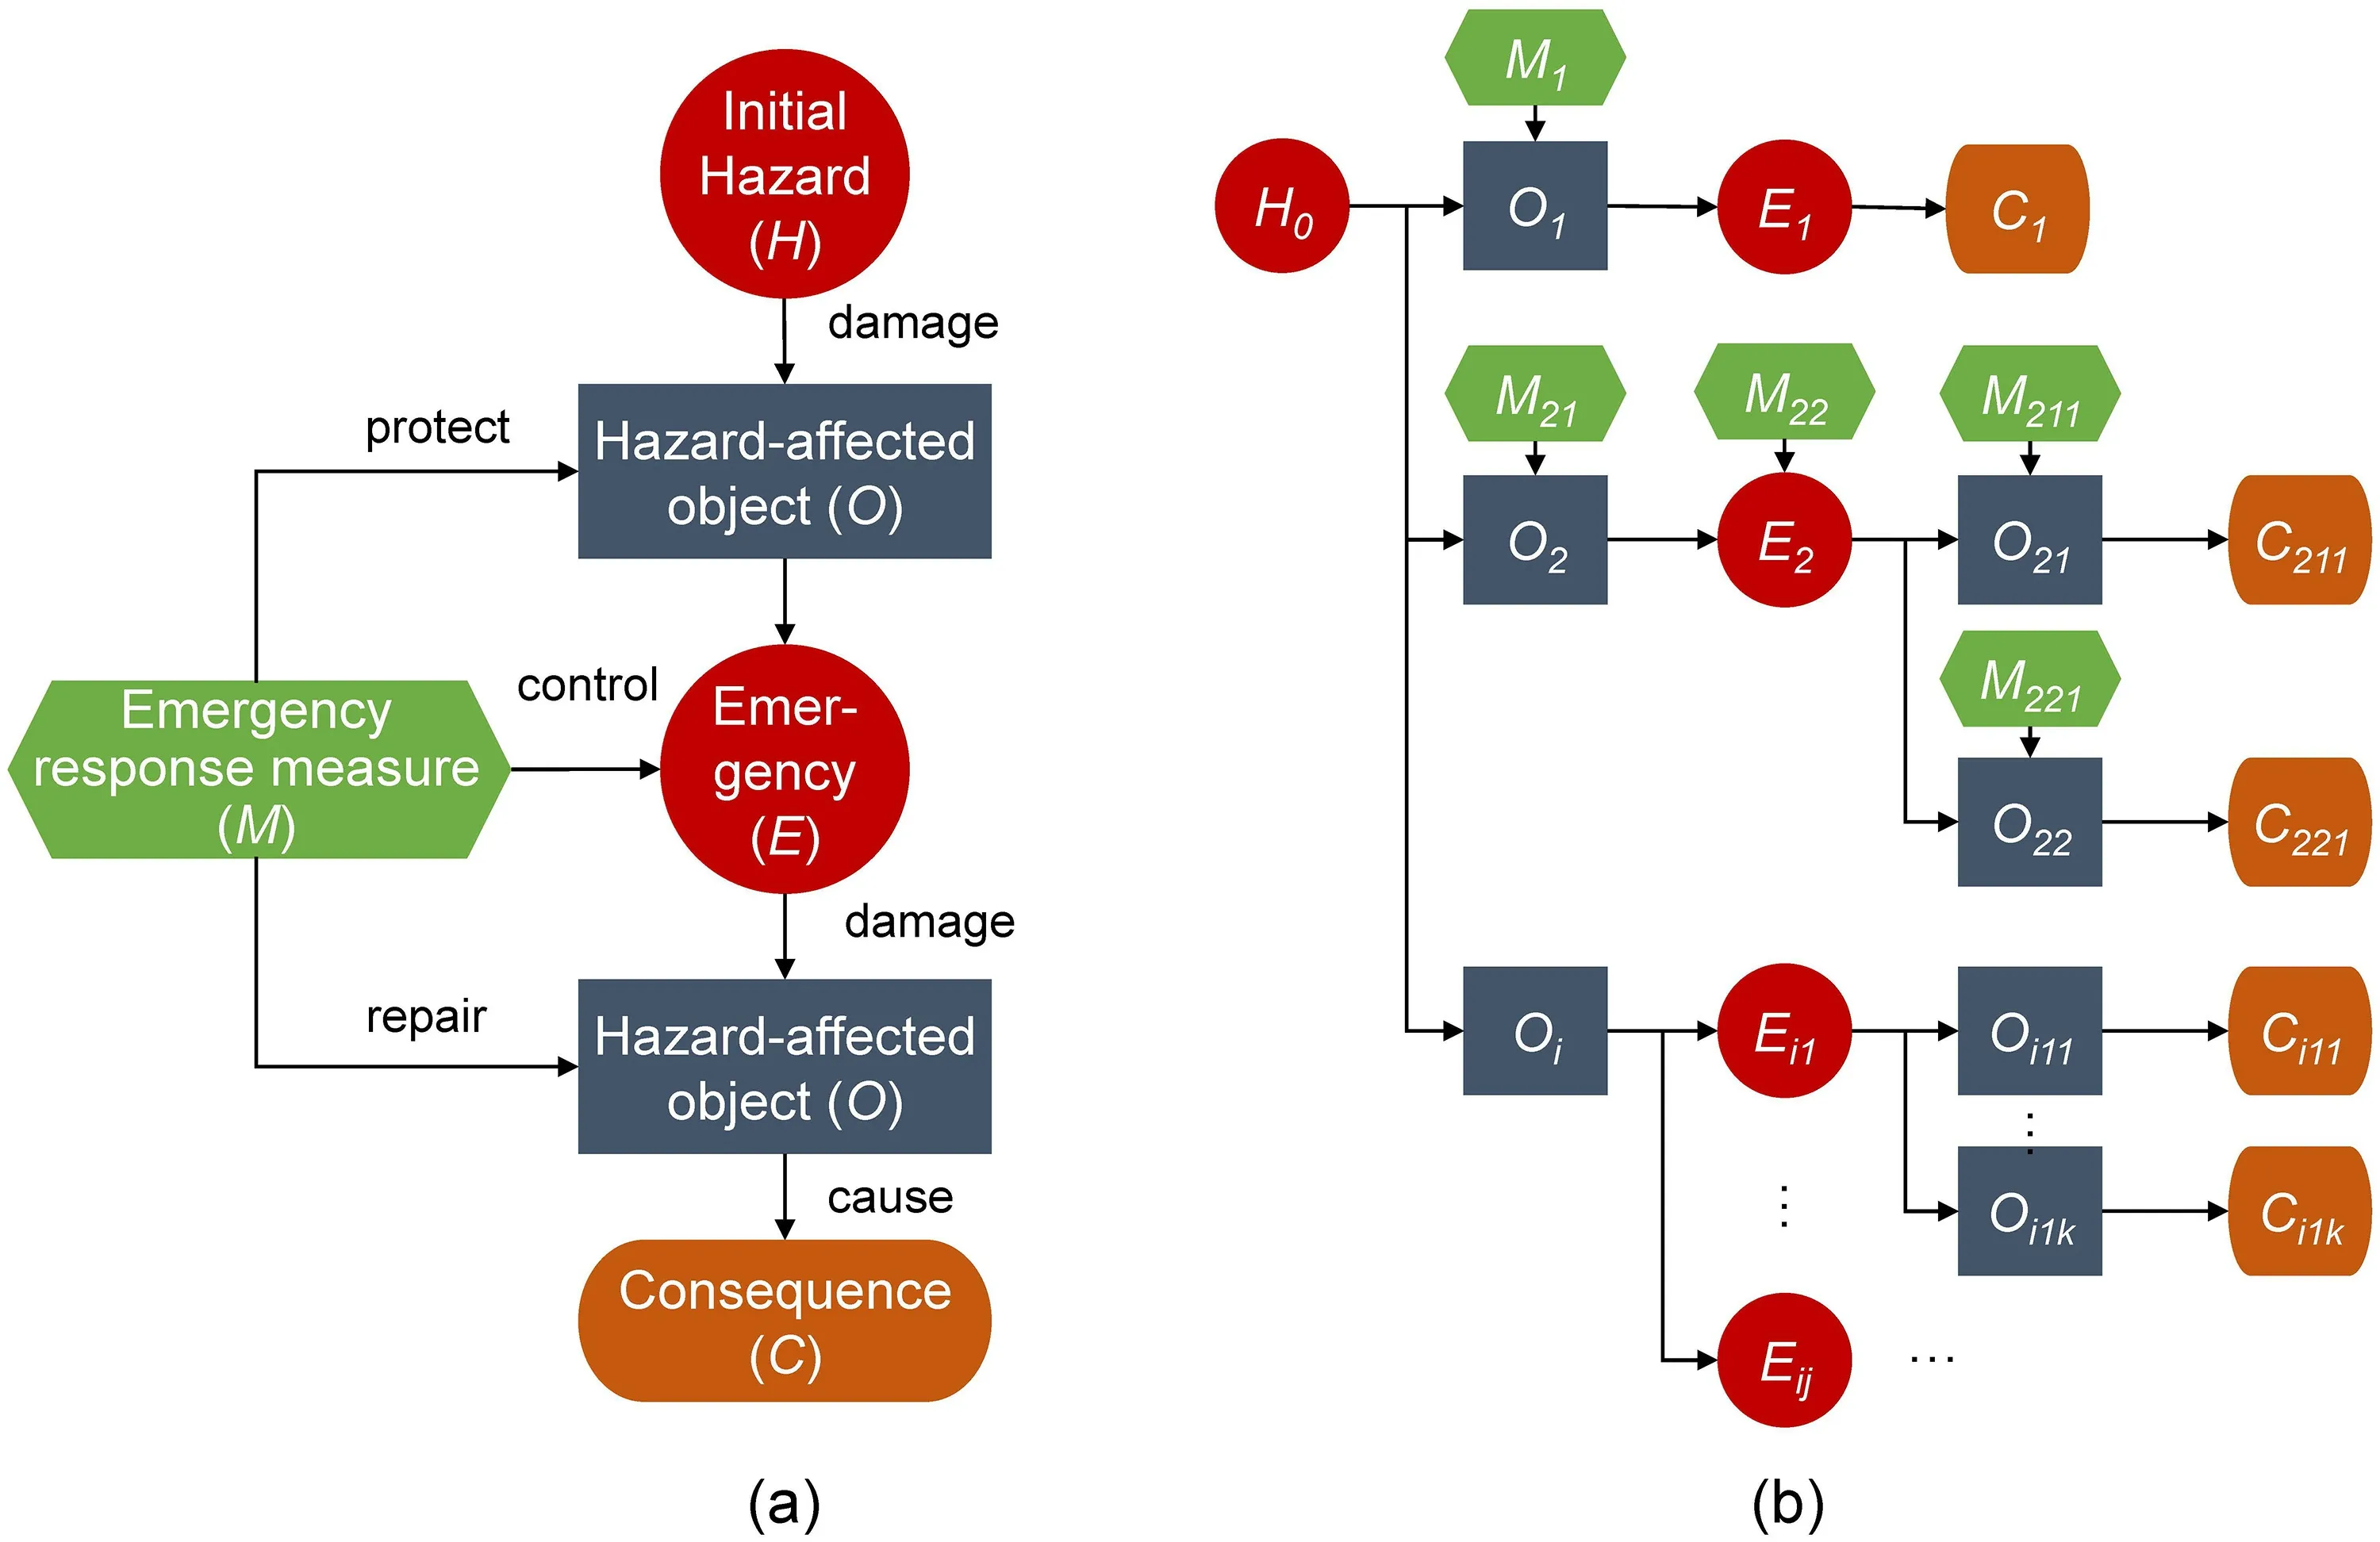
Fig.1 The hazard ( H), emergency ( E), hazard-af fected object ( O), emergency response measure ( M), consequence ( C)(HEOMC) framework of disaster chain scenario construction method.a Relationship between the f ive elements of the HEOMC; b A representation of disaster chains
First, the rainstorm may cause f loods in rivers and lakes.In this situation, the emergency response measure for water conservation facilities is to strengthen water regime monitoring, carry out water resources dispatching, and strengthen facility patrol and protection; the emergency response measure for the hazard f lood is to strengthen f lood regulation,repair river embankments, and block crevasse.The f loods may further af fect urban lifeline systems, houses, and unevacuated residents, causing secondary disasters, economic losses, and casualties.When the f lood acts on lifeline systems, it may result in a cut-of f of water, power, and gas supplies, further af fecting the normal lives of urban residents.In this case, the emergency response measures include strengthening pipeline patrol and reinforcement, adjusting supply routes, repairing damaged pipelines, communicating with the af fected residents, and taking emergency protection measures.Similarly, we identif ied the scenario composition of other rainstorm-induced disaster chains to generate a complete scenario structure diagram of the rainstorm, as shown in Fig. 2.The legends of Fig. 2 are shown in Table 1.
3 Bayesian Network Construction of Rainstorm Chain Scenario
Generally, there are three steps to create a Bayesian network(BN) for a problem domain: (1) Identify the BN variable and its state classif ication; (2) Identify the BN structure, that is,the causal relationship between BN variables; and (3) Learn the BN parameter, that is, the conditional probability table(CPT) for each BN variable.In this study, BN variables and structure were determined based on our proposed rainstorm scenario structure; BN parameters were estimated from both case data and expert knowledge generated by questionnaire surveys and the fuzzy set theory (Zadeh 1965).Details of these processes are described in the following subsections.
3.1 Bayesian Network (BN) Variables and Structure Identif ication
Referring to Fig. 2, we conducted a case study of typical rainstorms and determined the BN network of the rainstorm scenario, as shown in Fig. 3.In total, 57 scenario elements(BN variables) are considered, and the details are shown in Table 2.All of these BN variables, X={X1,X2,…,X57} ,are assigned discrete values.The assignment rules are as follows:
(1)HazardRainstorm is divided into four risk states, blue,yellow, orange, and red, based on whether hourly rainfall depth, 6-h rainfall depth, or 24-h rainfall depth reaches the threshold (30, 50, 70), (50, 70, 100), (70,100, 150), and (100, 150, 200), and the value unit is mm.The thresholds are set according to the rainstorm warning rules for City B.
(2)EmergencyThe f irst rule is to divide based on risk level.Flood is divided into two states: low risk and high risk.If the rainfall is within the disaster-inducing threshold of small and medium-sized rivers, it is coded as low risk; otherwise, it is high risk.The other rule is to divide according to whether an incident occurs ornot.For example, if the construction is waterlogged, it is coded as yes; otherwise, no.
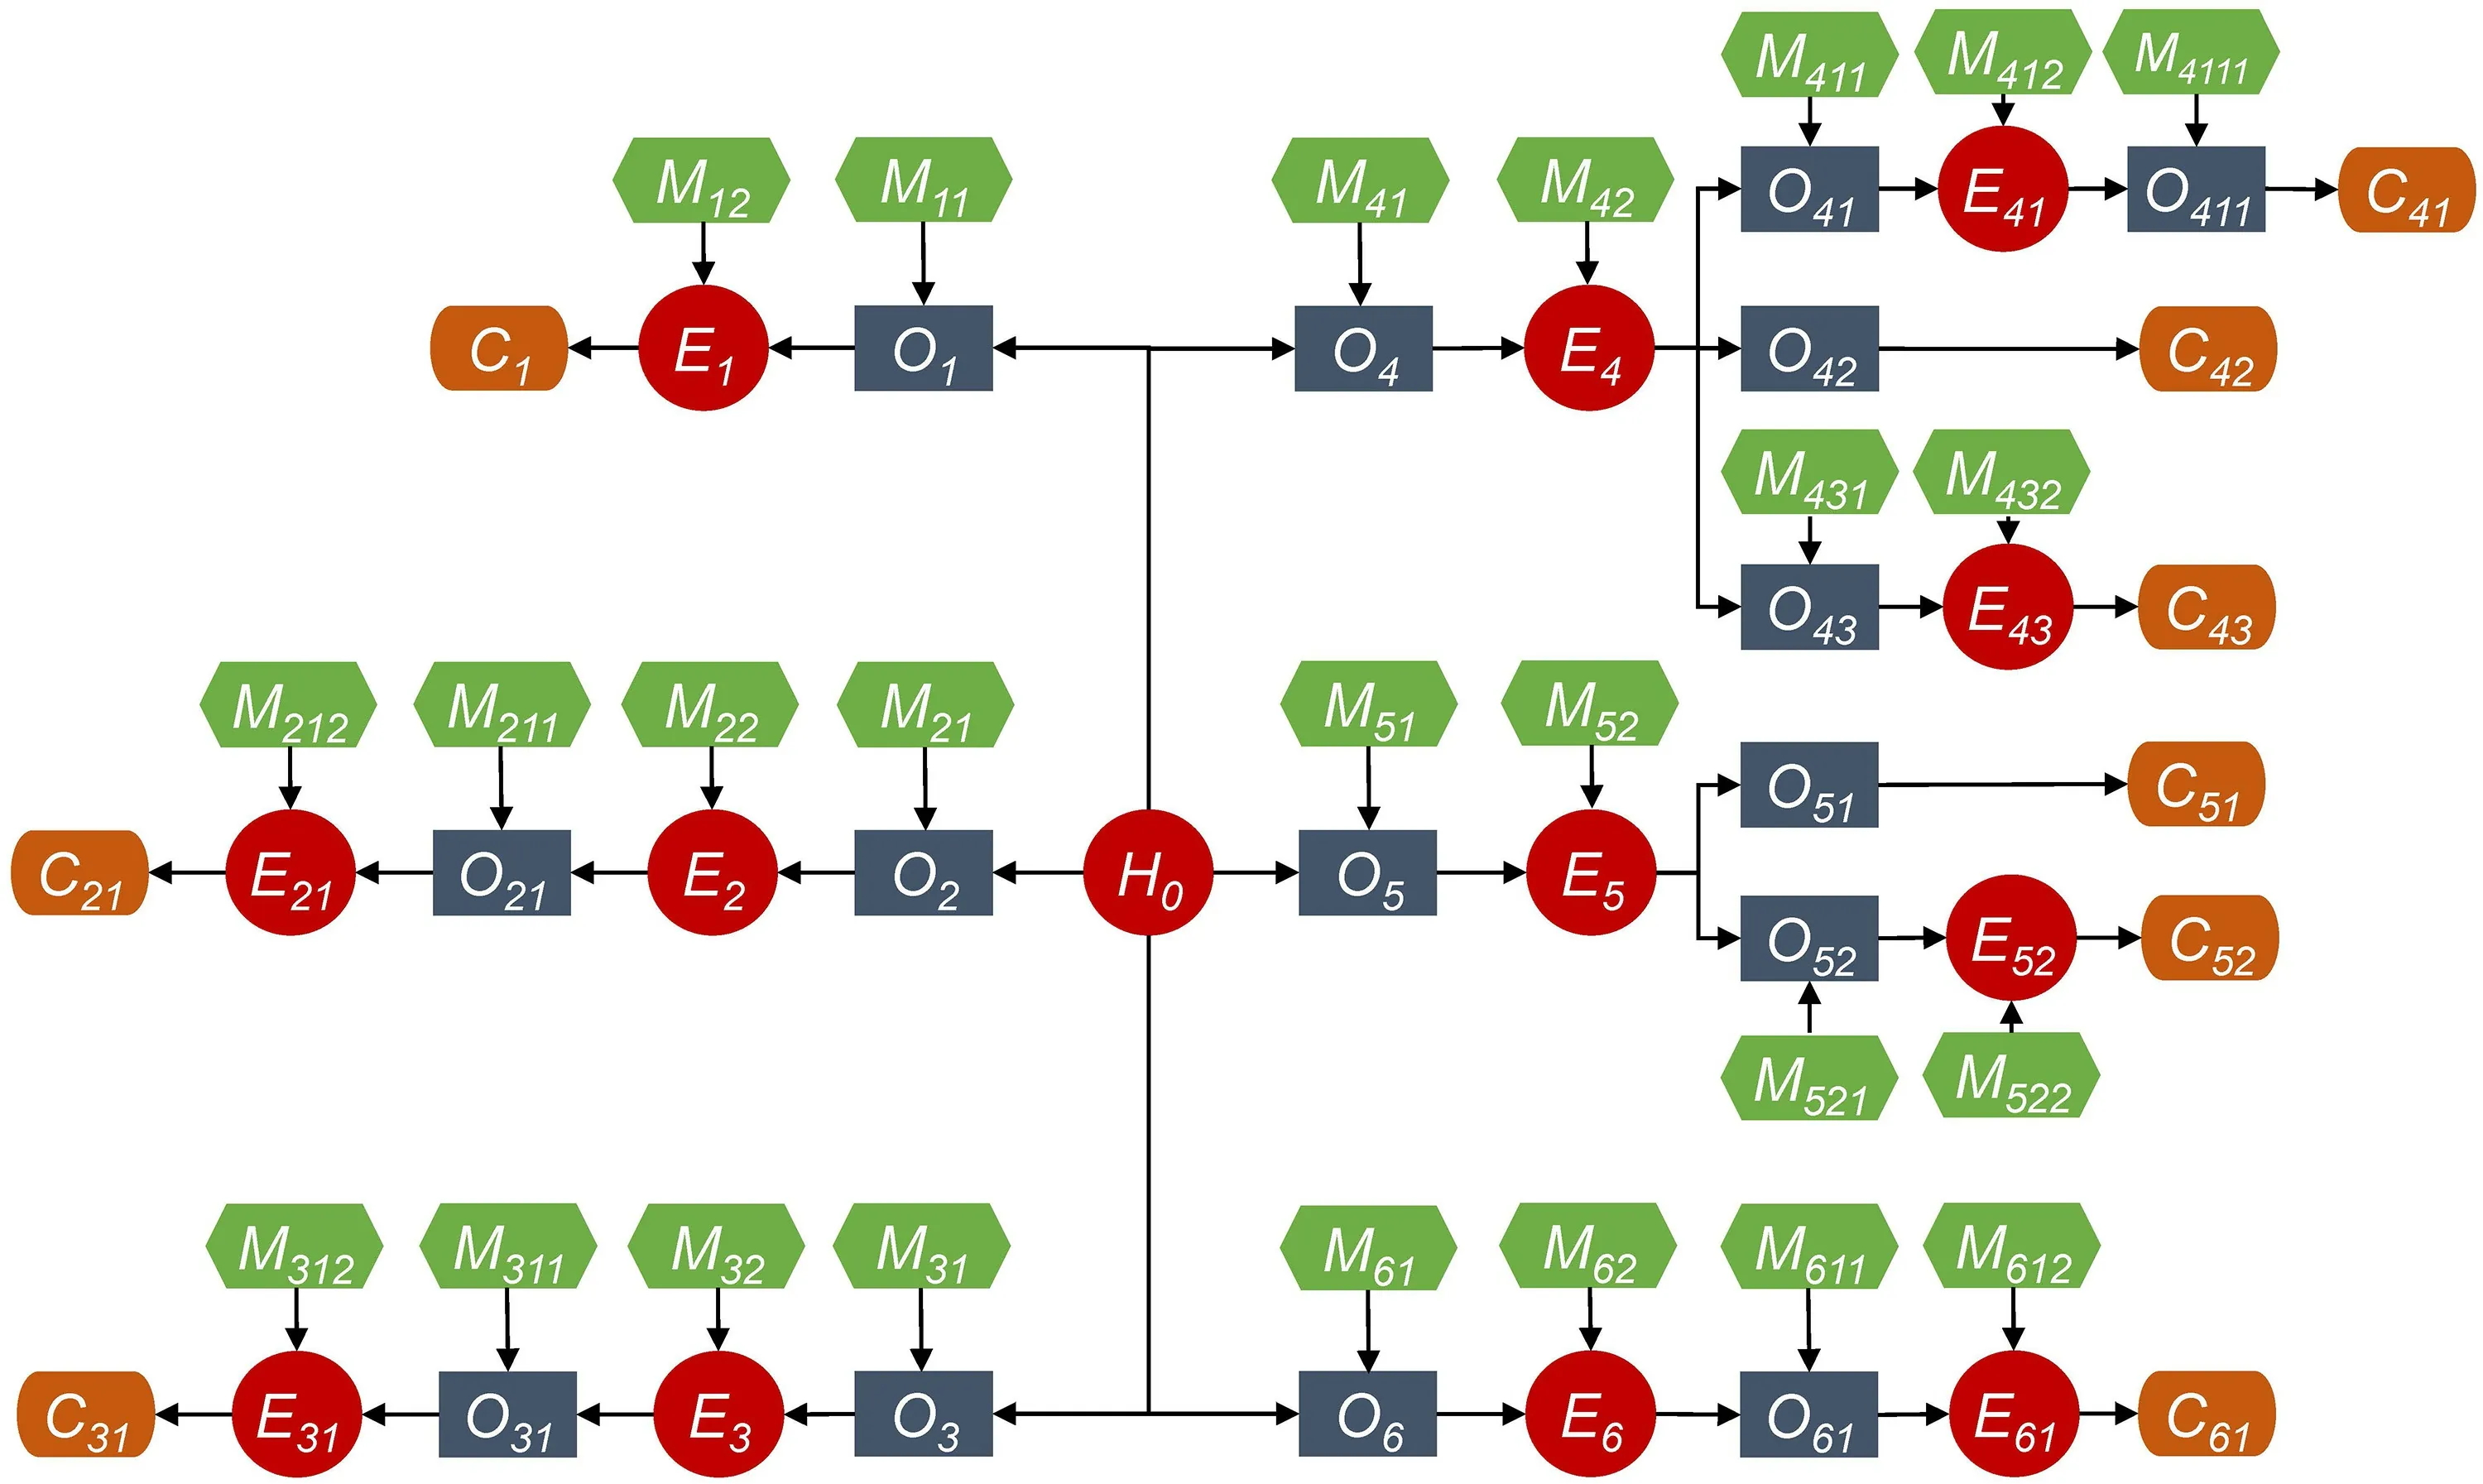
Fig.2 Scenario structure diagram of the rainstorm
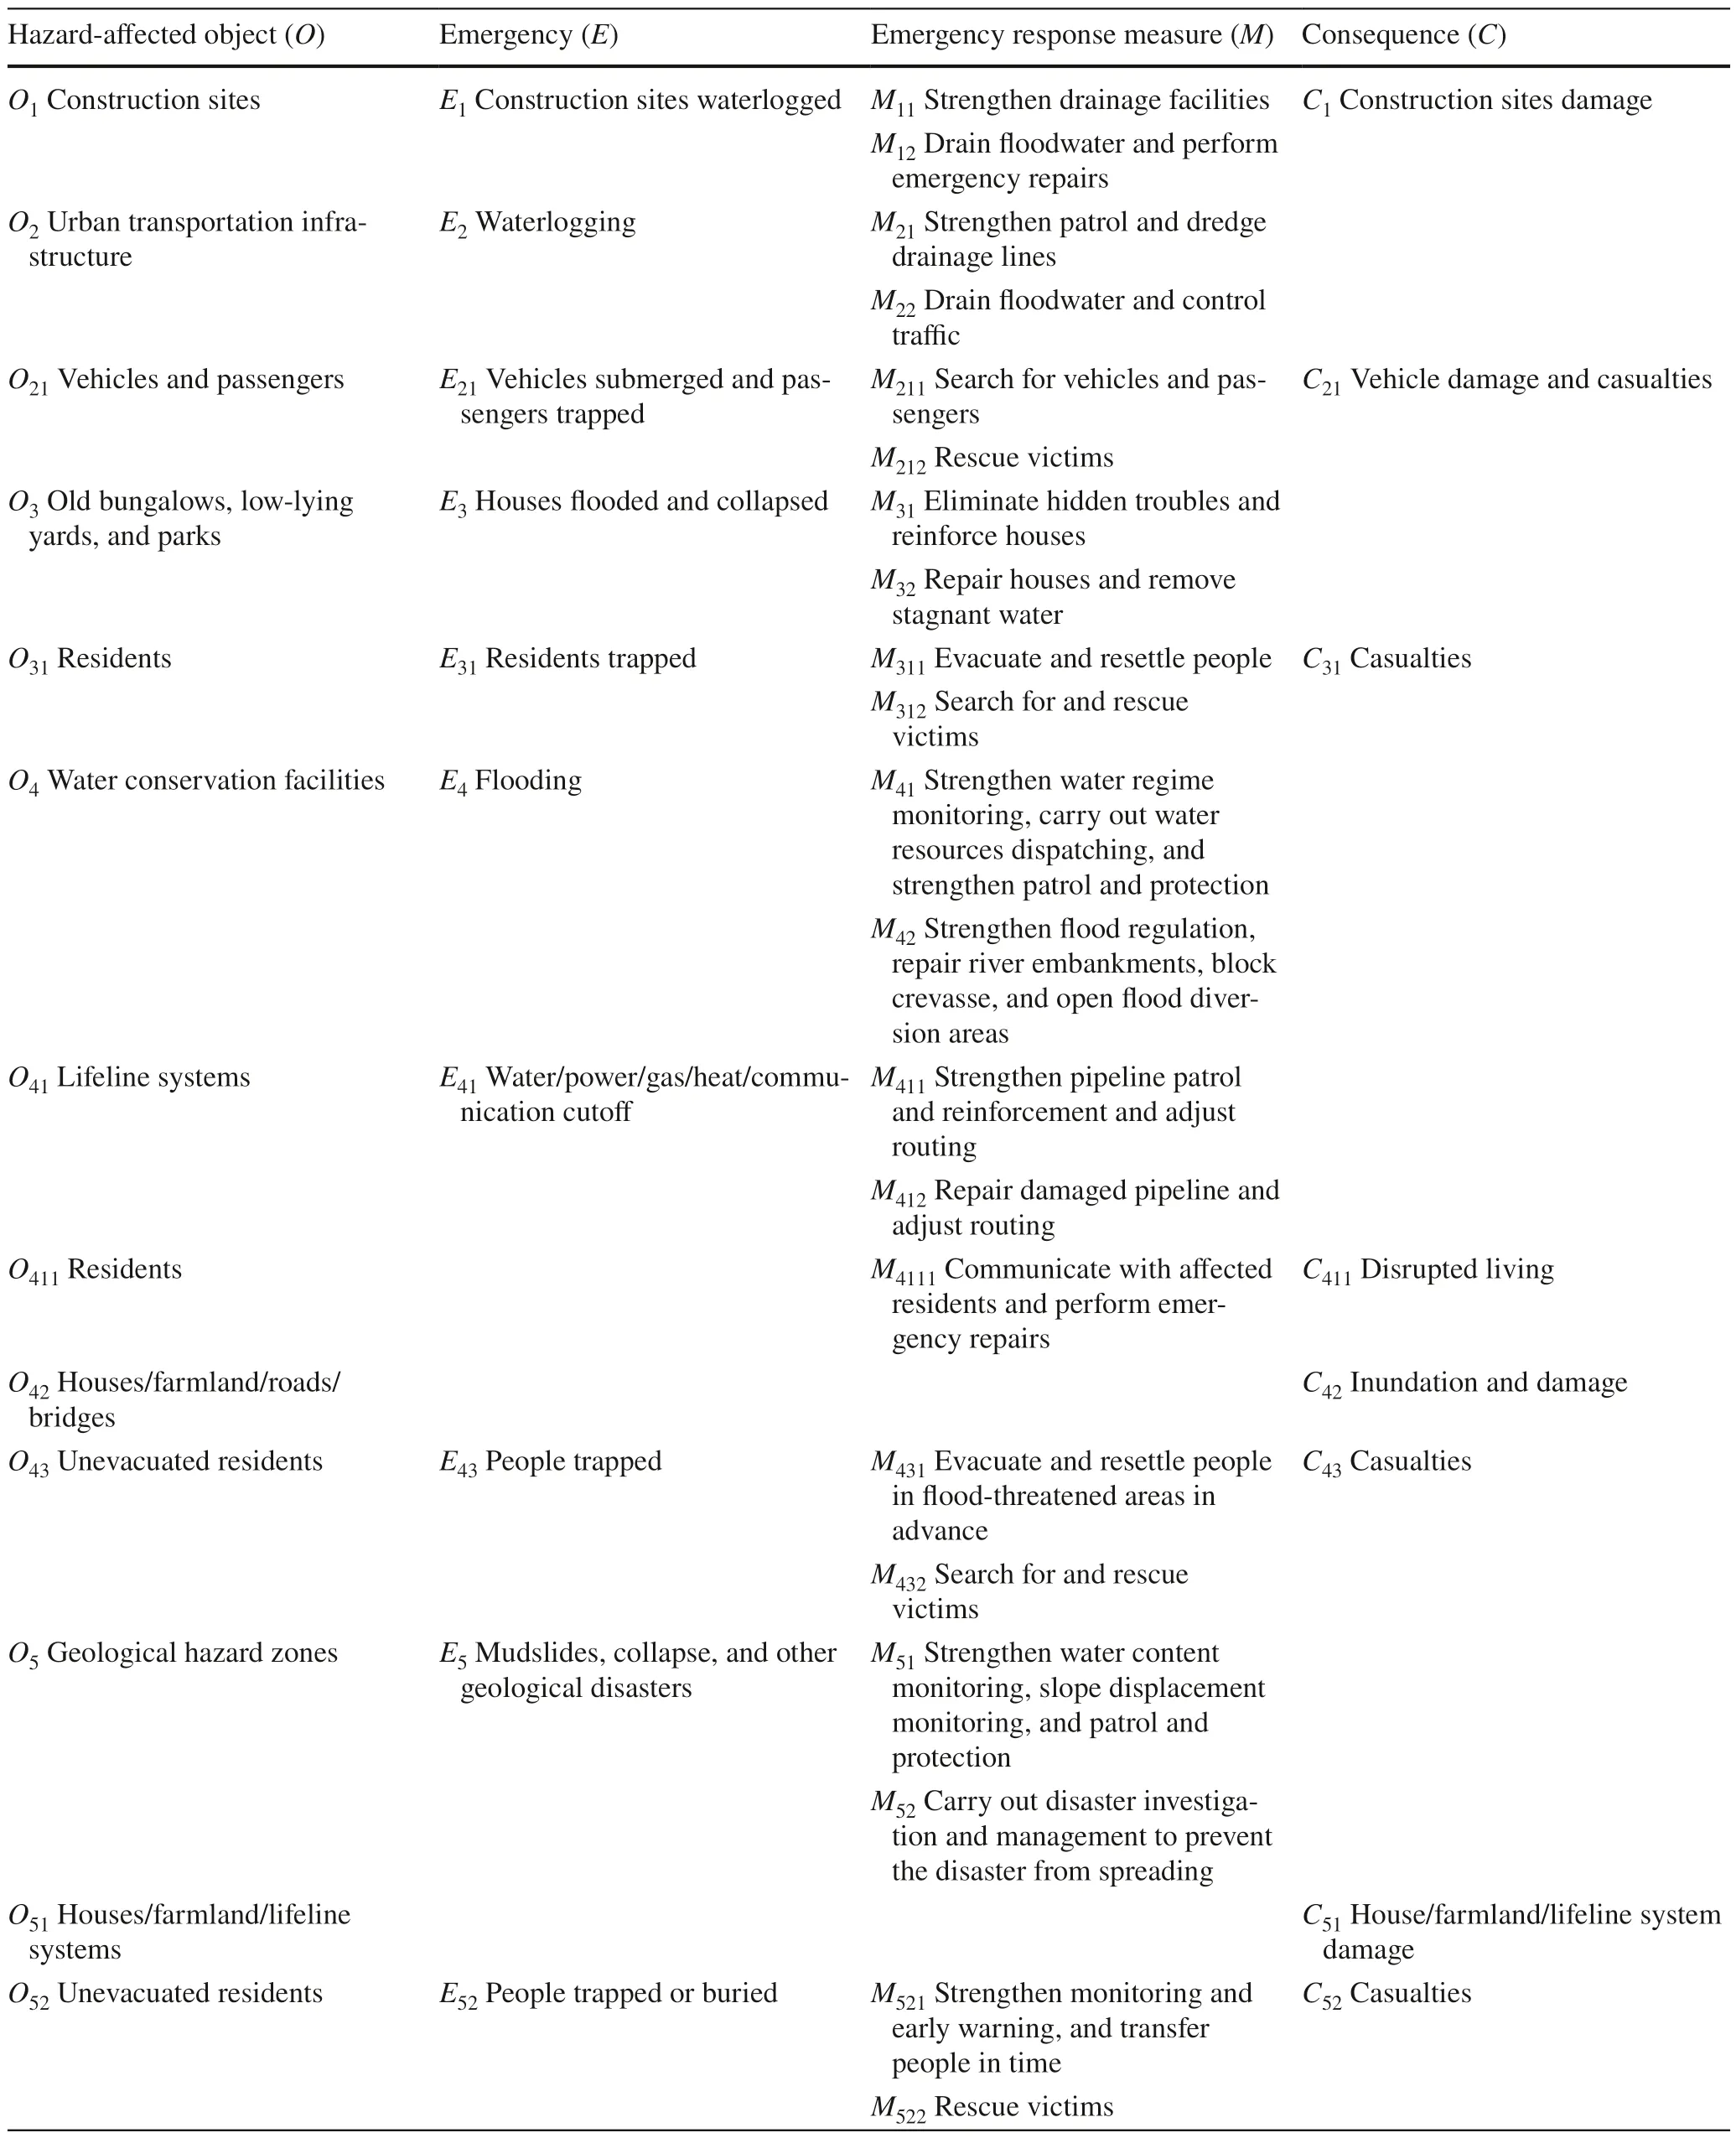
Table 1 Legends of the scenario structure diagram for the rainstorm (Fig. 2)

Table 1 (continued)
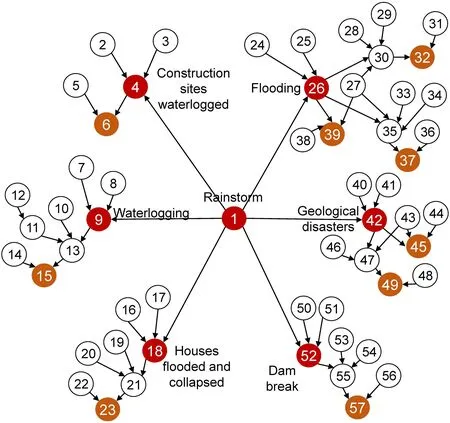
Fig.3 Bayesian network (BN)of the rainstorm scenario
(3)Hazard-af fected objectThe f irst rule is to divide based on risk level.Urban transportation infrastructure is divided into three states: low risk, medium risk, and high risk.For urban transportation infrastructure, if the rainfall intensity is within the design standard of all roads, it is coded as low risk; if the rainfall intensity exceeds the branch road design standard, it is medium risk; and if the rainfall intensity exceeds the trunk road design standard, it is high risk.The other rule is based on the state of the hazard-af fected object itself, that is,whether it exists, or the degree of its vulnerability.For example, lifeline systems are divided into yes or no,and the population of f lood diversion areas is divided into sparse and dense.
(4)Emergency response measureBased on whether the emergency response measure is carried out, it can be divided into two states: yes or no.
(5)ConsequenceBased on whether the consequence occurs, it can be divided into two cases: yes or no.
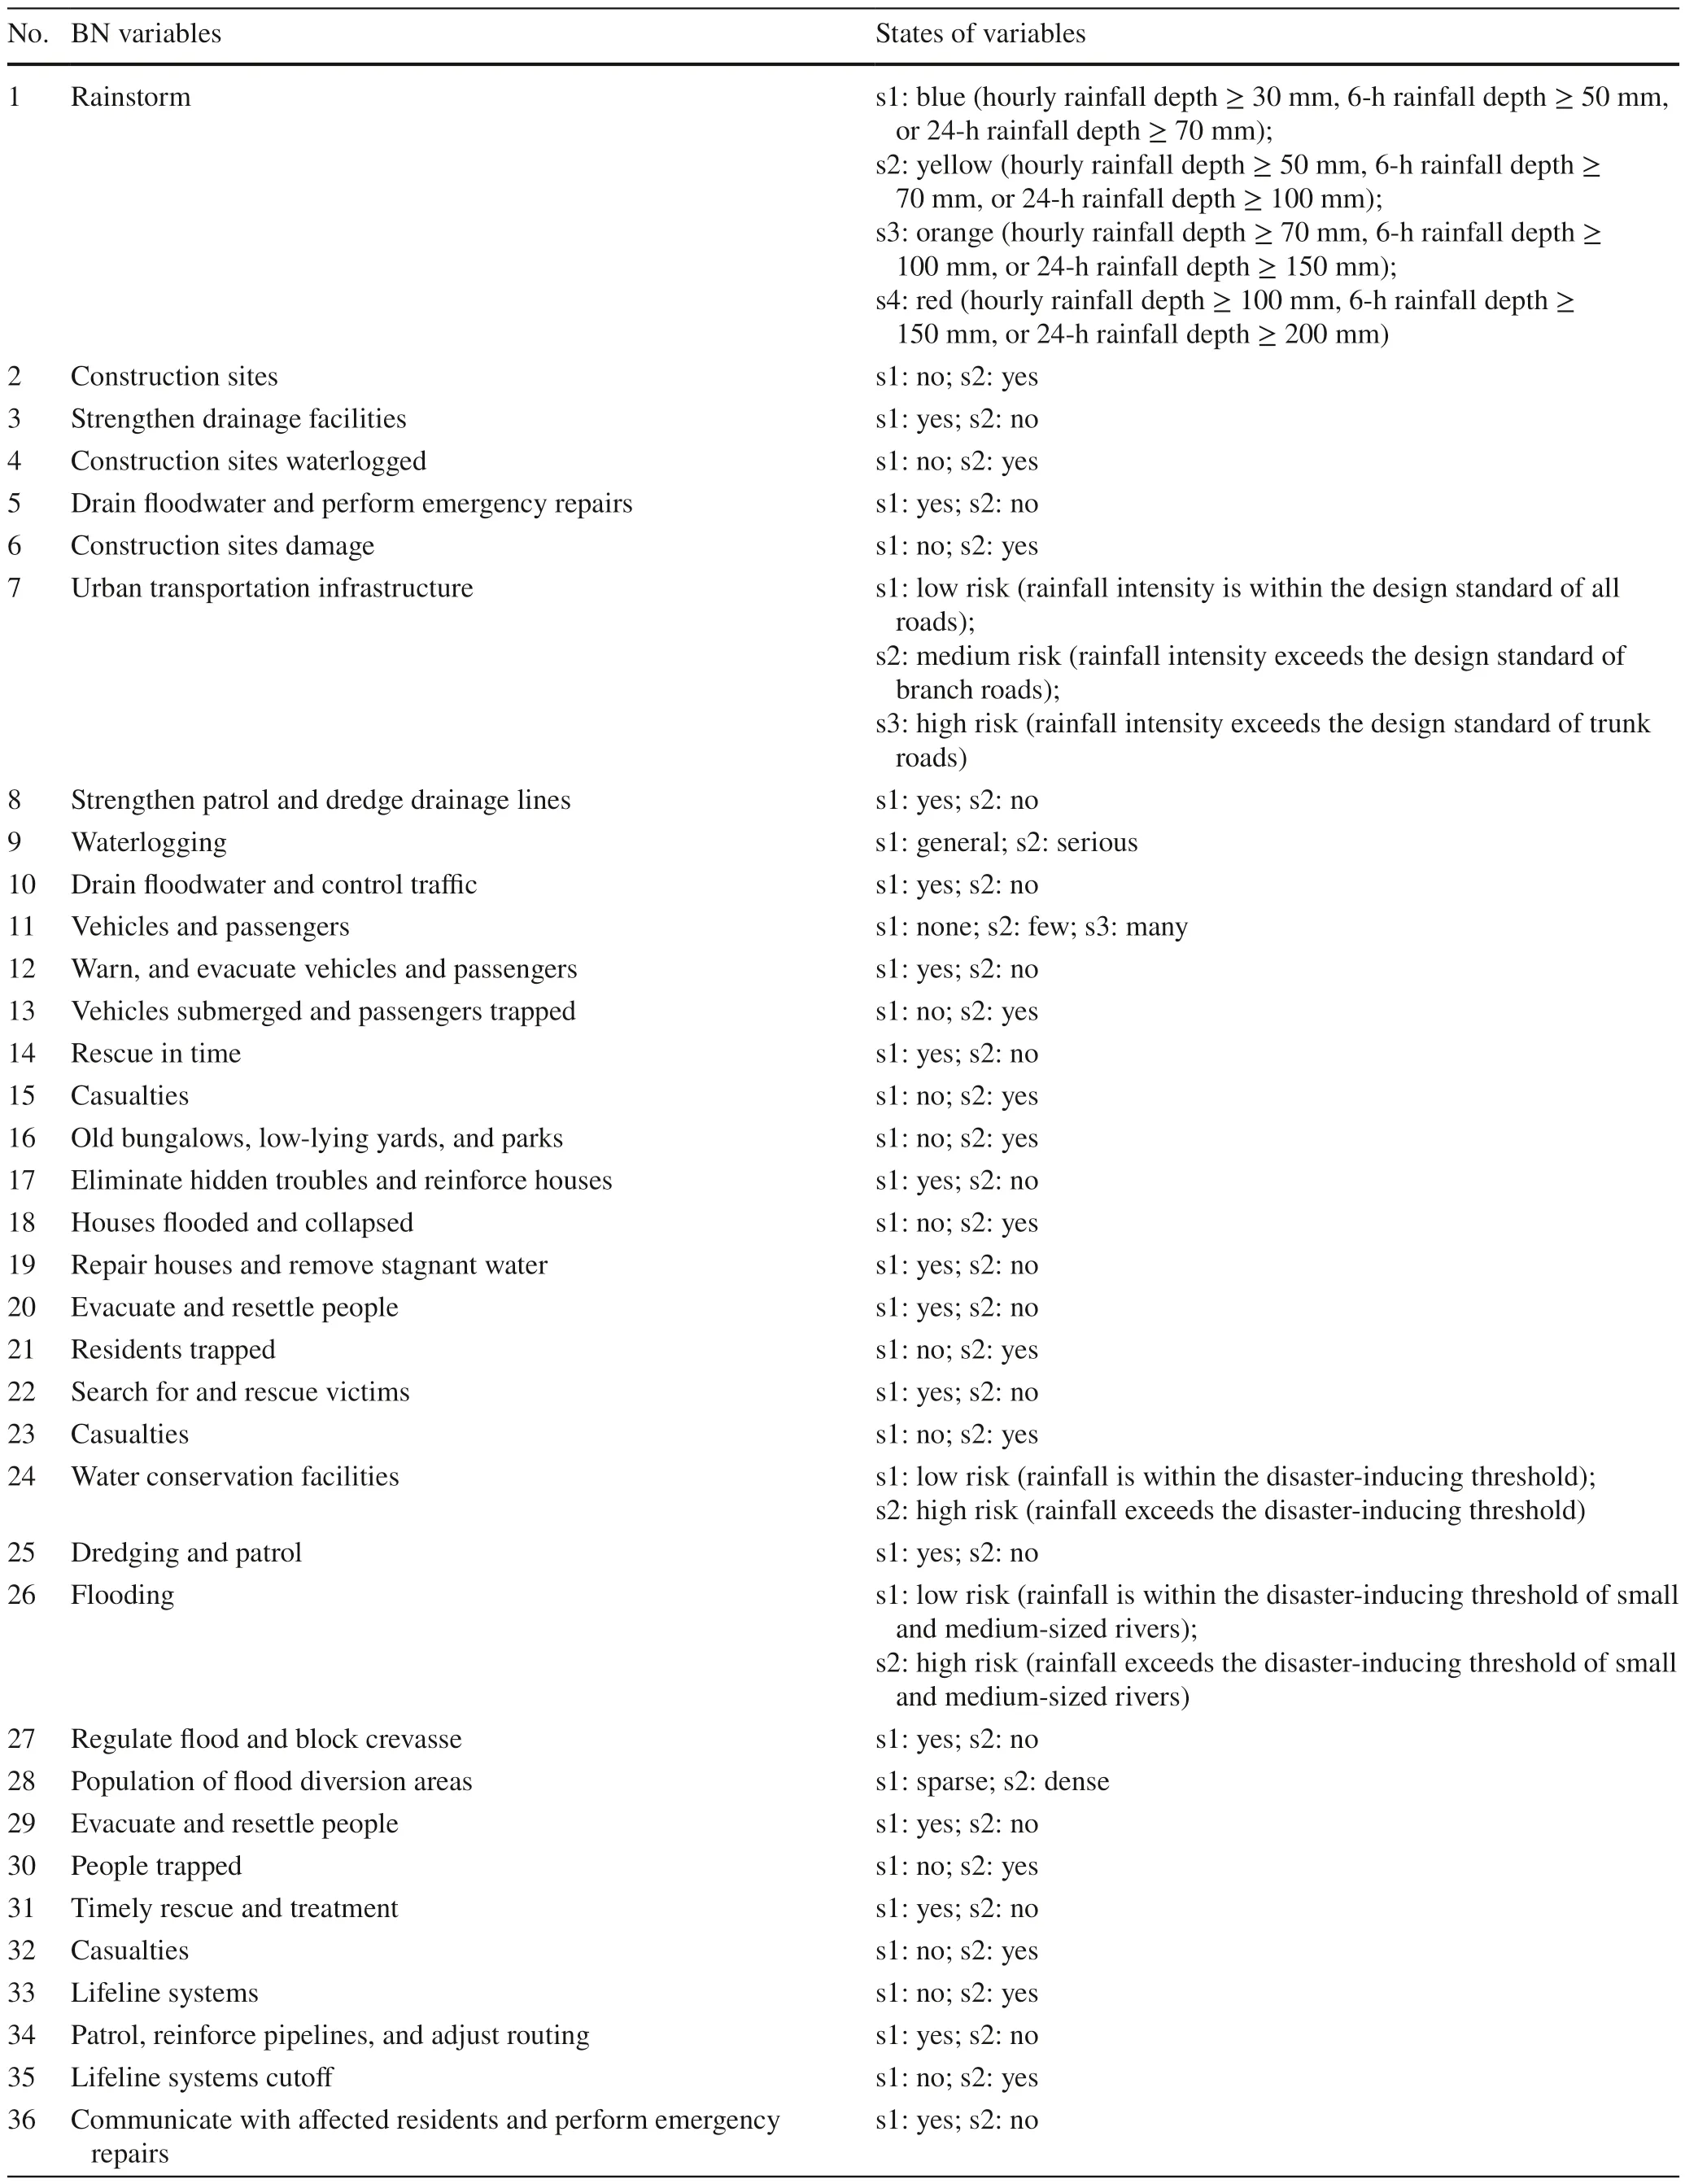
Table 2 Bayesian network (BN) variables of the rainstorm scenario and their states
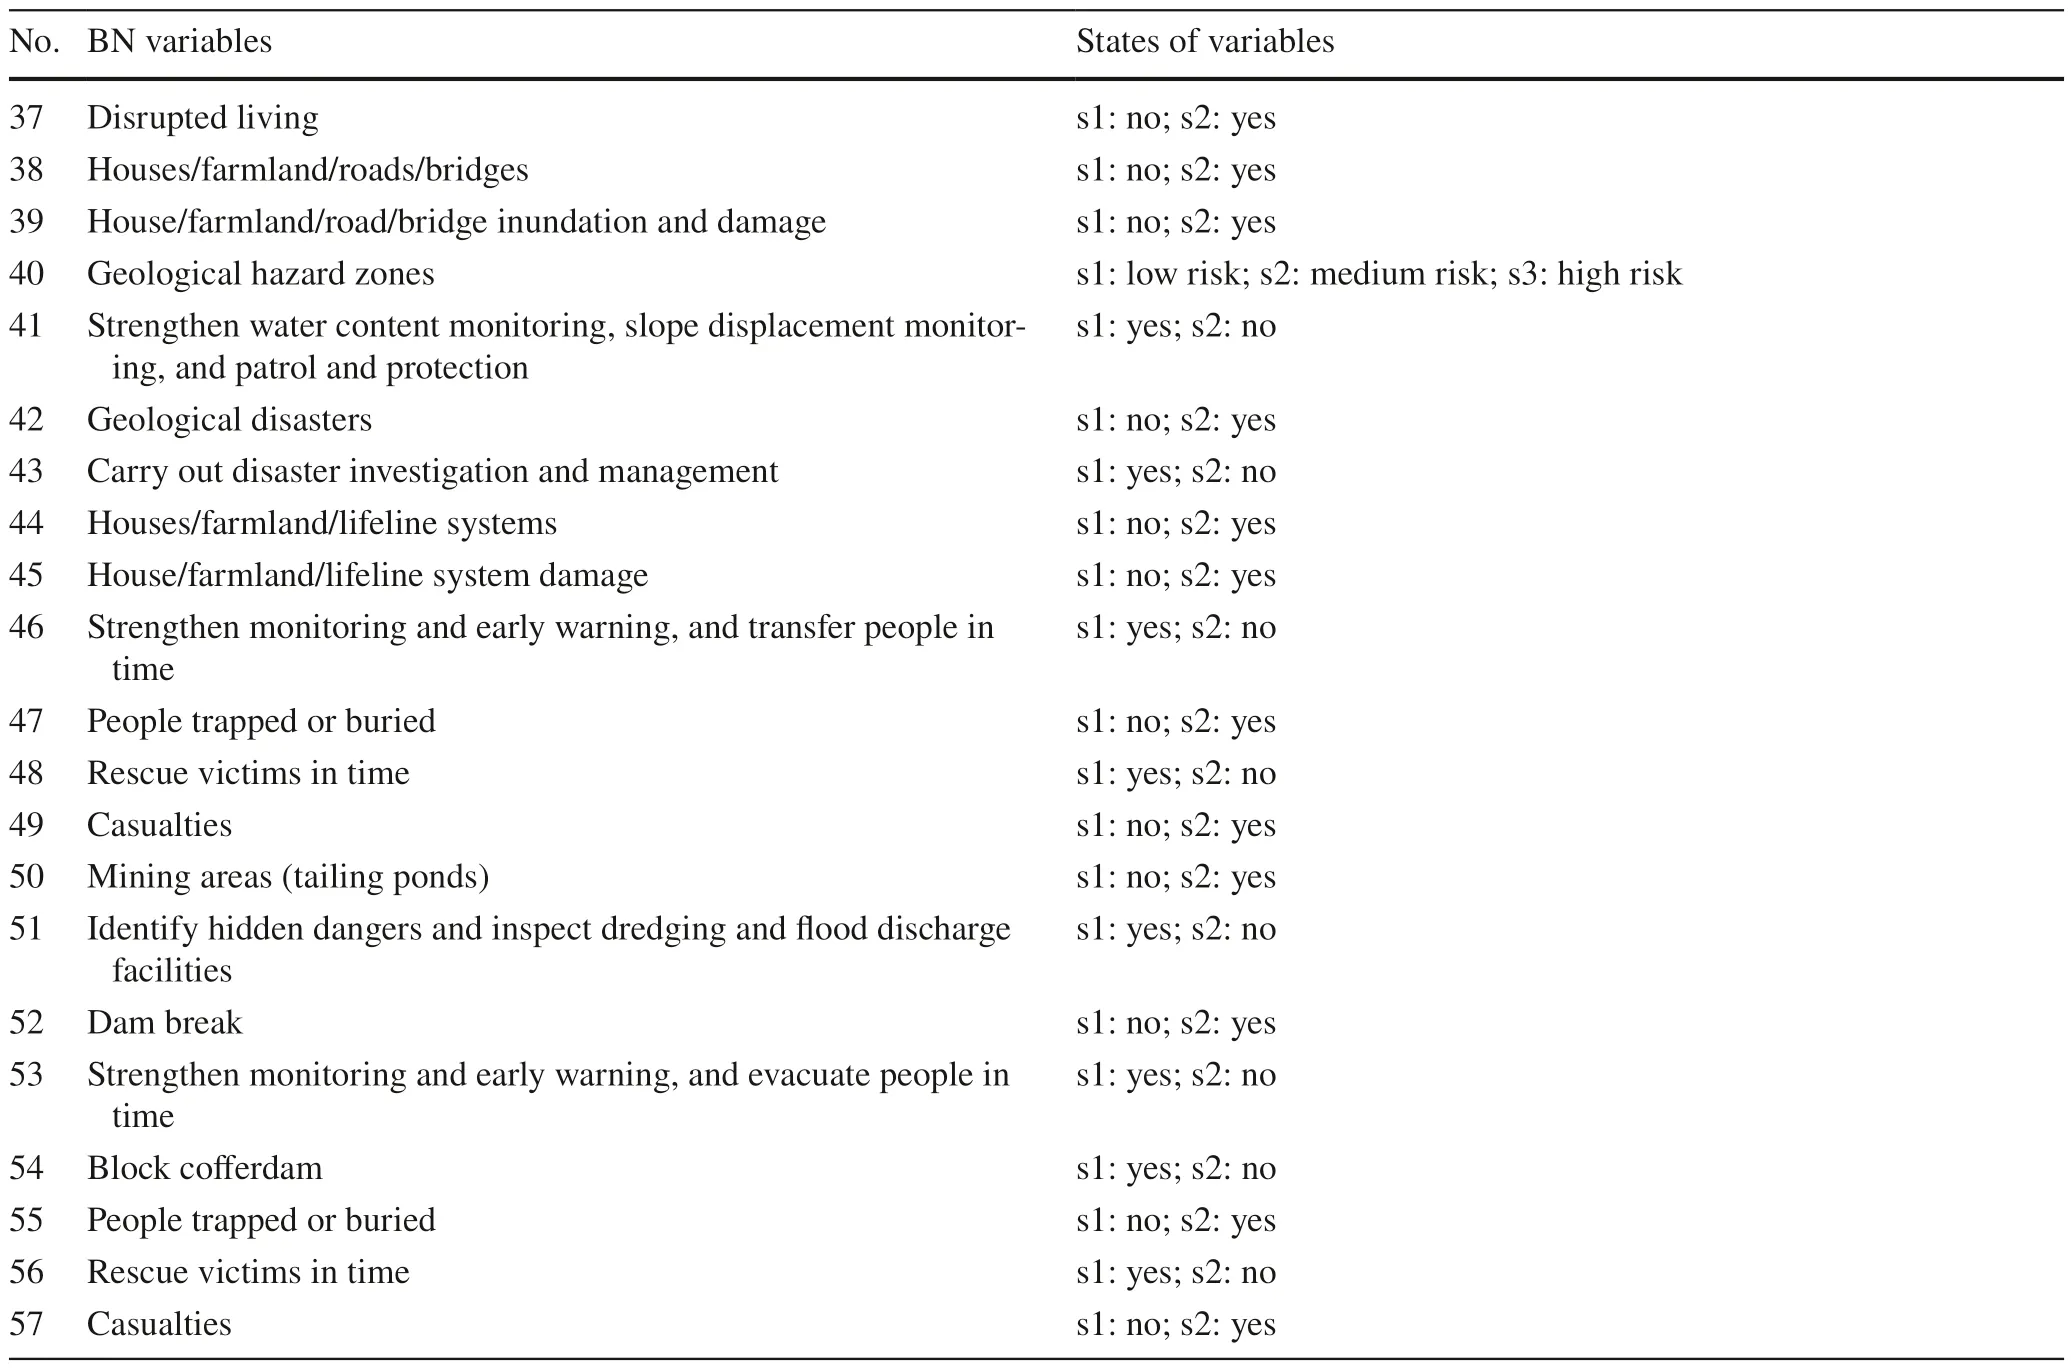
Table 2 (continued)
3.2 Bayesian Network (BN) Parameter Estimation
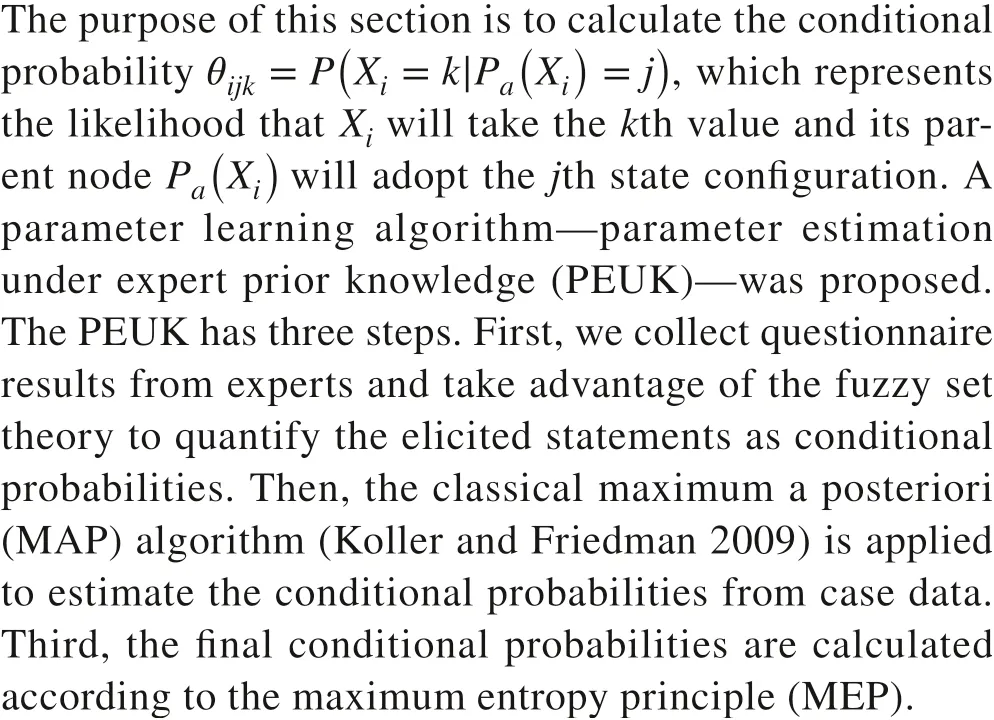
3.2.1 Parameter Estimation Under Expert Prior Knowledge(PEUK) Algorithm Overview

The BN nodes are classif ied into two categories.The f irst type lacks parent nodes and requires specialists to give prior probability based on professional experience, such as Node 1 (Fig. 3).The second type is represented by Node 4 (Fig. 3), whose conditional probabilities are af fected by their parent nodes.We use a questionnaire survey to collect qualitative statements of CPTs, and then use the fuzzy set theory to process the results.
The numerical probability scale is used to elicit single probabilities.Experts are required to judge probabilities with a verbal description.Seven intervals are def ined, see Fig. 4 a.The translation of the verbal probability scale into fuzzy sets is provided in Fig. 4 b (Rohmer 2020).For a fuzzy number,̃X=(a,b,c) as seen in Fig. 5, is referred to as a triangular fuzzy number, and its membership function is def ined by Eq. 1, wherea,b, andcindicate the lowest, most likely, and top least likely values, respectively.Given two triangular fuzzy numbers,̃A1=(a1,b1,c1) and̃A2=(a2,b2,c2) , Eq. 2 def ines the operators betweeñA1and̃A2, which includes addition, subtraction, multiplication, and division.
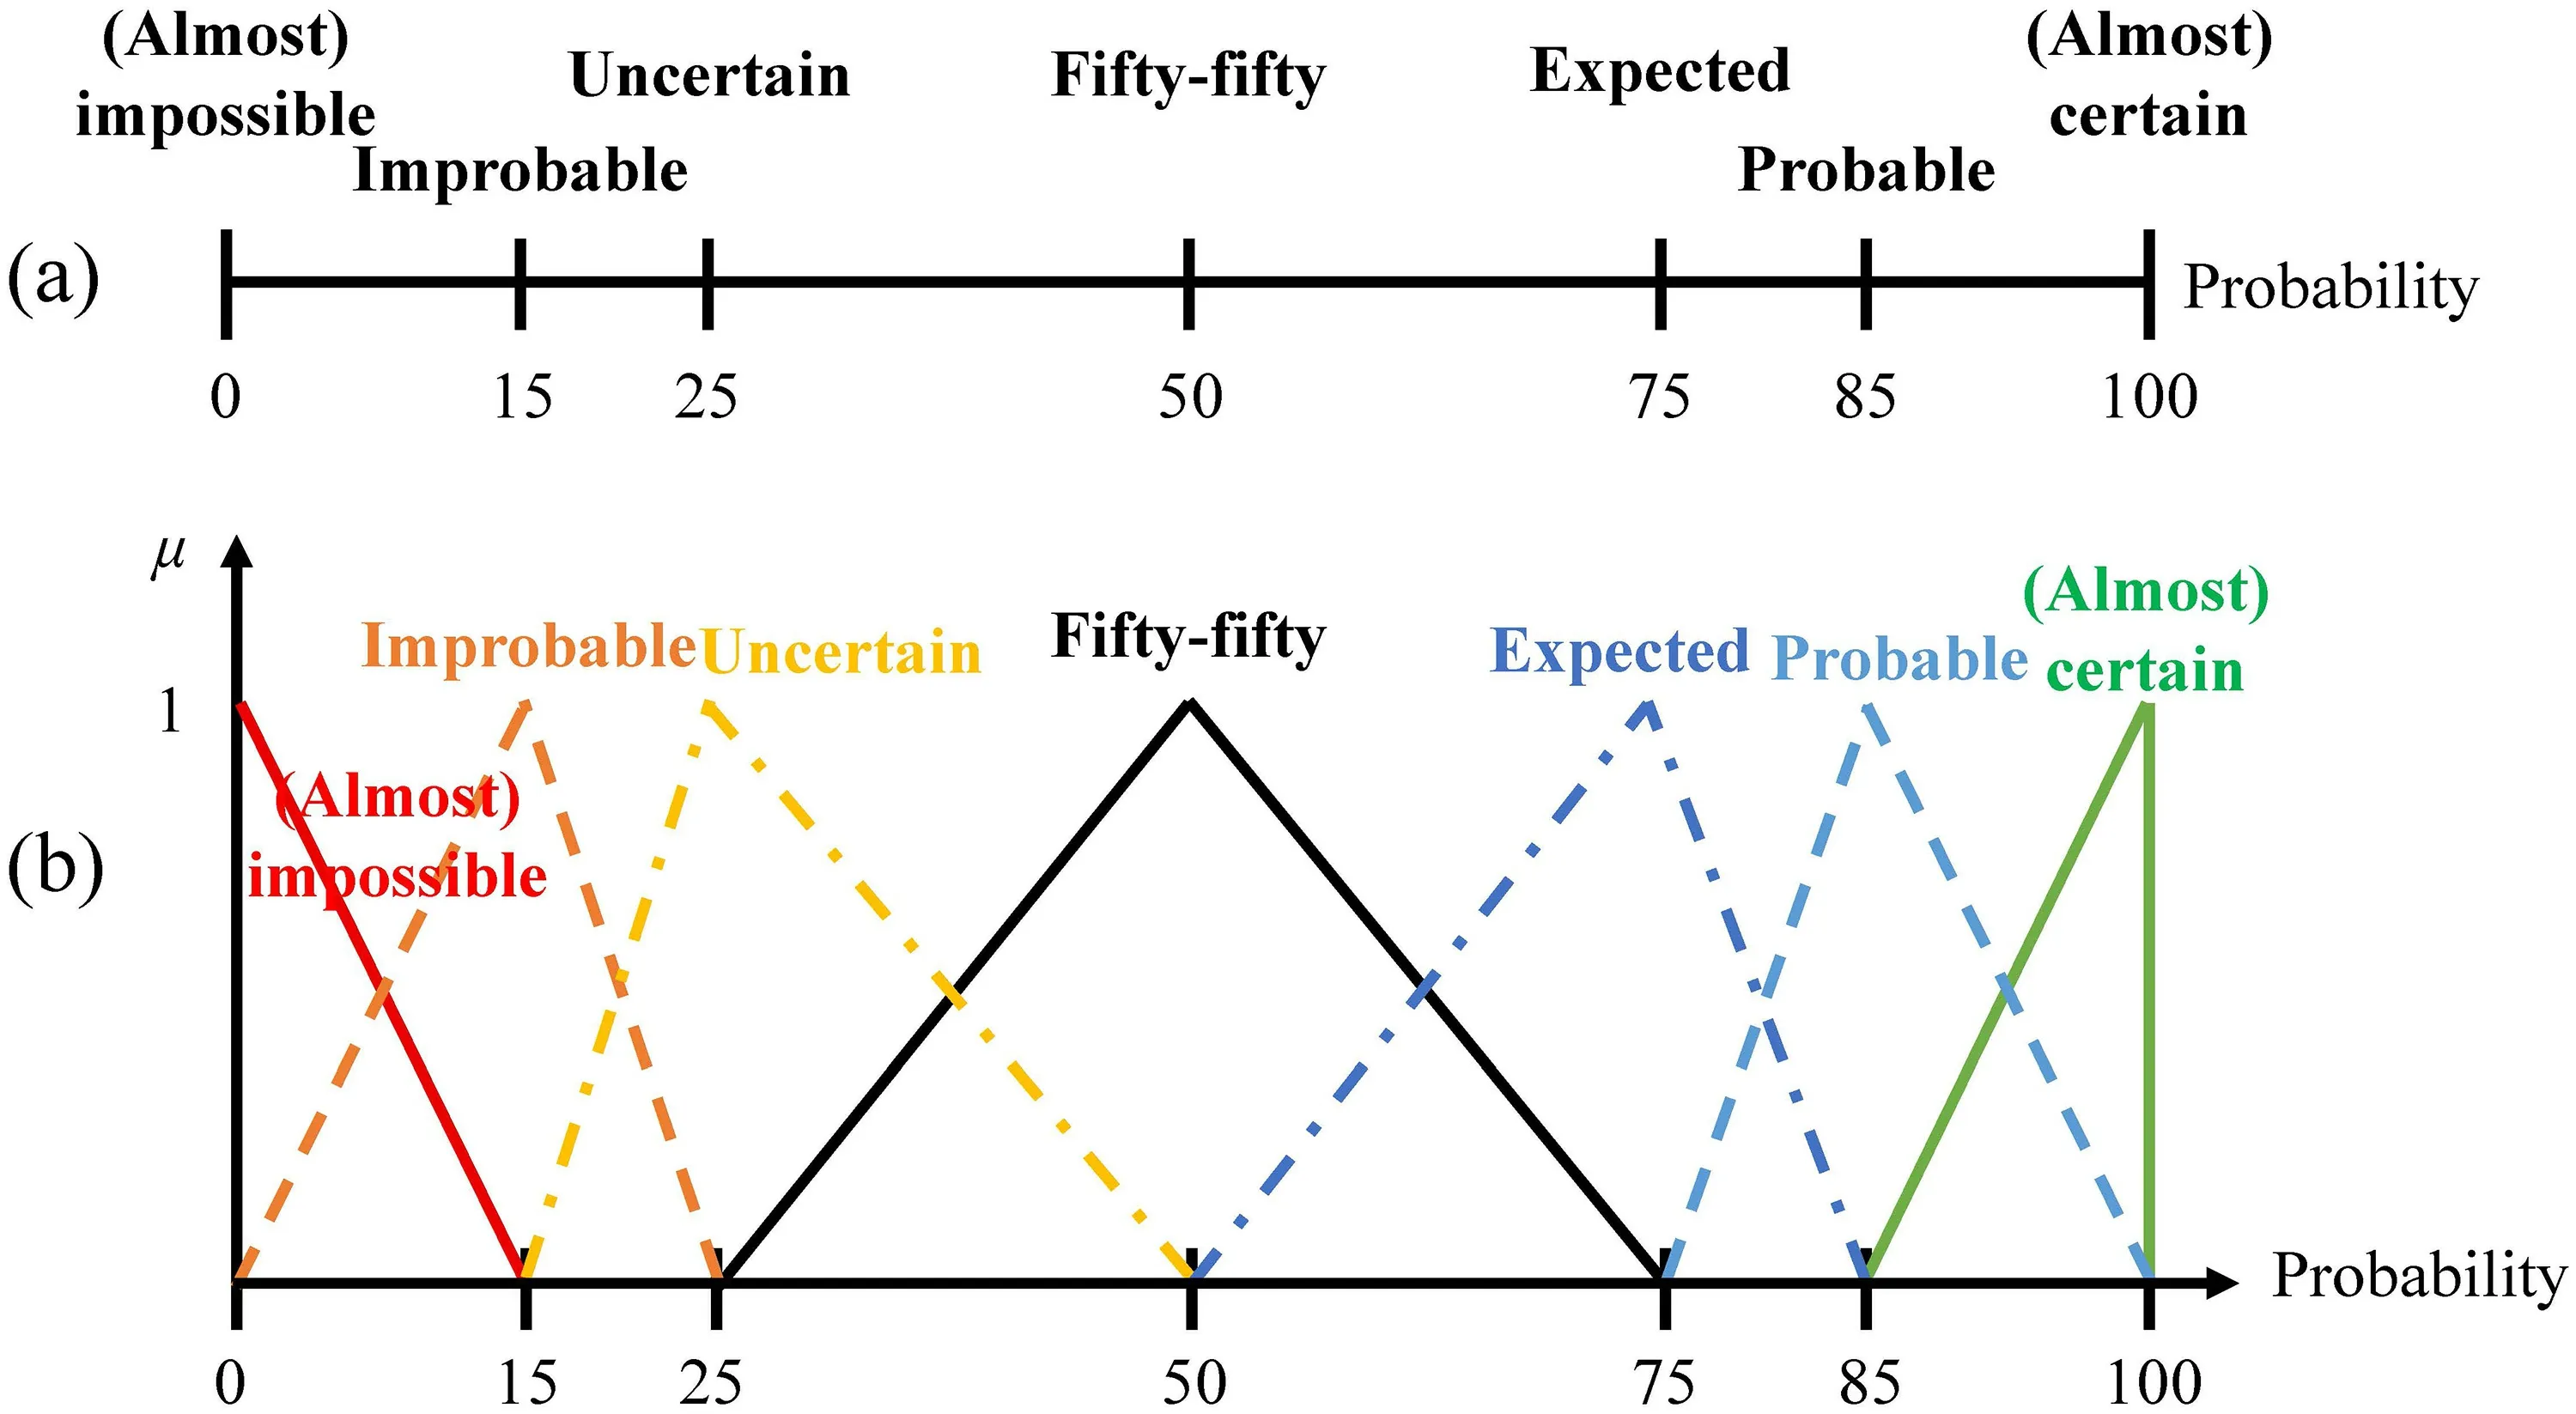
Fig.4 a An example of a probability intended to aid expert conditional probability table(CPT) elicitation; b Fuzzy set translation of the probability qualif ied in ( a) ( μ is the degree of membership).
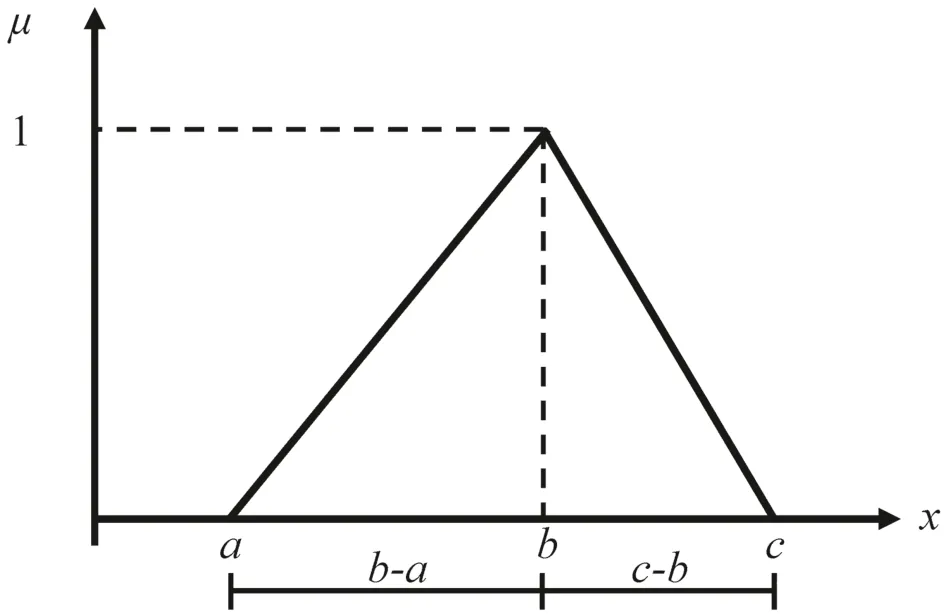
Fig.5 Triangular fuzzy number ̃X ’s membership function

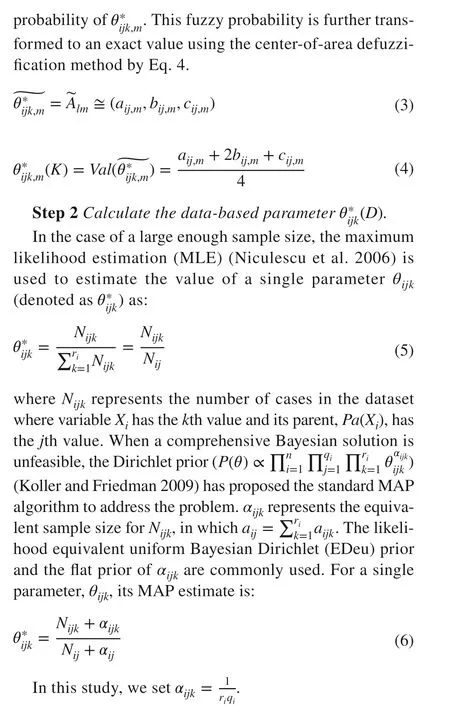
When the sample size is small, MLE is usually inaccurate.Koller and Friedman ( 2009) def ined a method for computing the sample complexity bound (PAC-bound) for learning the parameters of a f ixed BN structure:
whereMis the number of samples quadratically to the error 1∕𝜀,𝜆is a measure of the skewness of the distribution with the conf idence 1 −𝛿,dis the maximum number of parent nodes in BN,𝛾is the KL divergence, andnis the total number of network nodes in the BN.Hered=4 andn=57.𝜆and𝛾are theoretical values related to the sample distribution.Our sample is discretized so that it is not possible to solve for these two values.For simplicity, both are assumed to be 1.Setting𝜀=0.05 and𝛿=0.01 , we get thatM≥ 1907.That is, we need a bit more than 1907 samples to conf idently estimate the probability of an event to within 5% error.
Step 3Calculate the PEUK parameter(PEUK).
To calculate thePEUKparameter, the maximum entropy principle (MEP) is used, with the fundamental tenet that the probability distribution that most accurately captures the current level of knowledge has the highest entropy.Based on a model using MEP, it is suggested that the parametric form for the modelp∈Cmight be def ined as follows (Berger et al.1996):
whereCis a collection of the probability distributions that satisfy the constraint requirements, andp(x)p(y|x) is the joint probability of the random variables related to events.The conditional distribution’s mathematical measurep(y|x) is supplied by the conditional entropy.
We involveMdomain experts to obtain the constrained knowledge.According to MEP, if BN candidate parameters satisfy the constrained knowledge, they have an equal probability of approaching the real BN parameters.The maximum entropy principle helps to address the issue of parameter estimation in the statistical averaging model naturally.Then,for a BN parameterθ ijk, its estimation is:
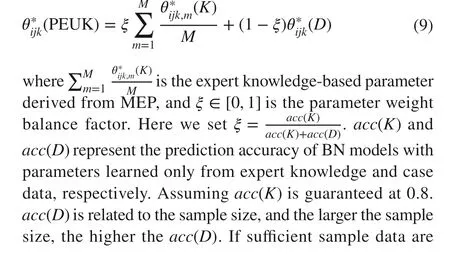

3.2.2 Evaluation of the Parameter Estimation Under Expert Prior Knowledge (PEUK) Algorithm
This section evaluates our BN model with the PEUK algorithm.We compare its performance for reasoning the consequence of rainstorm with two baseline models—the BN constructed only by expert knowledge elicited from the fuzzy set theory, and the BN constructed only by data learning.
The experimental data were acquired from the investigation reports and news of rainstorm events that occurred in City B in North China in recent 60 years.One event may be divided into multiple cases according to the dif ferent administrative regions involved.In total, 122 rainstorm cases were obtained, each of which was coded by BN variables with discrete values.According to the PCA-bound theory, it is clear that as the number of the cases decreases, the inverse of the error increases quadratically.In this study, we randomly selected 98 cases (80% of all cases) as our training data to learn the data-based BN parameter(D).
Three experts were invited to elicit the expert knowledgebased BN parameter(K).These experts were from the Emergency Management Agency in City B, all of whom had been working for more than 10 years and had extensive experience with rainstorms.Besides, the homogeneity, differences, and opposites of expert knowledge were synthesized through the fuzzy set theory in order to reduce the uncertainty of individual experts.
The other 24 cases were reserved for testing the ef fectiveness of these three BN models.Performance was measured by the results of nine consequence variables, including Node 6 construction sites damage, Node 15 casualties (caused by waterlogging), Node 23 casualties (caused by house collapsing), Node 32 casualties (caused by f looding), Node 37 disrupted living, Node 39 inundation and damage, Node 45 house/farmland/lifeline system damage, Node 49 casualties(caused by geological disasters), and Node 57 casualties(caused by dam break), as shown in the orange nodes in Fig. 3.The performance metrics are overall accuracy of all consequence variables, recall, precision, and F1 score.
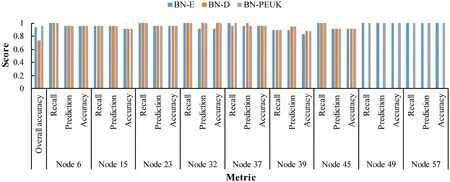
Fig.6 Prediction performance of the 24 testing cases by three Bayesian network (BN) models, BN E , BN D , and BN PEUK
Figure 6 shows the BN models’ prediction performance for 24 testing cases, from which we can draw the following f indings:
(1) BNDperforms the worst in terms of overall accuracy.The results of Node 49 and Node 57 show that it cannot deduce the consequences of the dam break scenario.This is consistent with our expectations since our training data are sparse and there are almost no dam break cases.
(2) In terms of the results of Node 32 and Node 39, BNEperforms slightly worse than the other two BN models.That is because both Node 32 and Node 39 are consequence nodes of the f lood scenario, which is a common secondary event of a rainstorm.There are adequate f lood cases in our training data so that the accuracy of these parameters learned from the data is high.
(3) Overall, BN PEUK performs the best.BN PEUK imbibes advantages of both BN D and BN E while having generalization ability for sparse variables and suf ficient variables at the same time.
4 Scenario Analysis and Discussions
In this section, BNPEUKis used to analyze the ef fectiveness of emergency response measures.Specif ically, for the six disaster chains of the rainstorm considered in this study, we compare the consequences under dif ferent scenarios composed of dif ferent emergency response measures to f ind out the optimal measures to reduce disaster consequences.
4.1 Scenario Analysis
(1) Construction sites waterlogged
In the construction sites waterlogged disaster chain, Node 2 construction sites is the hazard-af fected object, Node 4 construction sites waterlogged is the emergency, Node 3 strengthen drainage facilities and Node 5 drain f loodwater and perform emergency repairs are emergency response measures, and Node 6 construction sites damage is the consequence.By adjusting the states of Node 3 and Node 5 to get dif ferent combinations of emergency response measures, four scenarios of construction sites waterlogged are obtained: S11, S12, S13, and S14.S11 indicates that no emergency response measure is taken, that is, Node 3 = s2 and Node 5 = s2.S12 indicates that the preventive measure,strengthening drainage facilities, is taken while the rescue is not, that is, Node 3 = s1 and Node 5 = s2.S13 indicates that only the rescue measure, draining f loodwater and perform emergency repairs, is taken, that is, Node 3 = s2 and Node 5 = s1.S14 indicates both the precaution and rescue measures are taken, that is, Node 3 = s1 and Node 5 = s1.We analyze the consequences of construction sites damage,that is, the posterior probability of Node 6, that may result from these four scenarios for dif ferent rainstorm risk states,as shown in Fig. 7.
The probability of construction sites damage in S12, S13,and S14 are much lower than that in S11, which means that strengthening drainage facilities and draining f loodwater and perform emergency repairs can ef fectively reduce the impact.When the rainstorm is at the blue/yellow level, the consequence of S12 is better than that of S13, while whenthe rainstorm is at the orange/red level, it is the opposite.That is, in order to reduce the damage of construction sites,precautions should be emphasized when the rainstorm level is low, and rescue measures should be emphasized when the rainstorm level is high.

Fig.7 Probability of construction sites damage
(2) Waterlogging of transportation infrastructure
We adjust the states of Node 8, Node 10, Node 12, and Node 14 and generate eight scenarios of waterlogging of transportation infrastructure, S21–S28.S21 indicates that no emergency response measure is taken.S22, S23, and S24 represent that some precautions are taken while rescue measure is not.S25, S26, and S27 represent that some rescue measures are taken while precaution is not.S28 indicates all precautions and rescue measures are taken.The consequences of these scenarios are shown in Fig. 8.Compared with the baseline scenario S21, the probability of casualties caused by waterlogging in S22–S24 is reduced, but not obvious,while that in S25–S27 is signif icantly reduced.It implies that preventive measures like dredging drainage lines and issuing traf fic warnings can have some ef fects, however, due to the necessary travel needs like commuting, the traf fic risk still exists, resulting in the risk of vehicle trapped and casualties.In these scenarios, rescue measures like draining f loodwater and controlling traf fic and rescuing trapped people in time should be enhanced in particular.
(3) Houses f looded and collapsed
Seven scenarios, S31–S37, are generated for this disaster chain, by adjusting the states of Node 17, Node 19, Node 20, and Node 22.S31 indicates that no emergency response measure is taken.S32, S33, and S34 respectively represent that one kind of precaution is taken.S35 represents that the rescue measure is taken and S36 represents that all precautions are taken.S37 indicates that all precautions and rescue measures are taken.The consequences of these scenarios are shown in Fig. 9.The probability of casualties caused by house collapse in S32 and S33 is reduced compared with that in S31, which means precautions like eliminating hidden troubles, reinforcing houses, repairing houses, and removing stagnant water play a constructive role.Moreover, the probability of casualties in S34 is most signif icantly reduced.That is, evacuating and resettling people is the most ef fective measure to be implemented in house collapse scenarios.
(4) Flooding
For f looding, there are three kinds of consequences: casualties, disrupted living, and inundation and damage of houses,farmland, roads, and bridges.We construct scenarios for each consequence and obtain 18 scenarios in total, as shown in Figs. 10, 11, and 12.Of the 7 scenarios in Fig. 10, S41 is the baseline scenario, that is, no emergency response measure is taken.S42, S43, S44, and S45 are each with one of the four emergency response measures taken: dredgingand patrol, regulating f lood and block crevasse, evacuating and resettling people, and timely rescue and treatment.S46 is with three precaution measures, and S47 is with all measures.By comparing the results of S42–S45, it can be seen that the probability of casualties in S45 is signif icantly reduced compared with the baseline scenario S41, followed by S44, S43, and f inally S42.That is, timely rescue is the most ef fective measure to decrease f lood-induced injury and death, followed by evacuating people.For disrupted living,the consequence in S412 is signif icantly lighter (see Fig. 11),which means that communicating with the af fected residents is ef fective.The probability of house/farmland/road/bridge damage in S415 is reduced signif icantly (see Fig. 12), which implies that performing emergency repairs should be emphasized under this circumstance.
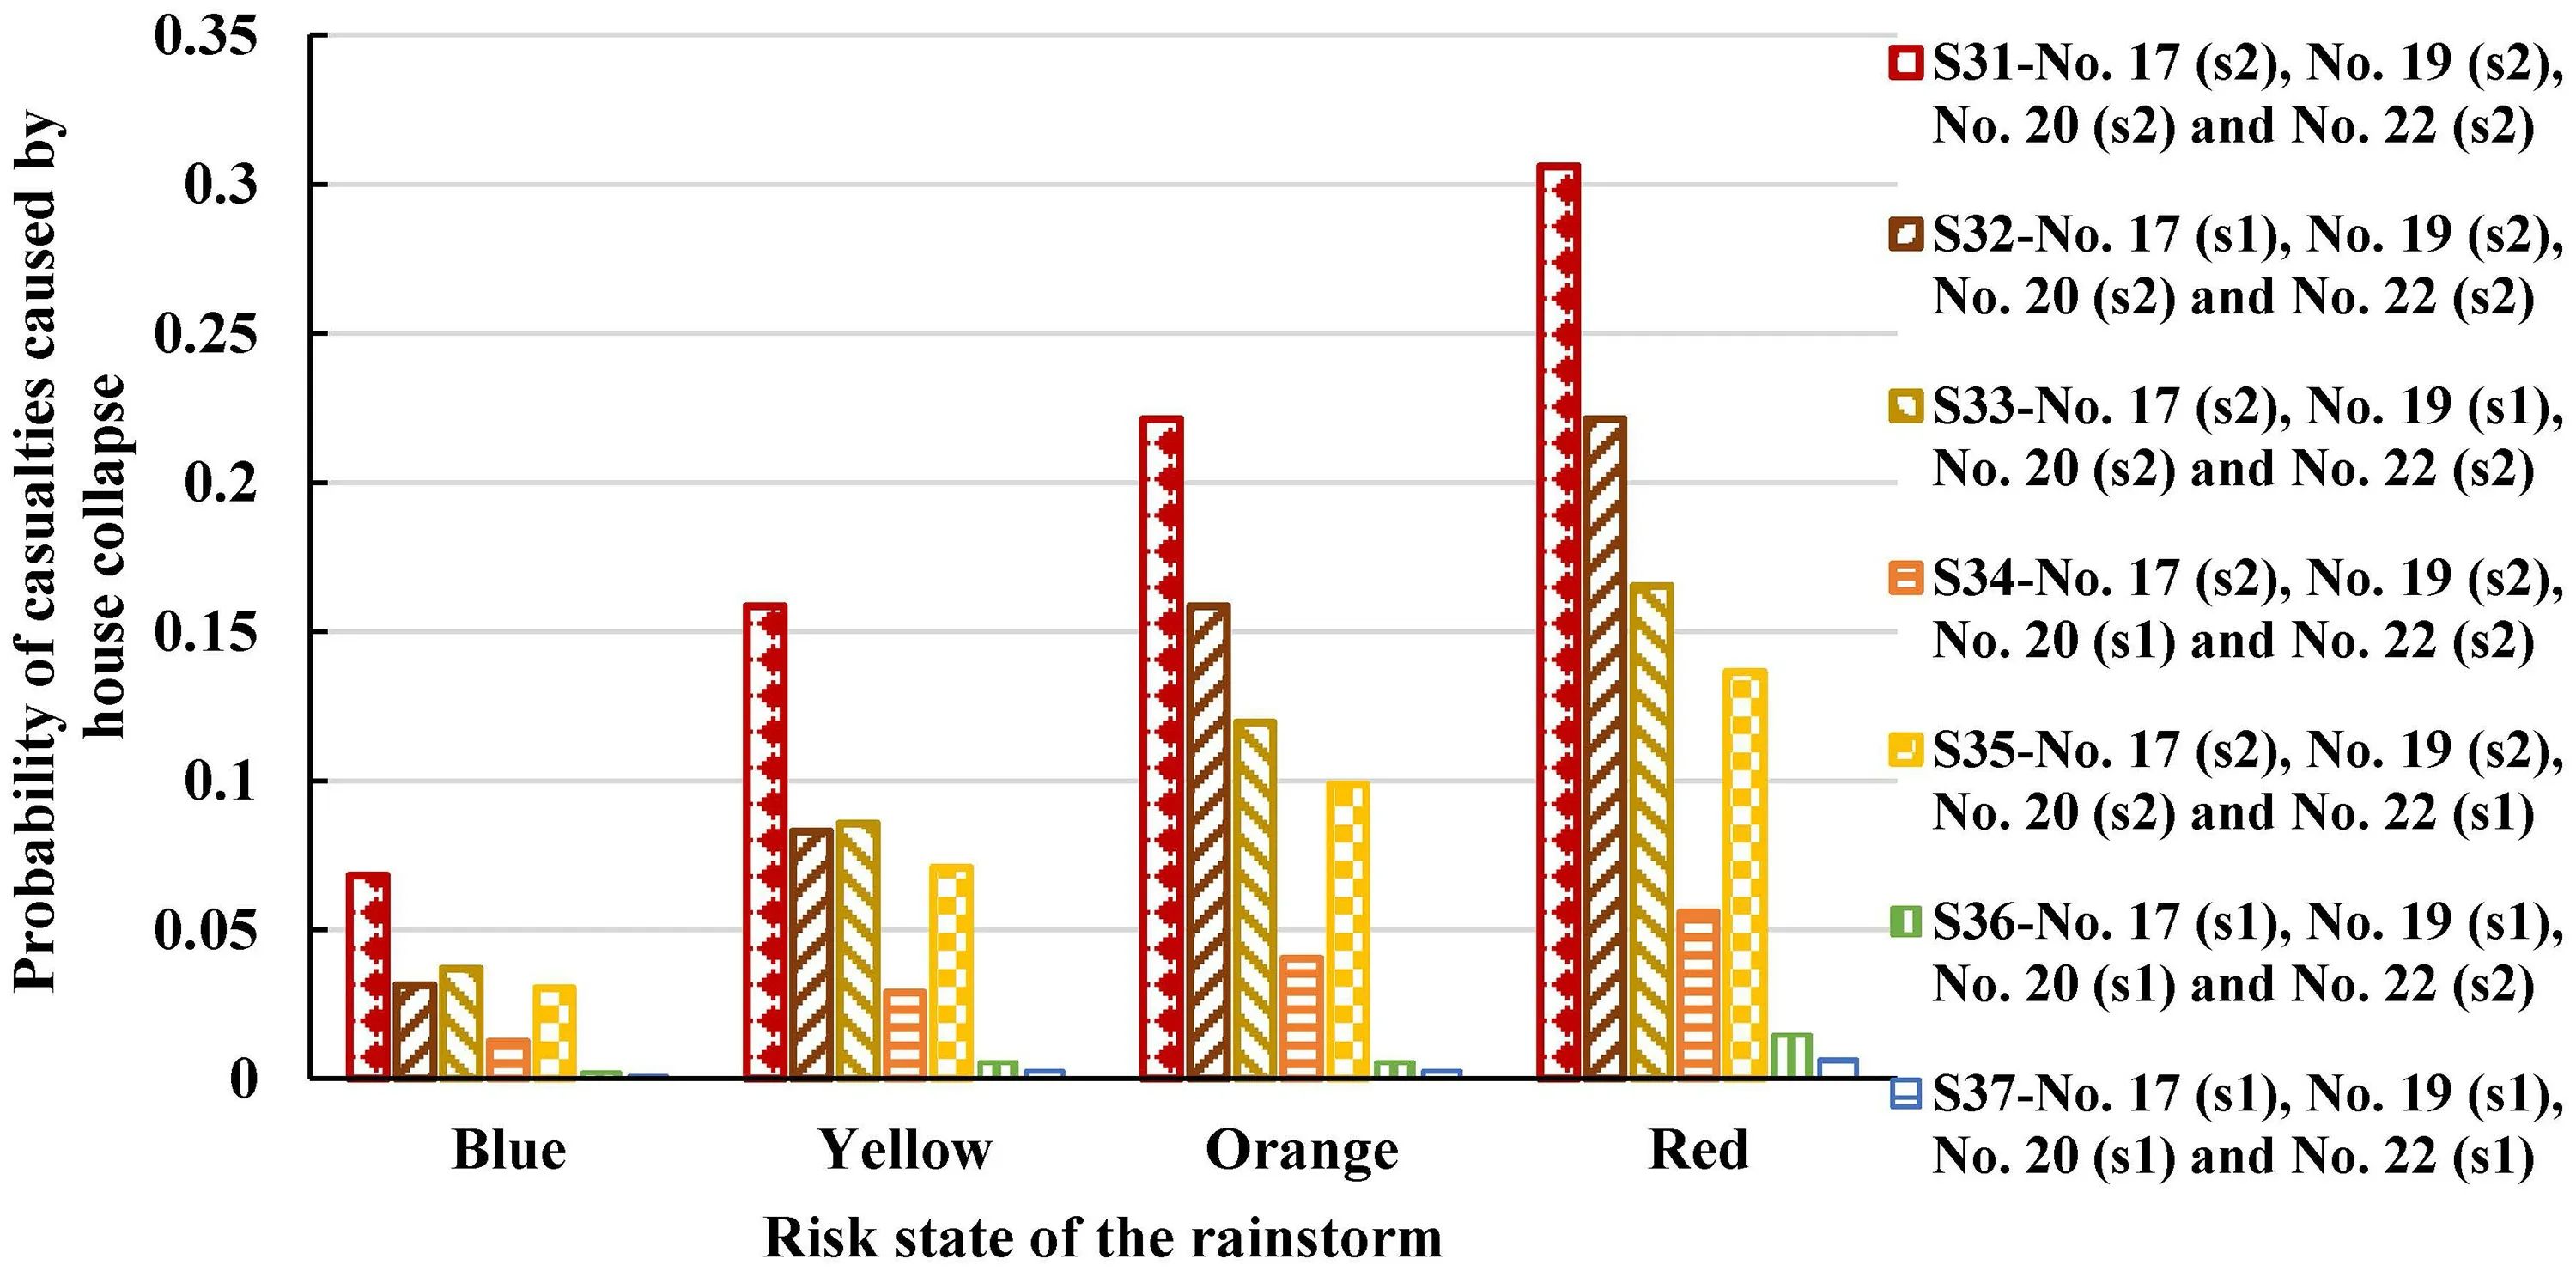
Fig.9 Probability of casualties caused by house collapse
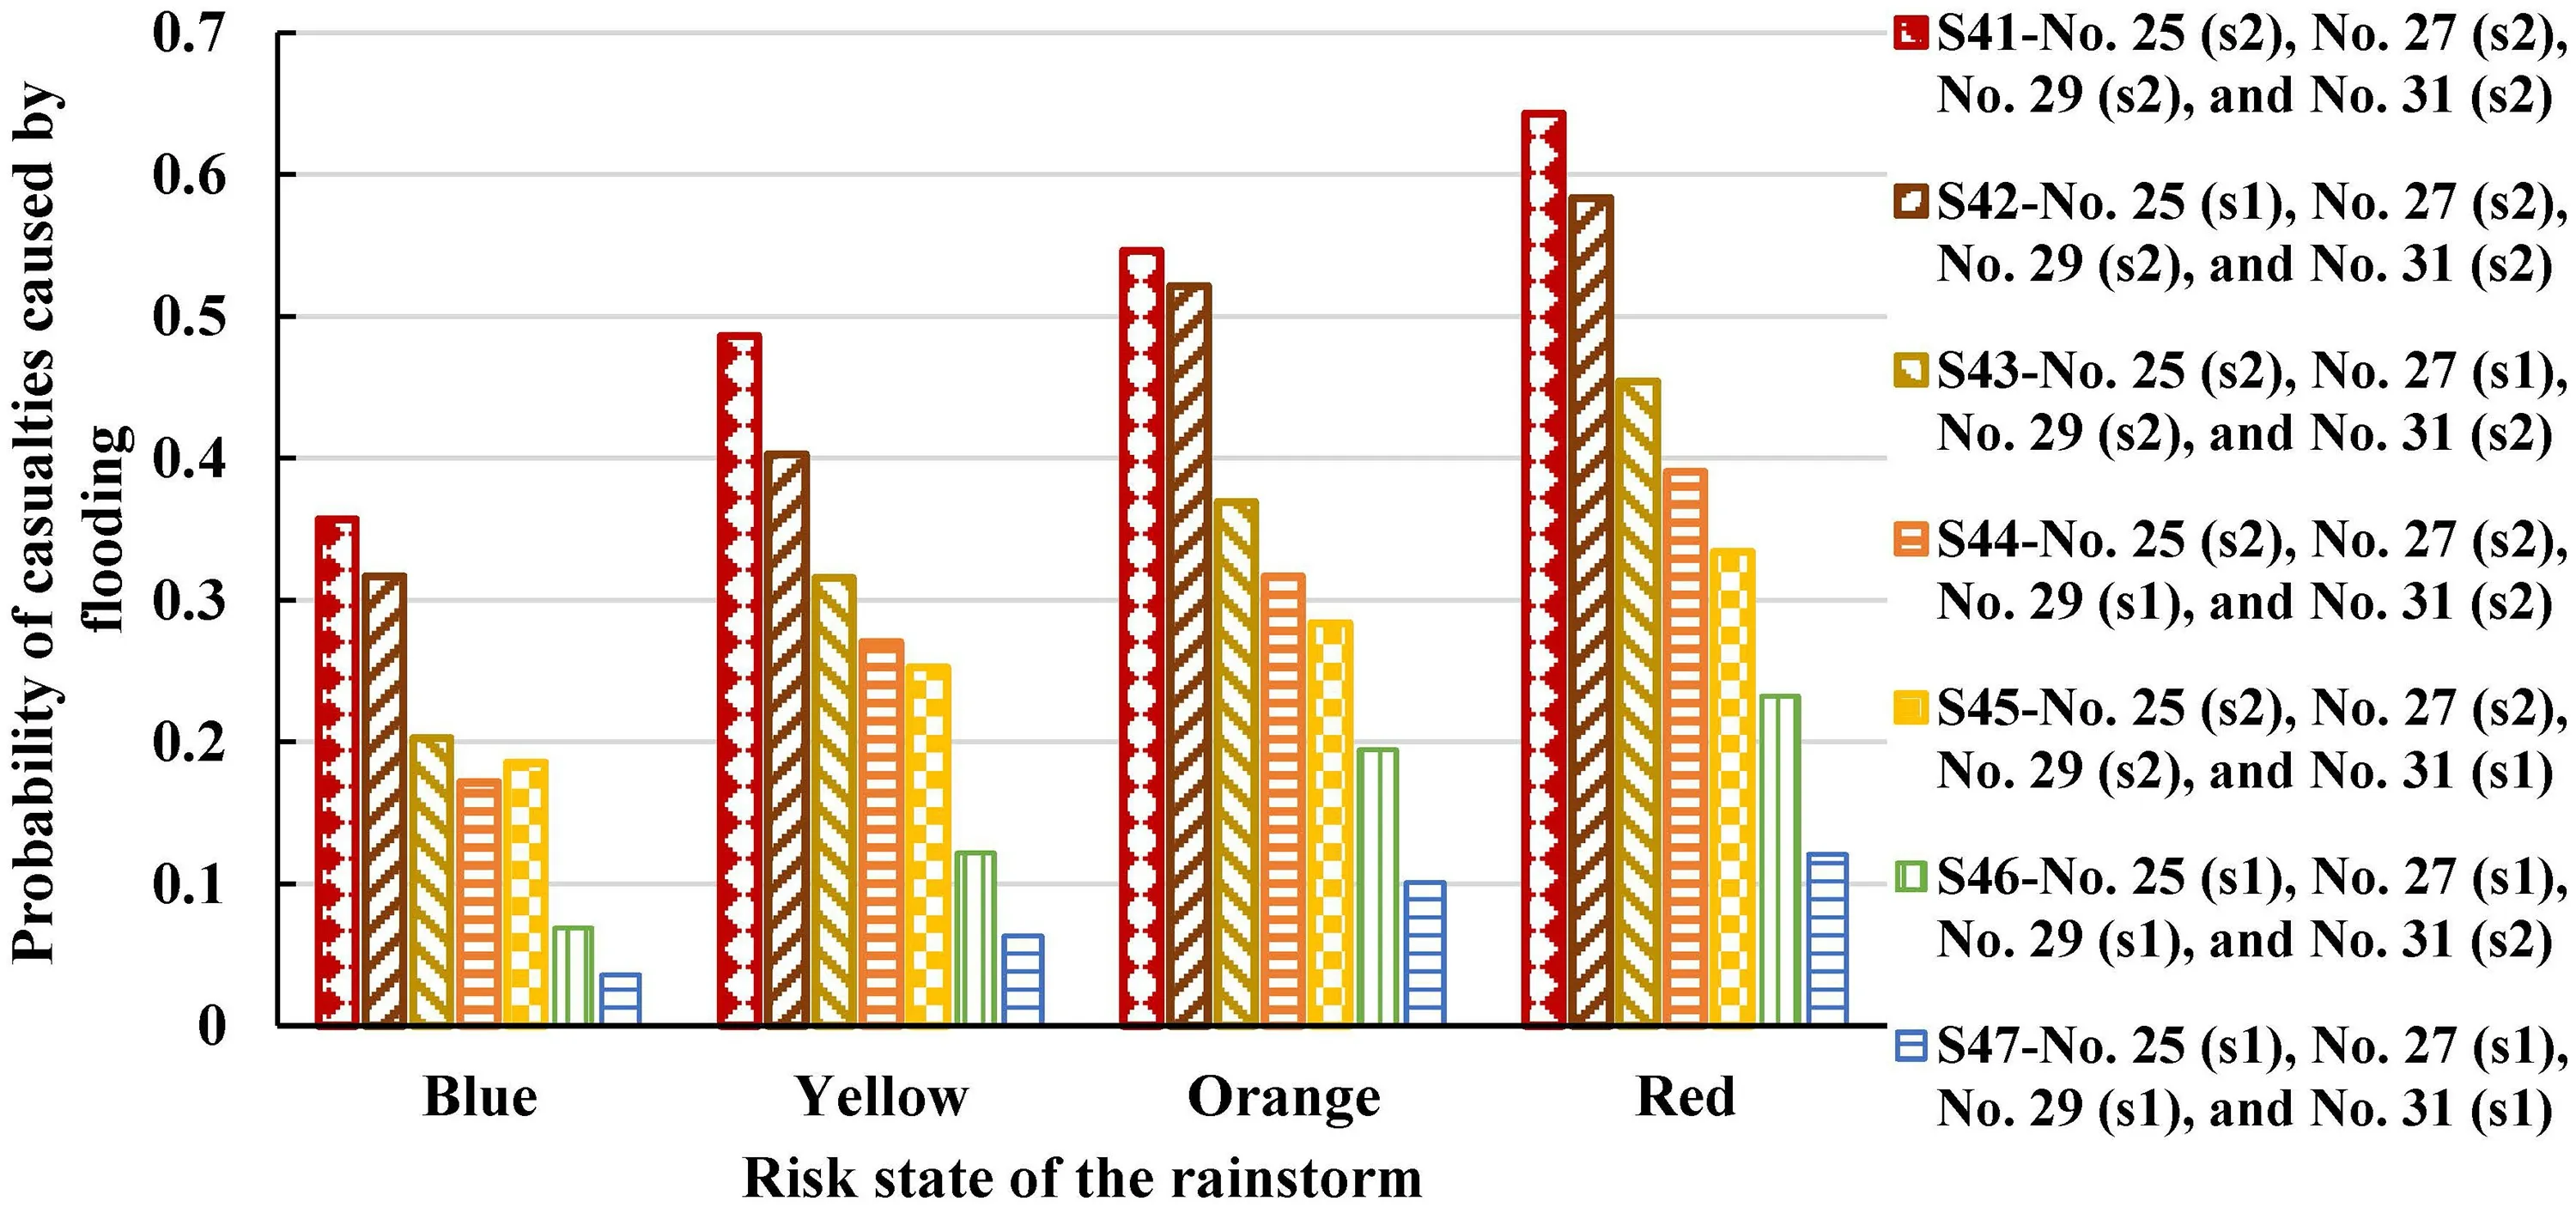
Fig.10 Probability of casualties caused by f looding

Fig.11 Probability of disrupted living
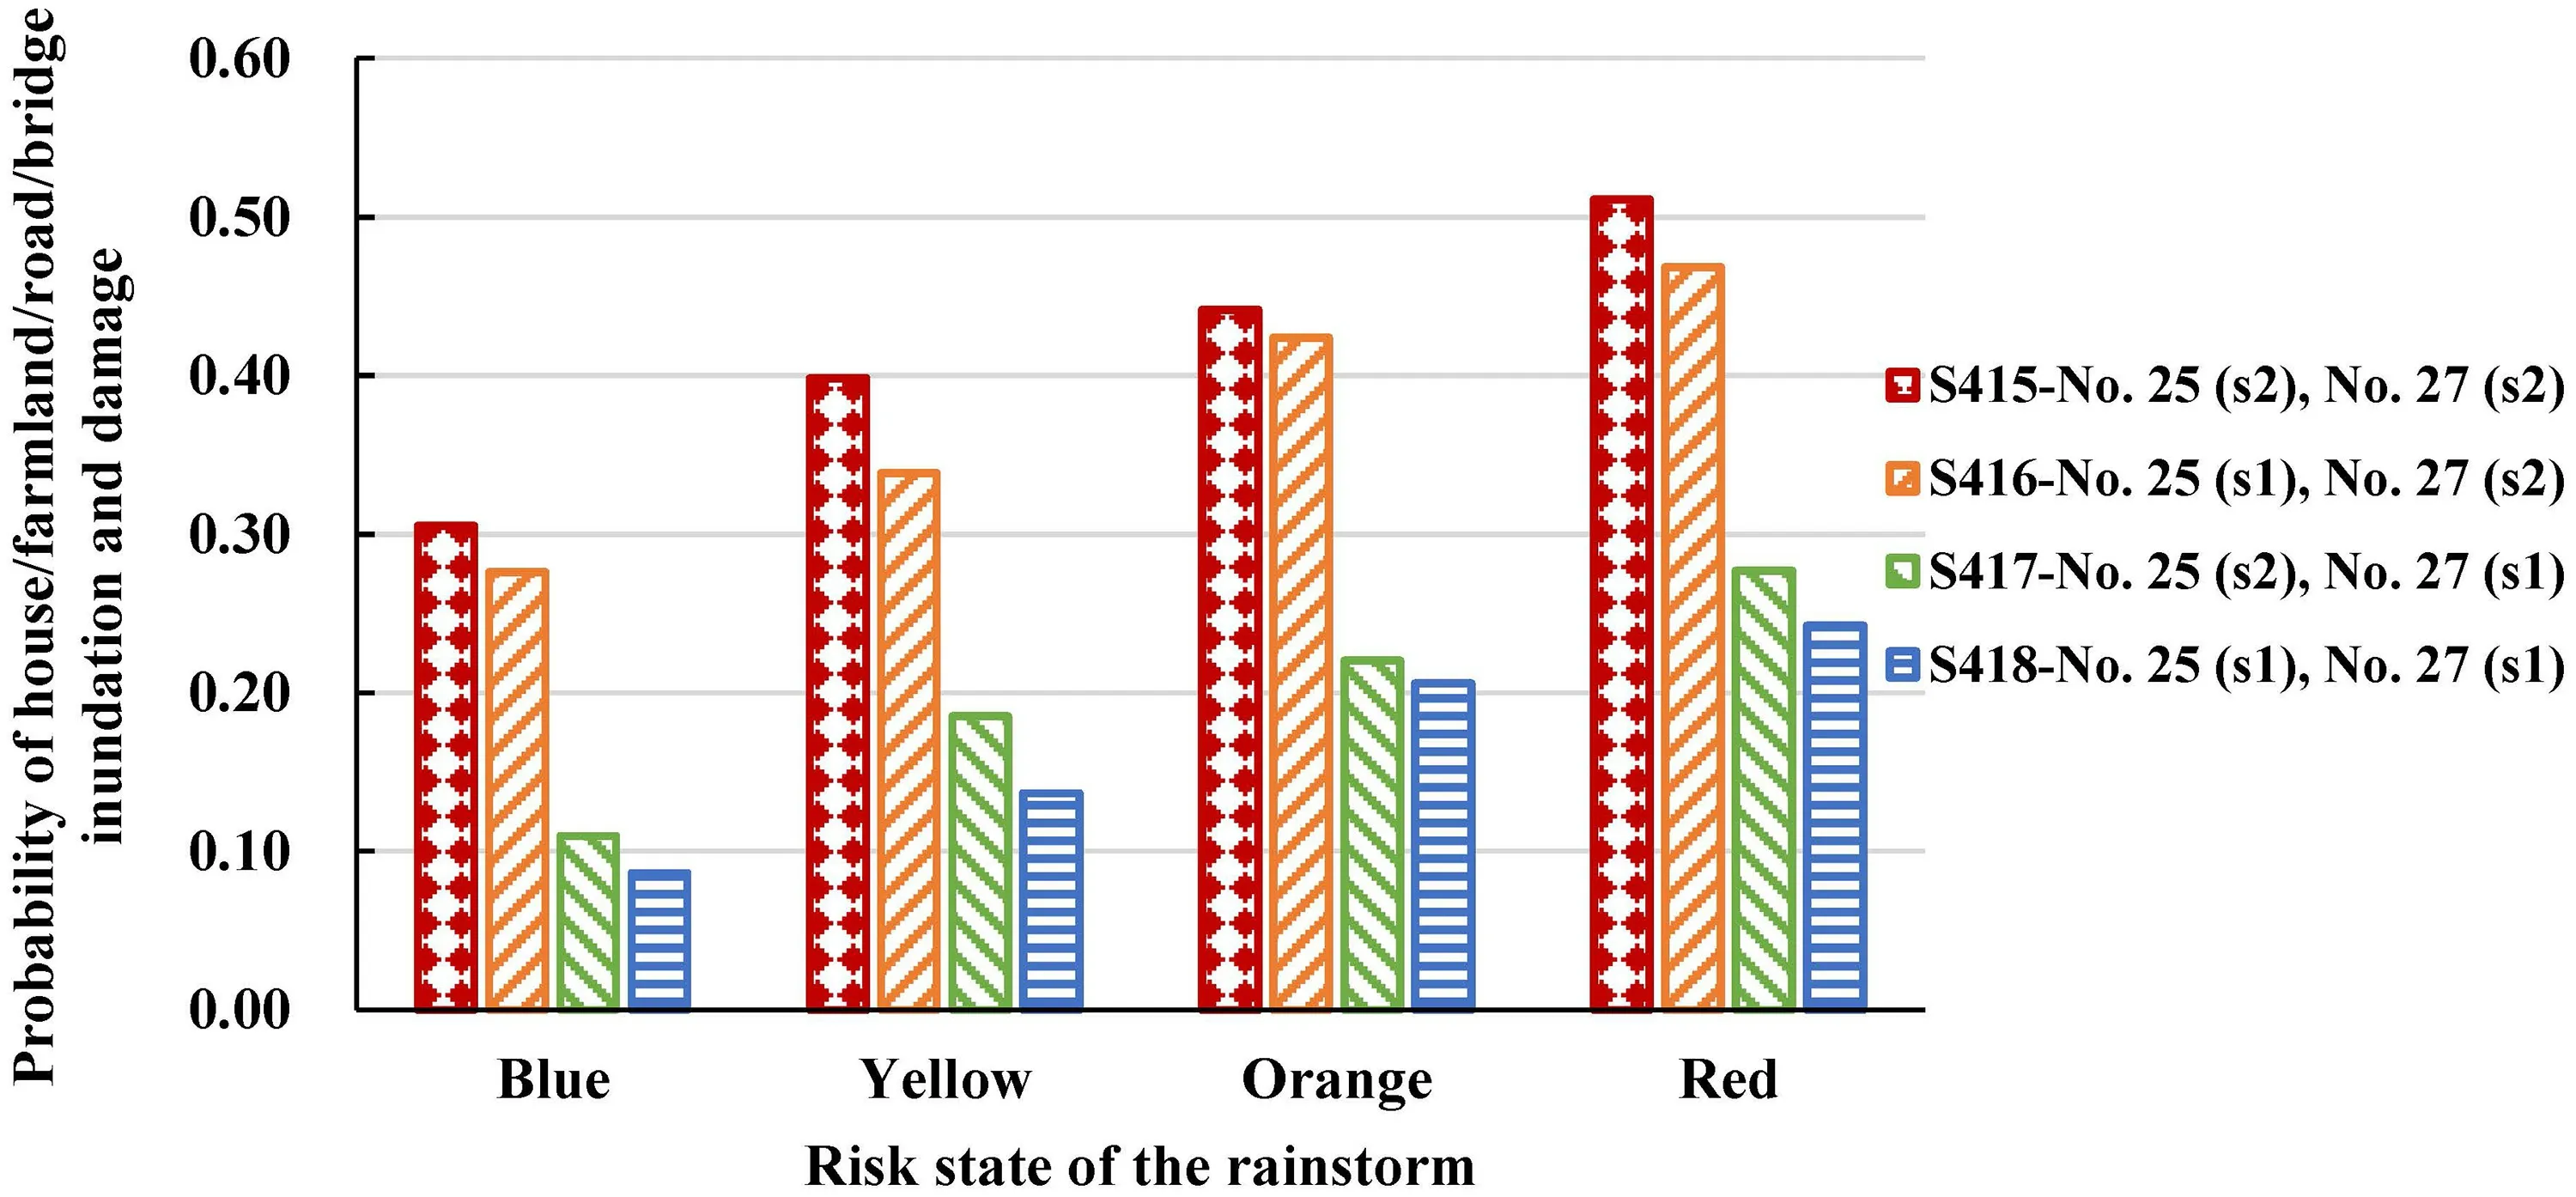
Fig.12 Probability of house/farmland/road/bridge inundation and damage
(5) Geological disasters
There are two kinds of consequences of geological disasters:house/farmland/lifeline system damage and casualties.For each consequence, through adjusting the states of Node 41,Node 43, Node 46, and Node 48, 11 scenarios are generated, as shown in Figs. 13 and 14.When the rainstorm is at the blue/yellow level, the consequence of S52 and S56 is better than that of S53 and S57, while when the rainstorm is at the orange/red level, it is the opposite.That is, in order to reduce the damage of geological disasters, water content monitoring, slope displacement monitoring, patrol, and protection should be emphasized when the rainstorm level is low, and disaster investigation and management should be emphasized when the rainstorm level is high.Another noteworthy fact is that the probability of casualties in S59 does not decrease signif icantly as that in S58, which means that rescuing victims is not very ef fective.As rainstorminduced geological disasters usually occur in remote areas,once people are trapped, it is dif ficult to rescue in time, so early warning and evacuation are more important.
(6) Dam break
Generally, the probability of dam break events is very low.Here we assume that the rainstorm occurs in a mining areaor tailings pond (Node 50 is set to s2).By adjusting the states of precaution nodes (Node 51 and Node 53) and rescue nodes (Node 54 and Node 56), eight scenarios (S61–S68)are obtained.The consequences of these scenarios are shown in Fig. 15.It can be seen that the probability of casualties in S62, S63, and S64 is reduced more signif icantly than in others.This shows that precautions like identifying hidden dangers, inspecting dredging and f lood discharge facilities,monitoring, early warning, and transferring people in time should be implemented in dam break scenarios.

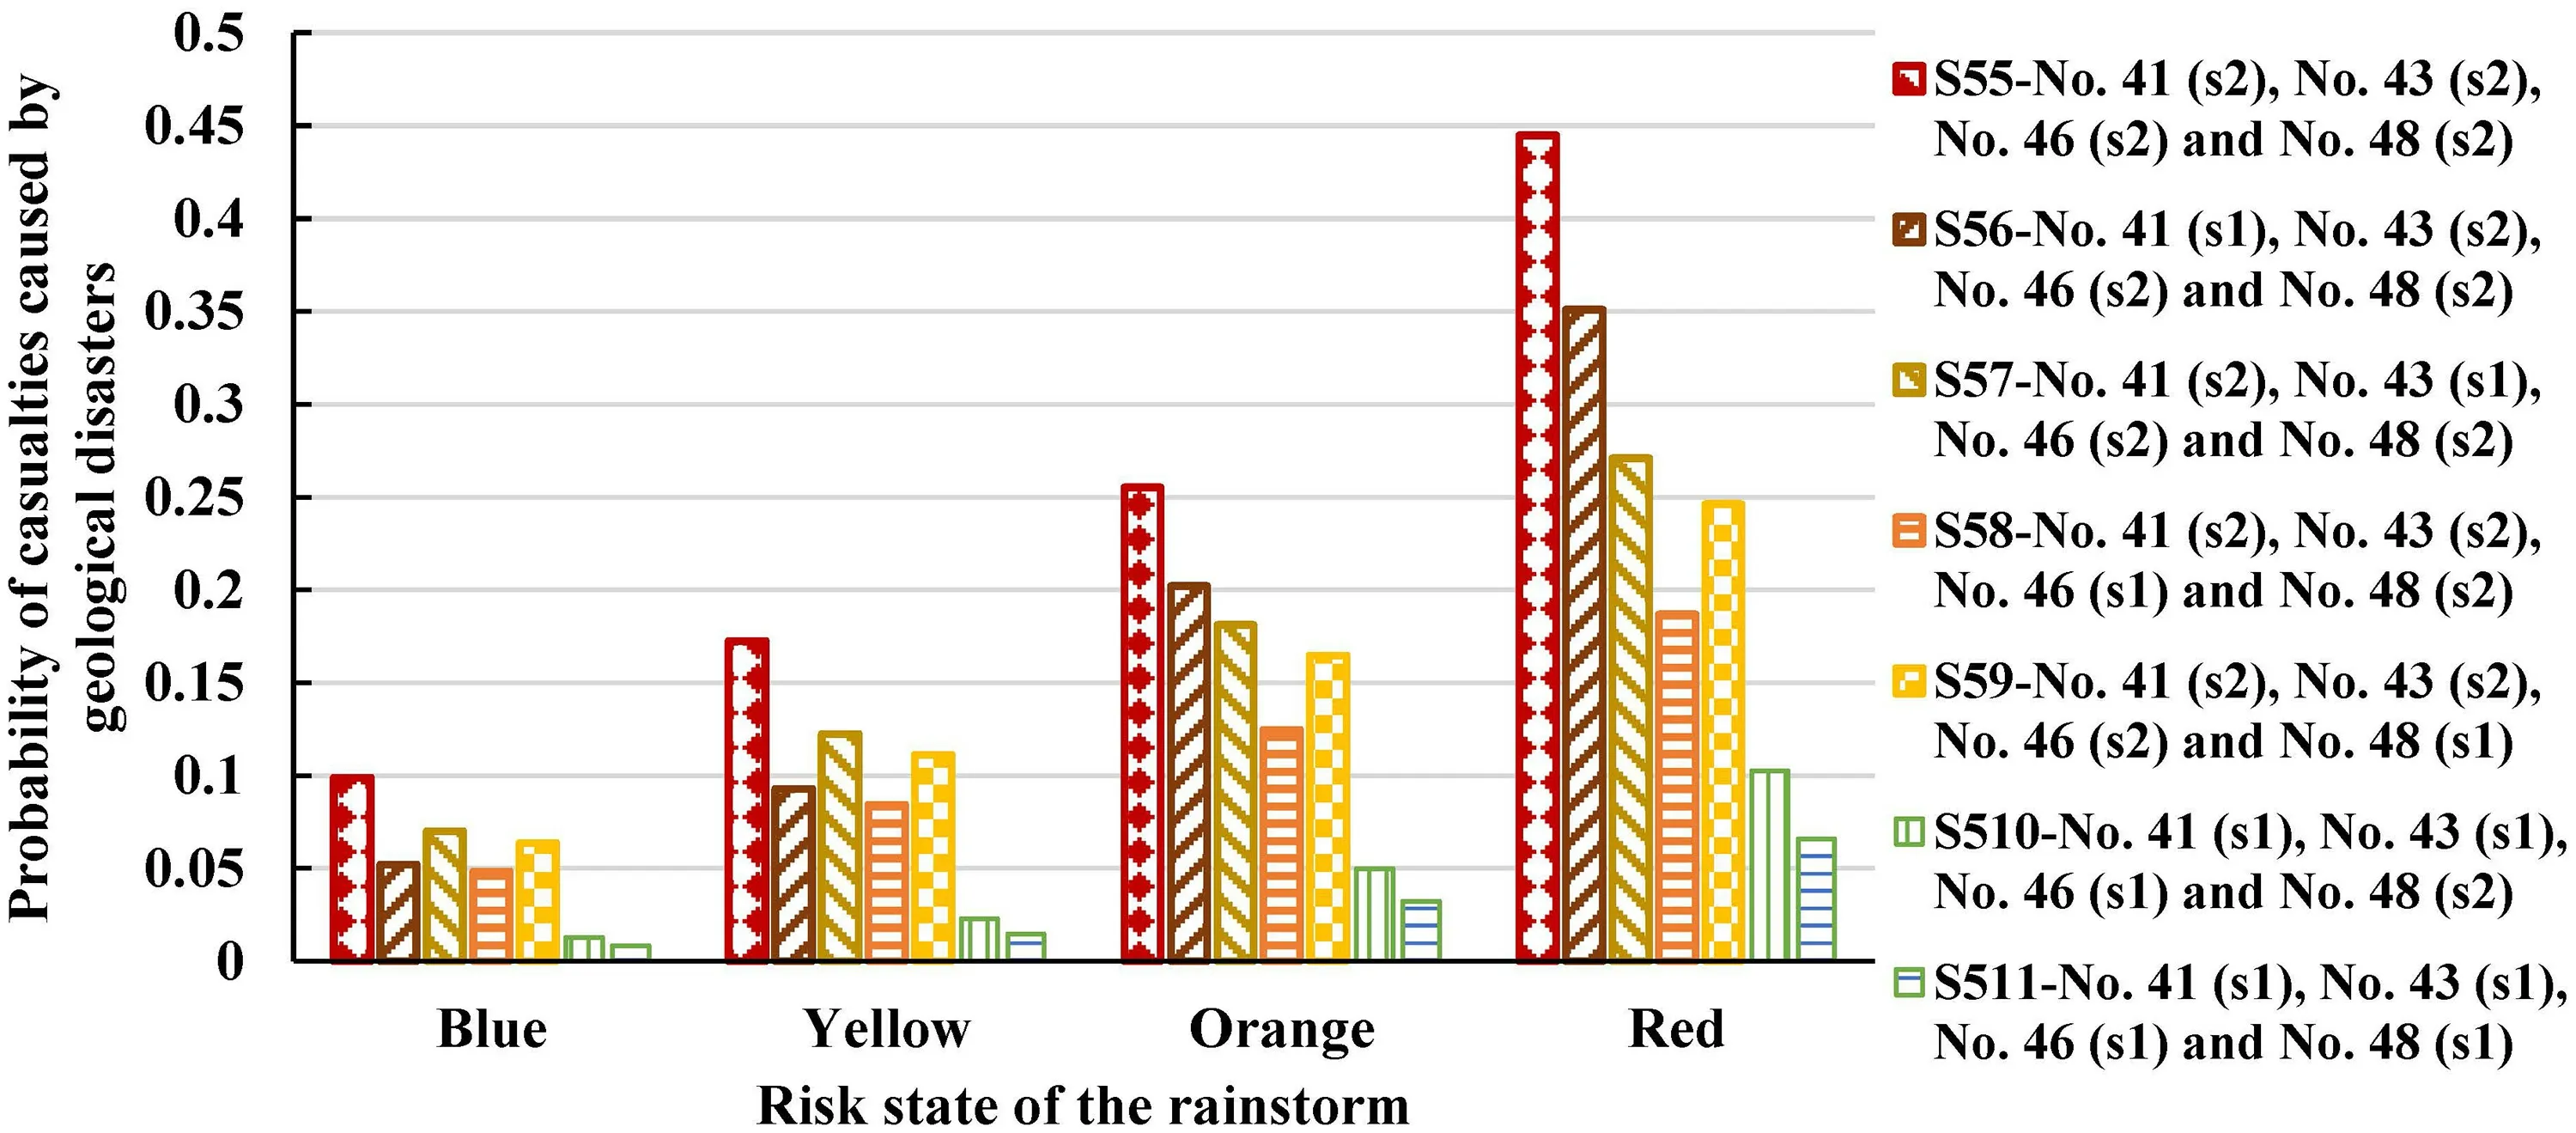
Fig.14 Probability of casualties caused by geological disasters
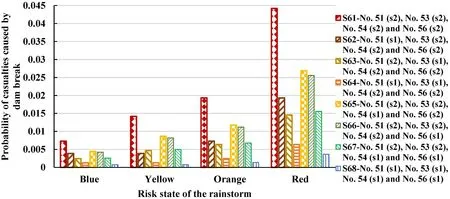
Fig.15 Probability of casualties caused by dam break
4.2 Result Analysis and Discussion
Through the scenario analysis, the following conclusions can be drawn.
(1) In order to reduce casualties, it is very important to transfer people and carry out a rescue ef fort in time.For waterlogging, draining, controlling traf fic, and rescuing in time should be implemented; For house collapse,geological disaster, and dam break, early warning and timely transfer of people are needed.
(2) To reduce the damage of construction sites and infrastructures, when the rainstorm level is low, it is particularly important to strengthen preventive measures like regulating f lood, eliminating hidden troubles, and reinforcing houses and pipelines; When the rainstorm level is high, rescue measures like performing emergency repairs are particularly important.
(3) In order to reduce the impact on people’s living, it is necessary to communicate with the af fected residents and take safety measures.
To further verify the validity of the method, we take f ive typical rainstorms as examples to compare the dif ferences between the predicted and actual results, as shown in Fig. 16 a.It can be concluded that the estimated results based on BN are basically consistent with the actual results,which proves that the proposed method is of great theoretical and practical signif icance for emergency management decision makers to grasp the overall situation of the rainstorm, identify the key nodes, and take emergency response measures in time.By regulating the response node status of the f ive storm disaster BN networks, it is analyzed that if all the emergency response measures are in place during each rainstorm response, there is some room for further reduction in the consequences and losses, as shown in Fig. 16 b.For example, in response to Case 1, if all af fected residents are transferred and timely rescue and treatment measures are taken, then the probability of casualties will be reduced from 15.5 to 1.12%; in response to Case 3, if all the drainage capacities are pre-positioned in place and water is pumped out in a timely manner, then the probability of waterlogging on roads will be reduced from 30.8 to 19.6%.Although these estimated values are not entirely accurate, they do indicate to some extent that the emergency response strategy can still be further optimized.
The scenario reasoning method proposed in this study can be used for strategy optimization in the rescue process of rainstorms as well as emergency drills.However, it still has limitations.In our constructed BN model, the discretization of parameter values is relatively simple, and only the presence or absence of most emergency response measures is considered, so only qualitative strategy suggestions can be given, which cannot be quantif ied.Besides, all the cases and experts in this study are from City B, leading to the limitation that our established BN model is only suitable for City B and some parameters may have to be adapted if applied to other cities.
5 Conclusion
The complexity and uncertainty of disaster chains bring about the dif ficulty of quickly making the most appropriate emergency decisions depending entirely on expert knowledge.To address this issue, a scenario-based decision approach is a good choice.In this study, we proposed a Bayesian network-based scenario reasoning method for disaster chains.The graphical nature of BN representation enables the interacting relationships among key factors to be easily understood by emergency decision makers, and it can capture the uncertainty of the model and provide an almost real-time scenario reasoning procedure.To overcome the bottleneck of BN parameter learning, we proposed the PEUK algorithm, which applies the maximum entropy principle to combine data learning and expert knowledge.Compared with the classical MAP algorithm and the direct expert opinion elicitation approach, our proposed PEUK approach performs the best in disaster consequence reasoning.Rainstorm events are taken as an example to show the process of model construction and scenario analysis.The results show that our approach with BN has important theoretical and practical signif icance for emergency decision makers to understand the overall situation of rainstorm disaster chains,identify key nodes, and take emergency response measures in time.
Further research can be carried out from two aspects.First, a disaster such as a rainstorm is unevenly distributed in time and space, which suggests that we can divide the administrative region into f iner spatial grids, consider the evolution of disasters in dif ferent periods, and then carry out multi-objective dynamic decision making.Second, more disaster cases should be collected to modify the CPTs, so as to make the BN network more scientif ic and better guide practice.
AcknowledgmentsThis work was supported by the National Key Research and Development Program of China (Grant No.2021YFF0600400) and the National Natural Science Foundation of China (Grant Nos.72104123, 72004113).
Open AccessThis article is licensed under a Creative Commons Attribution 4.0 International License, which permits use, sharing, adaptation, distribution and reproduction in any medium or format, as long as you give appropriate credit to the original author(s) and the source,provide a link to the Creative Commons licence, and indicate if changes were made.The images or other third party material in this article are included in the article's Creative Commons licence, unless indicated otherwise in a credit line to the material.If material is not included in the article's Creative Commons licence and your intended use is not permitted by statutory regulation or exceeds the permitted use, you will need to obtain permission directly from the copyright holder.To view a copy of this licence, visit http:// creat iveco mmons.org/ licen ses/ by/4.0/.
杂志排行
International Journal of Disaster Risk Science的其它文章
- The 2023 Earthquake in Türkiye and Implications for China’s Response to Catastrophe
- A Two-Stage Evolutionary Game Model for Collaborative Emergency Management Between Local Governments and Enterprises
- A Generalized Accelerated Failure Time Model to Predict Restoration Time from Power Outages
- The Dynamics of Interorganizational Collaboration in Disaster Management: A Network Study Based on Flood Disasters in China
- Identify Landslide Precursors from Time Series InSAR Results
- A Deep Learning Application for Building Damage Assessment Using Ultra-High-Resolution Remote Sensing Imagery in Turkey Earthquake
