A Generalized Accelerated Failure Time Model to Predict Restoration Time from Power Outages
2023-02-26TasnubaBinteJamalSamiulHasan
Tasnuba Binte Jamal · Samiul Hasan
Abstract Major disasters such as wildf ire, tornado, hurricane, tropical storm, and f looding cause disruptions in infrastructure systems such as power and water supply, wastewater management, telecommunication, and transportation facilities.Disruptions in electricity infrastructure have negative impacts on sectors throughout a region, including education, medical services,f inancial services, and recreation.In this study, we introduced a novel approach to investigate the factors that can be associated with longer restoration time of power service after a hurricane.Considering restoration time as the dependent variable and using a comprehensive set of county-level data, we estimated a generalized accelerated failure time (GAFT) model that accounts for spatial dependence among observations for time to event data.The model f it improved by 12% after considering the ef fects of spatial correlation in time to event data.Using the GAFT model and Hurricane Irma’s impact on Florida as a case study, we examined: (1) dif ferences in electric power outages and restoration rates among dif ferent types of power companies—investor-owned power companies, rural and municipal cooperatives; (2) the relationship between the duration of power outage and power system variables; and (3) the relationship between the duration of power outage and socioeconomic attributes.The f indings of this study indicate that counties with a higher percentage of customers served by investor-owned electric companies and lower median household income faced power outage for a longer time.This study identif ied the key factors to predict restoration time of hurricane-induced power outages, allowing disaster management agencies to adopt strategies required for restoration process.
Keywords Generalized accelerated failure time model · Hurricanes · Investor-owned power companies · Median income ·Power outage · Restoration time
1 Introduction
Hurricanes have become more frequent and intense due to global climate change.Hurricane induced damages have signif icantly increased because of high wind intensities when some major hurricanes made landfalls in recent years(Grenier et al.2020).For instance, Hurricane Irma caused a damage of about USD 50 billion (Cangialosi et al.2017)and signif icant disruptions in infrastructure systems.After Hurricane Irma, more than 6.2 million customers lost power including 850,000 customers from Orange, Seminole, Lake,and Osceola Counties in Florida (Gillespie et al.2017).Similarly, 8.5 million customers lost power during Hurricane Sandy (Alemazkoor et al.2020).Sustained winds and excessive amount of precipitation/f looding during hurricanes cause disruptions to infrastructure systems such as power outage, disruptions in water supply and wastewater systems,telecommunication failures, and transportation system disruptions.Local communities depend on these systems to a great extent and failures in such infrastructure systems highly af fect their daily activities.
Infrastructure systems have become highly interconnected and interdependent (Rinaldi et al.2001; Graf ius et al.2020).After Hurricane Sandy, damages in electricity stations signif icantly af fected the functions of transportation facilities(Haraguchi and Kim 2016).Power outages hampered the restoration of subway services in New York City as trains could not run without power restoration.Due to the interconnected and interdependent relationships among infrastructure systems, the restoration process of a system is further delayed when other systems are disrupted.As a result, infrastructure services are unavailable, impacting the quality of life of the population served.Among all types of infrastructure disruptions, a disruption in the electricity power infrastructure is the most signif icant one.Power outages have signif icant negative impacts on a region across dif ferent sectors such as f inancial, business, education, medical services, and recreation (Koks et al.2019; Kuntke et al.2022).
To enhance community resilience against an extreme event, faster restoration from power outages is necessary for recovery ef forts.For this reason, six steps are proposed for power restoration process including restoration at power plants, at transmission lines, at substations, for essential services, in large service areas, and at individual home (Edison Electric Institute 2019).To date, most of the works in infrastructure disruption network analysis and modeling frameworks have involved the f irst three steps (Ouyang and Wang 2015).However, a holistic approach for the restoration process at the last two steps (restoration in large service areas and at individual home) is essential to understand power disruption patterns and durations at regional and household levels.
Previous studies have investigated the durations of power outages after hurricanes at a regional level.Liu et al.( 2007)applied an accelerated failure time (AFT) model to understand restoration time of power outage.While this approach provides useful insights for time to event data analysis, it ignores spatial clustering of restoration time for power outage.To mitigate this problem, Mitsova et al.( 2018) applied a spatial autoregressive (SAR) model to understand restoration time of power outage at a county level.While this model considers the spatial autocorrelation among observations,it does not provide useful insights for time to event data analysis.The overall restoration time of power outages can be explained by a set of readily accessible independent variables using a generalized accelerated failure time (GAFT)model that allows both time to event data analysis and spatial autocorrelation (non-independence of the observations)(Zhou et al.2020).
In this study, we investigated the spatial extent and correlation of restoration time of electricity disruptions across dif ferent counties after a hurricane by applying a spatial clustering approach.We also developed a statistical model(the GAFT model) considering a range of variables including hazard, the built environment, and sociodemographic characteristics to identify the factors associated with longer restoration time for power outage at a county level after a hurricane.If restoration time can be reliably predicted,households may plan for alternatives of existing power services during disruptions.At the same time, when policymakers and stakeholders better understand the factors associated with longer disruptions, they can allocate resources to manage restoration processes, reduce restoration time, and mitigate the negative impacts of longer restoration times from power outages.In areas that are likely to have power outages for a long time, backup power plants and microgrids can be installed (Kwasinski 2010; Mishra et al.2020).Our study has the following contributions:
• We investigated the spatial distribution of restoration time of electricity disruption of a region during a hurricane using a statistical clustering approach.
• We developed generalized accelerated failure time(GAFT)—a statistical model—to investigate the association between restoration time of power outage and a wide range of variables including hazard, built environment factors, and sociodemographic characteristics of the regions accounting for spatial dependence of observations.While power outage has been studied from the perspective of time to event data analysis (Liu et al.2007)and considering the spatial dependence of observations(Mitsova et al.2018), we add a new dimension by developing the GAFT model that can account both for time to event data and spatial dependence of observations.
2 Literature Review
Infrastructure systems are highly interconnected and interdependent and disruption in one system signif icantly af fects other systems (Rinaldi et al.2001; Hasan and Foliente 2015; Graf ius et al.2020).In recent times, there has been an increased interest in studying the impact of power outage on the performance of other infrastructure systems after extreme events and how to enhance the resilience of such interdependent systems.
For instance, previous studies focused on power–water network disruptions for natural hazards and suggested possible solutions to ensure a resilient power–water distribution system after a hurricane (Almoghathawi et al.2019; Najaf i et al.2019, Najaf i et al.2020; Kong et al.2021).Disruptions in electricity and petroleum infrastructures had negative impacts on health care services and public transportation systems in the New York metropolitan area after Hurricane Sandy (Haraguchi and Kim 2016).Traf fic congestion increased three to four times due to the power outages after Hurricane Isaac (Miles and Jagielo 2014).Previous studies developed models to assess the resilience of interdependent traf fic-power systems and to determine the parameters to quantify the resilience of transportation systems against hurricanes and other natural hazards and disasters (Kocatepe et al.2018; Ahmed and Dey 2020; Zou and Chen 2020).Zou and Chen ( 2020) proposed strategies to improve the resilience of traf fic-power systems against a hurricane.Ouyang and Wang ( 2015) modeled for the resilience optimization of interdependent infrastructures.The consequences of the interdependencies in infrastructure failures starting from a given outage were analyzed by considering severity, duration, spatial extent, and the number of people af fected by a disruption (Mcdaniels et al.2007).Kong et al.( 2021) calculated the infrastructure ef ficiency by removing dif ferent percentage of nodes in the system for both power and water systems.Previous studies also investigated the societal, mental, and economic impacts of power disruption (Dargin and Mostafavi 2020; Stock et al.2021) along with interdependency analysis among the infrastructure systems.Studies have explored recovery strategies and ef ficiency (Ge et al.2019;Loggins et al.2019) as well.
Most of the above studies considered infrastructure disruptions at an infrastructure facility level, analyzing how a disruption in an electric power plant af fects a water treatment plant or water distribution systems, or a gas station after a disaster.These studies focused on the restoration at power plants, transmission lines, and substations.Also, these studies focused on the impact of power outage.For example, previous research mainly focused on how and to what extent other facilities are disrupted when an extreme event takes place causing power outages in a region.Few studies investigated power service disruptions at a local (for example, county) level and the time required for the restoration process.Restoration time from power outages needs more attention along with impact analysis at a local scale.
Researchers have developed models to identify the contributing factors toward power outage following a disaster.Liu et al.( 2007) developed an accelerated failure time (AFT)model for determining the time required for the restoration of power outage after an extreme hazard, considering hurricane and snowstorm.Nateghi et al.( 2011) compared dif ferent models such as accelerated failure time model, Cox proportional hazard model, regression trees, Bayesian additive regression trees (BART), and multivariate additive regression splines and found that BART performs the best.Models based on various Geographic Information System databases were developed to determine where outages are most likely to occur by Liu et al.( 2005).Han et al.( 2009) considered hurricane characteristics, land cover, and power system data to analyze the number of outages and spatial distribution of the power outages using negative binomial generalized linear model for the Gulf Coast region of the United States.Quiring et al.( 2011) included soil characteristics and suggested that these variables can implicitly inform about the likelihood of trees being uprooted.McRoberts et al.( 2018)showed that the inclusion of elevation, land cover, soil,precipitation, and vegetation characteristics improved the accuracy of previously established statistical model by 17%.However, sociodemographic characteristics and social vulnerability of population were not considered in these studies.Dargin and Mostafavi ( 2020) considered sociodemographic factors of a community and identif ied which group of people were af fected mostly from well-being perspectives due to various infrastructure disruptions after Hurricane Harvey.However, the spatial distribution of the recovery process for a particular disruption, such as which group of people faced longer disruption, was not considered.
Socioeconomic and sociodemographic characteristics of the af fected regions were considered in previous research.Mitsova et al.( 2019) considered characteristics such as age, gender, race, housing tenure, education, and income to identify whether households are recovered or not from power outages after Hurricane Irma.They found that while distributing federal f inancial assistance, low-income households and minority groups were given less priority.Duf fey ( 2019) used a wide variety of extreme events, such as hurricanes, wildf ires, heavy snowstorms, and devastating cyclones, to calculate recovery times and probabilities of failure to restore.He found that wildf ires and hurricanes may have dif ferent causes, but the non-restoration probability patterns they produce are identical: a straightforward exponential decline.Lee et al.( 2019) studied the disparity in getting social supports (for example, instrumental, emotional, informational, and outside contact support) considering respondents’ sociodemographic characteristics such as education, age, and religion.The results imply that older and less educated people faced constraints in post-disaster support.Previous studies also found that regions served by rural municipalities faced longer disruption for electricity disruption after Hurricane Maria and Irma (Mitsova et al.2018; Román et al.2019).Using satellite nighttime lights data for Hurricane Maria, Román et al.( 2019) found that within the same urban area, poor residents possess higher risk of power loss and longer disruption time.To determine the relationship between physical and socioeconomic characteristics and the power recovery ef fort, Azad and Ghandehari ( 2021) developed a Quasi-Poisson regression model and found that major challenges to the repair work were poor road infrastructure and economically depressed communities.These studies considered sociodemographic information of the households and regions while analyzing the ef fects of electricity disruption and time required for recovery operation for power outage.However, these studies did not focus on the distribution of restoration time to get back the power over regions.
In addition, other considerations such as meteorological, housing characteristics, and so on are equally important to perceive the dynamics of restoration process for the disaster response community.Watson et al.( 2022) developed a machine learning model for predicting the ef fects of extreme weather events on electrical distribution grids.They found substantial diversity in the meteorological factors that drive the predictions for the most severe events, suggesting that weather hazards are more complex than they are often treated in empirical analyses of their impacts.Wanik et al.( 2018) simulated Hurricane Sandy like scenarios in the future to determine the severity of tree-caused outages in Connecticut, with each showing increased winds and higher rain accumulation over the study area as a result of large-scale thermodynamic changes in the atmosphere and track modif ications in 2100.Using an ensemble of Weather Research and Forecasting simulations coupled with three machine learning-based outage prediction models, they found that future Sandy will lead to a 42–64% rise in outages.Mukherjee et al.( 2018) characterized the key factors of severe weather-induced power outages and found that power outage risk is a function of the type of natural hazard, and investments in operations/maintenance activities(for example, tree-trimming, replacing old equipment, and so on).These studies found weather impacts on power grids and density of power outages with simulations and machine learning algorithms.
Previous studies used various statistical modeling approaches for estimating power service restoration time.Mitsova et al.( 2018) developed a spatial autoregressive(SAR) model at a county level for Hurricane Irma to determine the attributes associated with restoration time from power outages.However, like the AFT model, the SAR model does not provide useful insights for time to event data analysis.We used the GAFT model for two reasons: (1) as our dependent variable is restoration time, we considered this to be a time to event data analysis; (2) as our dependent variable is likely to have a spatial dependency, the GAFT model can be used for modeling both spatial and non-spatial data.Similarly, using a spatial autoregressive model, Ulak et al.( 2018 ) included wind speed, infrastructure and transportation, demographic, and socioeconomic characteristics to predict the number of power outages in the City of Tallahassee of Florida for Hurricane Hermine.Rachunok and Nateghi ( 2020) considered the spatial distribution of disruptions by demonstrating the network-performance of the power distribution grid’s sensitivity to spatial characteristics.However, we should give more emphasis on restoration time rather than outage density.If many customers face power outage after a hurricane but they get back their power services within a short period, it may not hamper much to their business, social, and other daily activities.Besides the SAR model, a random forest model was used to predict hurricaneinduced power outage durations (Nateghi et al.2014) and outages (Guikema et al.2014), which does not provide useful insights for time to event data analysis and spatial clustering of restoration time.
In summary, the following observations can be made.First, two types of dependent variables have been considered in the existing literature: the number of outages and duration of outages.Second, duration of outages was examined at dif ferent geographical levels ranging from grid sizes to county subdivisions and county levels.Lastly, dif ferent types of factors such as meteorological, physical, and sociodemographic attributes were considered to explain the outage durations by developing dif ferent machine learning and statistical models.No models have been developed,however, that account for time as a dependent variable and spatial autocorrelation.This article claims a methodological contribution for modeling power outage restoration time by considering spatial dependence and time to event aspects present in the data.This can provide more accurate and reliable predictions of restoration time with signif icant implications on policymaking related to infrastructure planning and management.More specif ically, the following research questions need to be answered: (1) can we implement a statistical model that can account both for time to event data and spatial dependence of the data to predict restoration time from hurricane-induced power outages from a set of common key factors that are publicly available? (2) Can we explain the spatial distribution of restoration time of electricity disruption due to a hurricane using a statistical clustering approach? As such, the objectives of this study were to understand the spatial clustering patterns of the restoration time of power outages due to a hurricane and to determine the factors associated with prolonged restoration time considering a wide range of variables including hazard, the built environment, and sociodemographic characteristics.
3 Data Collection and Processing
We considered three types of factors: hazard characteristics,built environment characteristics, and sociodemographic factors that might be associated with longer restoration times of power outages during a hurricane.
3.1 Restoration Time
We collected the data for the restoration time of power outages during Hurricane Irma from Florida Today1data.f loridatoday.com/storm-power-outages/.for each county of Florida.The plots in Florida Today were drawn using the data from the Florida Division of Emergency Management (FDEM).We used the duration between the time when 20% customers or more of a particular county f irst lost their electricity services and the time when 20% customers or less were yet to restore their power services (Fig.1).In other words, duration from when 20% of customers lost their power to the time by which 80% of customers in a county had their power restored.We chose 80% of customers’ restoration time from a sensitivity analysis.
While each customer’s power may be restored at dif ferent times, companies typically make broad announcementsthat provide a single approximate restoration time for each county or region (Liu et al.2007).Liu et al.( 2007) estimated restoration times as the time by which an arbitraryZ% (say 90%) of the customers of the county will have their power restored.They collected power outage data from a utility company, allowing them to obtain such a threshold directly from power companies.Since we did not collect datasets from power companies, it was not possible for us to know the company-specif ic threshold (Z%) values.In this study, we chose a thresholdZ% to quantify restoration time based on a sensitivity analysis.For sensitivity analysis, we chose three dif ferent values of the threshold,Z= 80%, 85%, and 90%.We did not use a threshold of the time by whichZ> 90%of the customers in a county will have their power restored because of model generalizability.A choice ofZ> 90% may overestimate the restoration time.We ran the GAFT model for the three values ofZ%, and selected the threshold based on average log pseudo marginal likelihood (LPML).The average LPML values were found to be −1.276, −1.279,and −1.517 for 80%, 85%, and 90% of customers restoration time, respectively.We used average LPML instead of total LPML to compare the models (Iraganaboina and Eluru 2021) because the number of observations changes with the selection of the threshold.The total LPML value is likely to decrease with the increase in the number of observations.So, a higher value of total LPML can result from a smaller number of observations in the model rather than indicating good model performance.The average LPML value is higher for the model with 80% selected as a threshold to calculate the restoration time.Thus, we chose a threshold ofZ% =80% to quantify the restoration time.
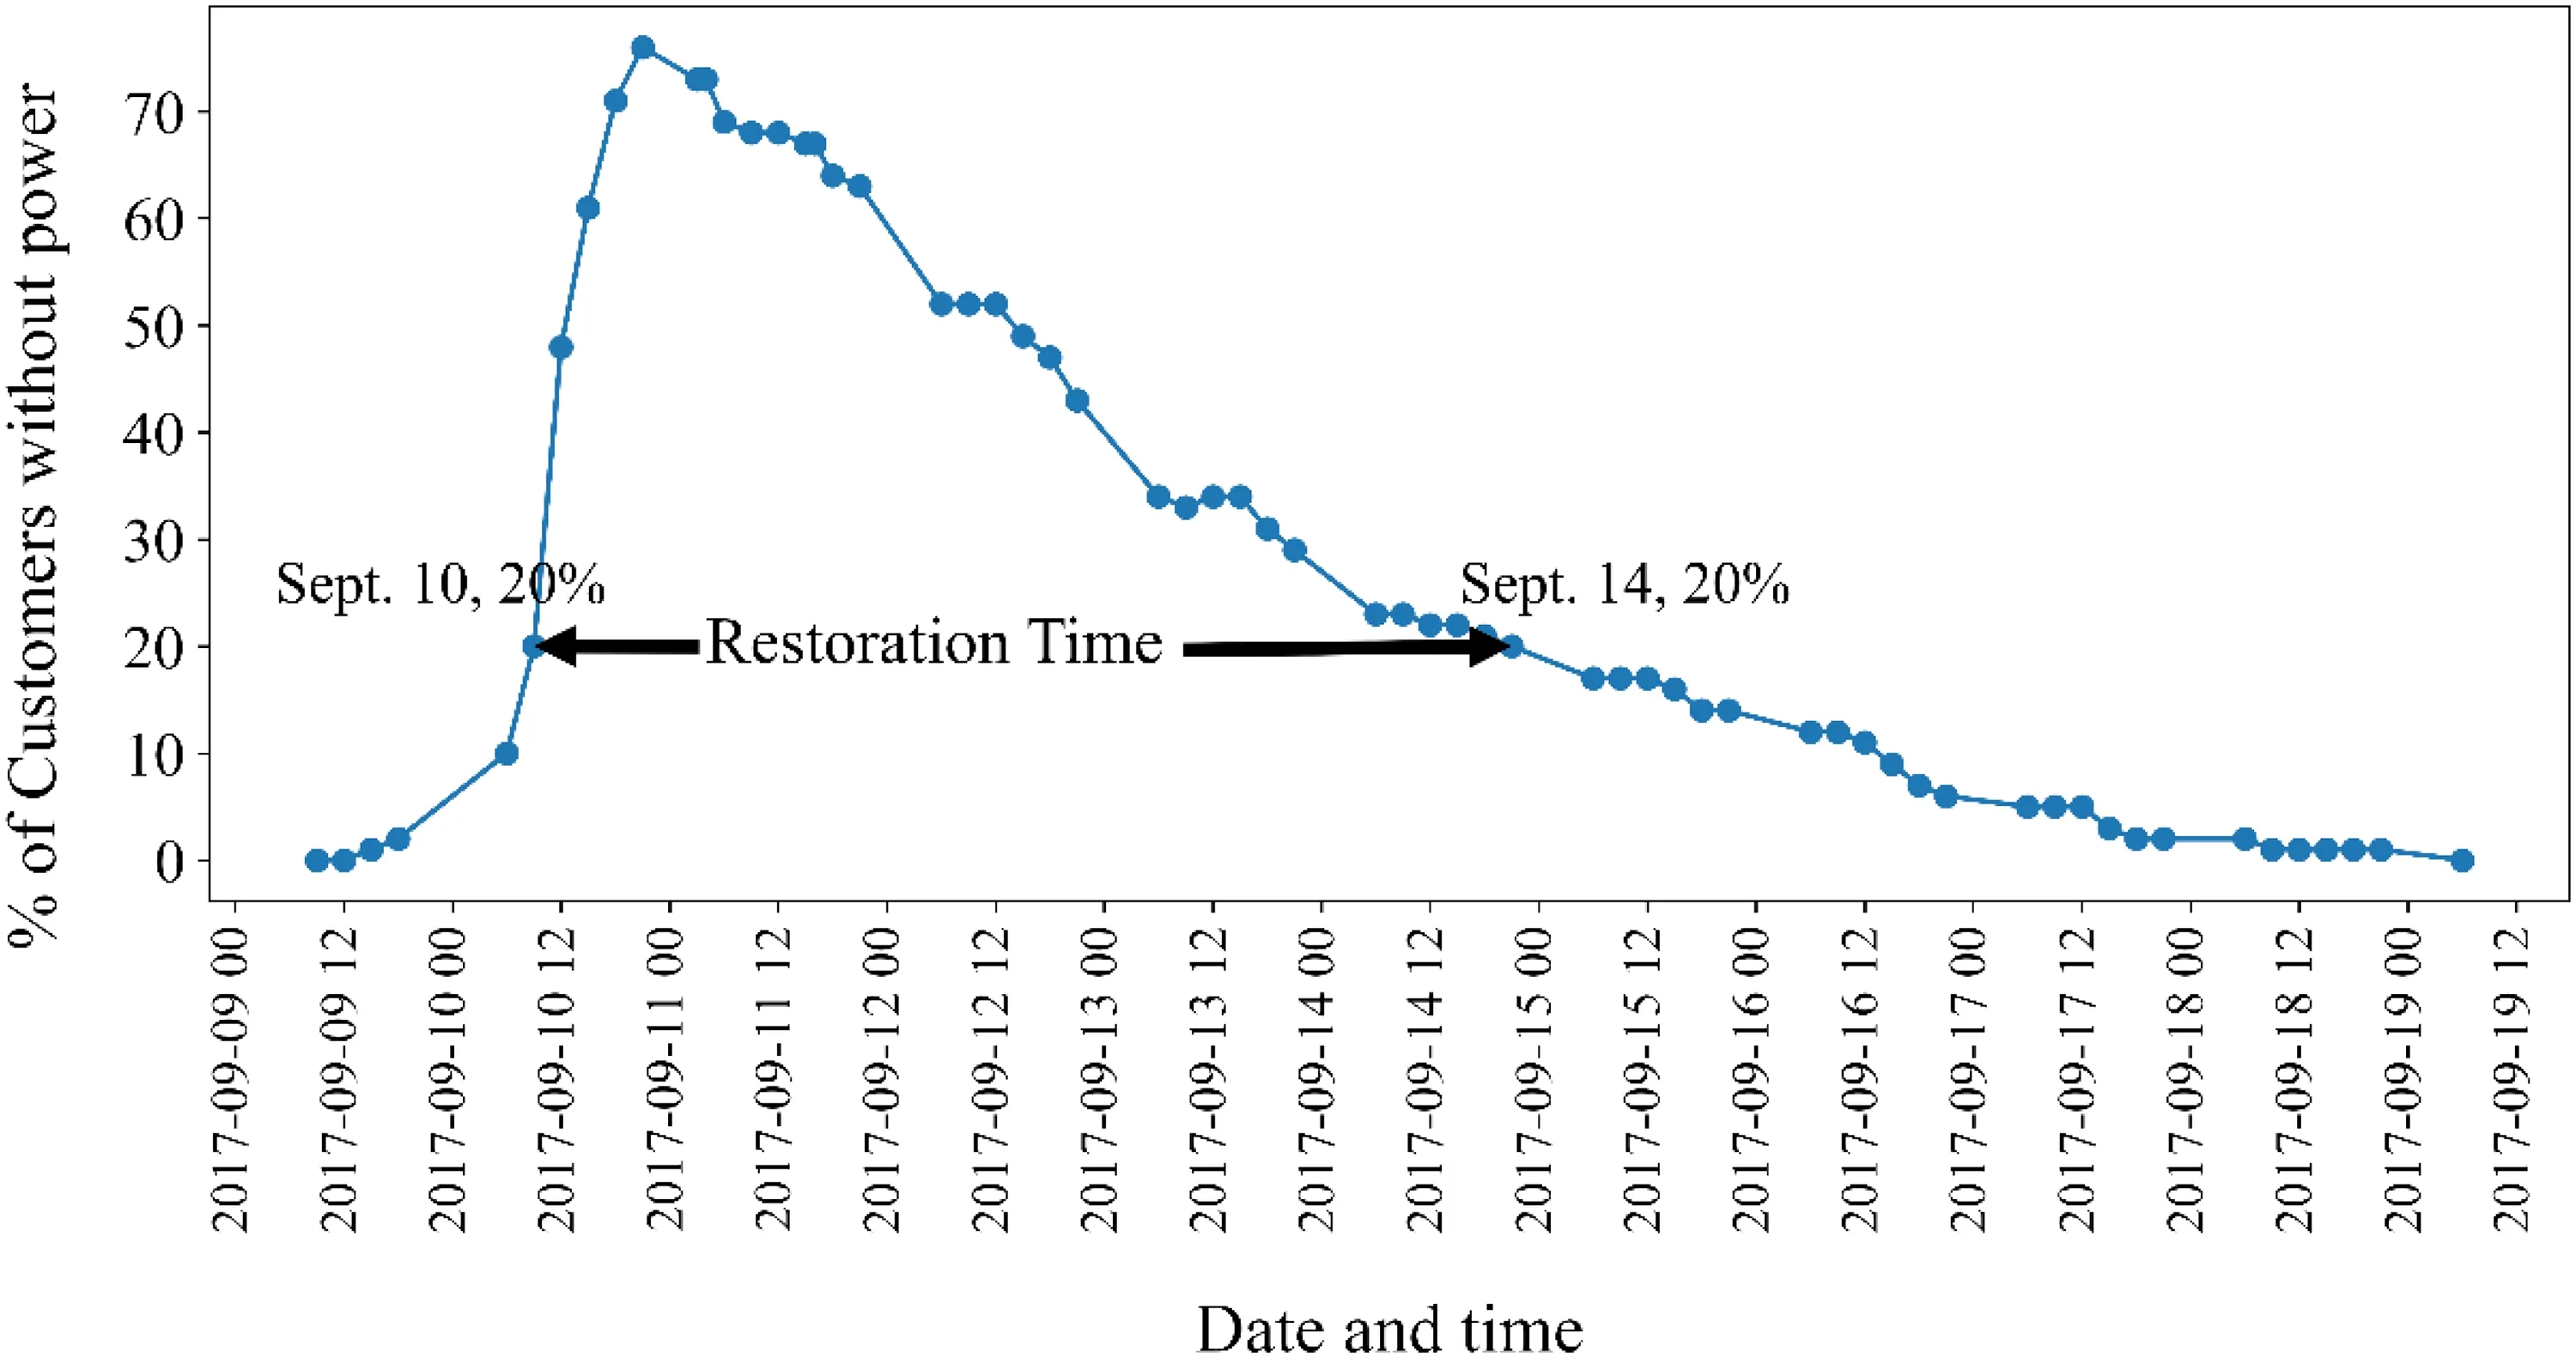
Fig.1 Power outage for Broward County after Hurricane Irma and considered restoration time in this study
Although Florida consists of 67 counties, we considered 58 counties in this study.We did not consider nine counties because either there was no power outage (that is, no customer lost power, as in counties such as Escambia, Holmes, Oskaloosa, Santa Rosa, and Walton) or the percentage of customers that lost power was less than 20%.Thus, for these counties, the restoration time would be zero.Also, we were interested in estimating power outage due to hurricane impacts.From the wind speed values, it was evident that those counties had very low (close to zero) sustained wind speed, indicating that hurricane did not impact these counties.In most of the counties (19 counties), it took 3 days to restore the power service for at least 80% of their customers(Fig.2).
3.2 Hazard Characteristics
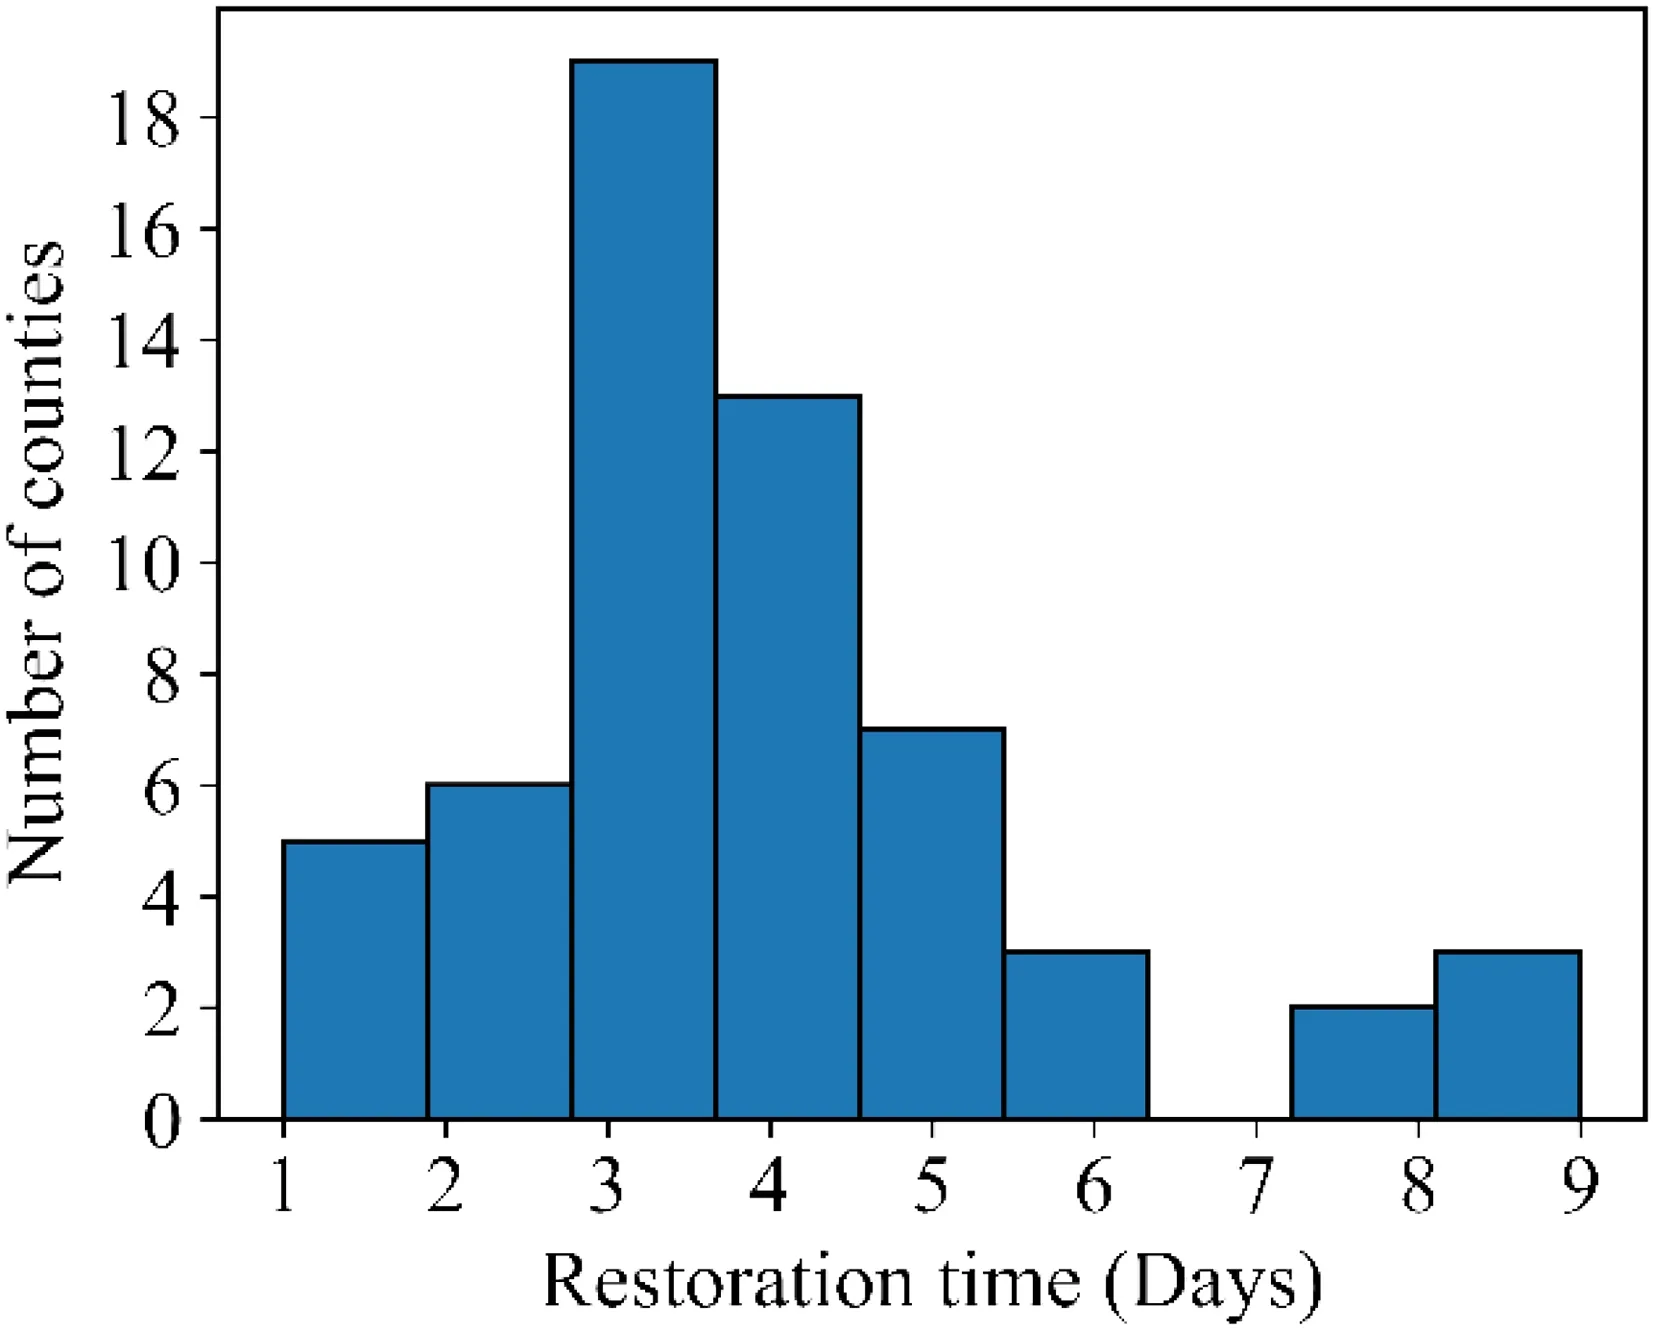
Fig.2 Histogram for restoration times of in Florida after Hurricane Irma

Table 1 Descriptive statistics of continuous variables
Under hazard characteristics we considered four types of covariates: maximum sustained wind speed, the percentage of power outage in each county, the percentage of census tracts prone to f lash f lood in each county, and the percentage of census tracts prone to sea level rise in each county.The wind speed for Hurricane Irma was estimated from the HAZUS-MH wind model (Vickery et al.2000; Vickery et al.2006).This model creates the wind speed prof ile probabilistically due to a hurricane event.Using this model,we obtained maximum sustained wind speed at census tract level based on their distance to the center of the hurricane.For a given county, the highest wind speed among all census tracts was considered as the maximum sustained wind speed for that county.
We considered the maximum percentage of customers faced power outage from 9 to 28 September 2017.We collected this information from the Florida Division of Emergency Management.
3.3 Built Environment Characteristics
For built environment characteristics, we considered the percentage of customers served by investor-owned company,and power system variables.According to the Florida Public Service Commission (FPSC), there are three types of electric service providers in Florida: investor-owned electric utilities, rural electric cooperatives, and municipal electric utilities.Investor-owned electric utilities include Florida Power and Light Company, Duke Energy, Tampa Electric Company, Gulf Power Company, and Florida Public Utilities cooperation.Florida also has 34 municipally owned electric utilities and 18 rural electric cooperatives.Investor-owned electric companies are private companies not associated with any government agency.We considered the percentage of customers served by investor-owned electric utilities in each county.We added this variable for two purposes:(1) to understand how these companies responded during the restoration process and (2) if there is any discrepancy in restoration across various electric companies.We collected the number of total customers under each type of electric companies along with total number of customers for each county from FPSC,2psc.state.f l.us/Home/HurricaneReport.publicly available in their database.
We also considered the number of substations, power plants, and total length of overhead line in each county.They provide a measure of the extent of power system.We collected power system data from U.S.Energy Information Administration, EIA.3eia.gov/maps/layer_info-m.php.
3.4 Sociodemographic Characteristics
For sociodemographic characteristics, we included the median income of the households, and the percentage of non-White American population in each county from the 2013 to 2017 American Community Survey (ACS) 5-Year Data Prof ile.4census.gov/acs/www/data/data-tables-and-tools/data-prof iles/2017/.We standardized median income before adding to the model.
The descriptive statistics of the data are given in Table 1.To understand the presence of correlations among the predictors, Pearson’s correlation was calculated (Fig.3).Correlation values among the number of power plants, the number of substations, and total length of overhead power lines are high (0.72 and 0.77) (Raithel 2008).For the number of substations and total length of overhead lines, variance inf lation factors were 8.1 and 11.8, respectively, indicating the presence of multicollinearity issue.So, we considered only the number of power plants among these three variables to simplify the statistical model.The multicollinearity condition number with our considered six variables was 8.189(which was below 30), indicating that collinearity should not be an issue.

Fig.3 Pearson’s correlations between variables
4 Methodological Approach
The methodological approach in this study has two main parts.First, we determined the spatial distribution of the restoration time based on the disruption of electricity services.Second, we adopted a statistical modeling approach to determine the factors associated with restoration time from power outages.
4.1 Spatial Distribution for Restoration Time of Power Outage
To identify if there is a clustering pattern between restoration times of electricity disruption in the af fected areas,we used global Moran’sI(Eq.1) (Ord and Getis 1995),which is typically used to estimate spatial autocorrelation.Moran’sIwas used by Jackson et al.( 2021) to understand the spatial trends in county-level COVID-19 cases and fatalities in the United States during the f irst year of the pandemic.

where zjis the deviation from the mean and the summation overjsuch that only neighboring values are included.In addition to local Moran’sI, we plotted a choropleth map to visualize the spatial distribution of restoration times.We used ESDA and PySAL packages in Python 3.9 to calculate the global and local Moran’sI.
4.2 Statistical Modeling Approach
To determine the ef fects of the factors (described in Sect.3)on restoration times from power outages, we developed a generalized accelerated failure time model (GAFT).To account for the spatial dependence, a random ef fect (frailty)is introduced into the linear predictor of survival model (a survival model is a statistical approach used to analyze the time until an event of interest occurs).Both georeferenced(that is, latitude and longitude are recorded) and areal referenced (that is, county of residence recorded) spatial data are handled via random ef fects (frailties) (Zhou et al.2020).The GAFT model is given by the following equations (Zhou et al.2020).

We estimated this model in R using the spBayesSurv package and the frailtyGAFT function.The detailed description of this package and model can be found in Zhou et al.( 2020) and Hsu et al.( 2015).As this is a Bayesian modeling approach, it requires to set the prior distributions of the parameters based on domain knowledge.However, this prior knowledge is usually not available (Ulak et al.2018).In this study, we set most of the prior information according to the default values of frailtyGAFT function under spBayesSurv package in R due to the unavailability of the prior information about the actual parameter distributions and validated it using the trace plots obtained from the model.
The Bayesian specif ication for prior distribution of the model used in this study is given below (Hsu et al.2015;Zhou et al.2020):
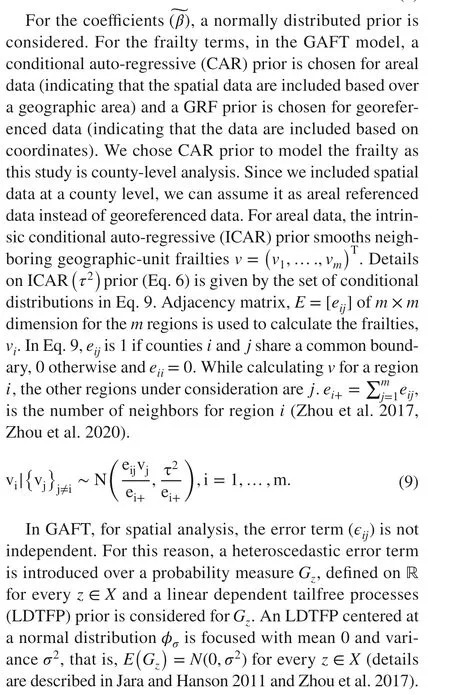
Since the posterior distribution for coef ficients of the covariates are unknown, we ran Markov chain Monte Carlo(MCMC) simulation.For MCMC simulation, we ran 4 chains, where 16,000 scans were thinned after a burn-in period of 30,000 based upon examination of trace plots for model parameters (Fig.6).A trace plot is a diagnostic tool for assessing the mixing of a chain.It shows the iterationnumber against the value of the draw of the parameter at each iteration.It also shows whether a chain gets stuck in certain areas of the parameter space, indicating bad mixing.
5 Results
This section f irst presents the spatial distribution of power outage restoration time.Second, it presents the result from the statistical model.
5.1 Result for Spatial Distribution
We mapped the restoration time with associated county over Florida (Fig.4).Figure 4 shows that the southern parts of Florida (Monroe, Lee, Collier, Charlotte, Broward,Miami-Dade, Palm-Beach, and Hendry Counties) needed priority during restoration process after Hurricane Irma.In addition, it shows that counties in the middle of Florida(Seminole, Orange, St.Johns, Putnam, and Marion) and some in the North (Hamilton, Suwannee, and Lafayette)faced moderate (4–7 days) duration of disruption and needed attention for fast recovery.
The obtained global Moran’sIvalue is 0.58 (p-value =0.001), indicating the presence of spatial autocorrelation.Figure 5 shows locations of the clustering patterns for the restoration time from power outages.The global Moran’sItest within the entire study area shows signif icant (p< 0.05)spatial autocorrelation for our target attribute.
Local Moran’sIplot (Fig.5) shows the clusters of longer restoration time (hot spots) and the clusters of short

Fig.5 Local Moran’s I plot for restoration time of power outage
5.2 Result from Statistical Analysis
For statistical analysis, we considered spatial models because of the obtained global Moran’sIstatistics found in Sect.5.1.A high Moran’sIvalue of 0.58 (p-value =0.001) clearly indicates the presence of spatial correlations among observations.As such, a non-spatial model assuming independent and identically distributed (IID) observations, ignoring spatial correlations, will not be appropriate.Spatial survival analysis is used to analyze clustered time to event data when the clustering issue arises from geographical regions (Banerjee 2016).
Table 2 presents the results of the generalized accelerated failure time (GAFT) model.Two separate models were f itted with and without considering spatial correlation.The proposed GAFT model with CAR frailties has the larger logpseudo marginal likelihood (LPML) (−74) compared to the non-frailty GAFT model (−83), indicating that considering spatial correlation improves the model f it by 12%.
Bayes factors is a Bayesian alternative to classical hypoth-restoration time.The local Moran’sItest shows considerable spatial clustering for 17 counties (local clusters are signif icant,p< 0.05).The grey areas in Fig.5 are the locations where no signif icant spatial patterns were found;the red areas are the counties where people had longer restoration time living closely to other counties with longer restoration time.The low with low (L-L) are all the blue areas, those are locations where people had shorter restoration time living closely to other counties with shorter time of restoration process.For Hurricane Irma in Florida,we could not f ind any HL or LH clustering pattern.esis testing.The Bayes factors for testing all the covariates’ef fects on baseline survival were found to be greater than 100, indicating that the baseline survival function (Eq.3)under the AFT model depends on these variables, and thus the GAFT model should be considered (Zhou et al.2020).The mean posterior inference of conditional CAR frailty variable was found to be 0.212, representing the amount of spatial variation across counties.The trace plots of the regression coef ficients (Fig.6) have even and stationary pattern, indicating that MCMC simulations converged (Zhou et al.2020).

Table 2 Posterior inference of regression coef ficients
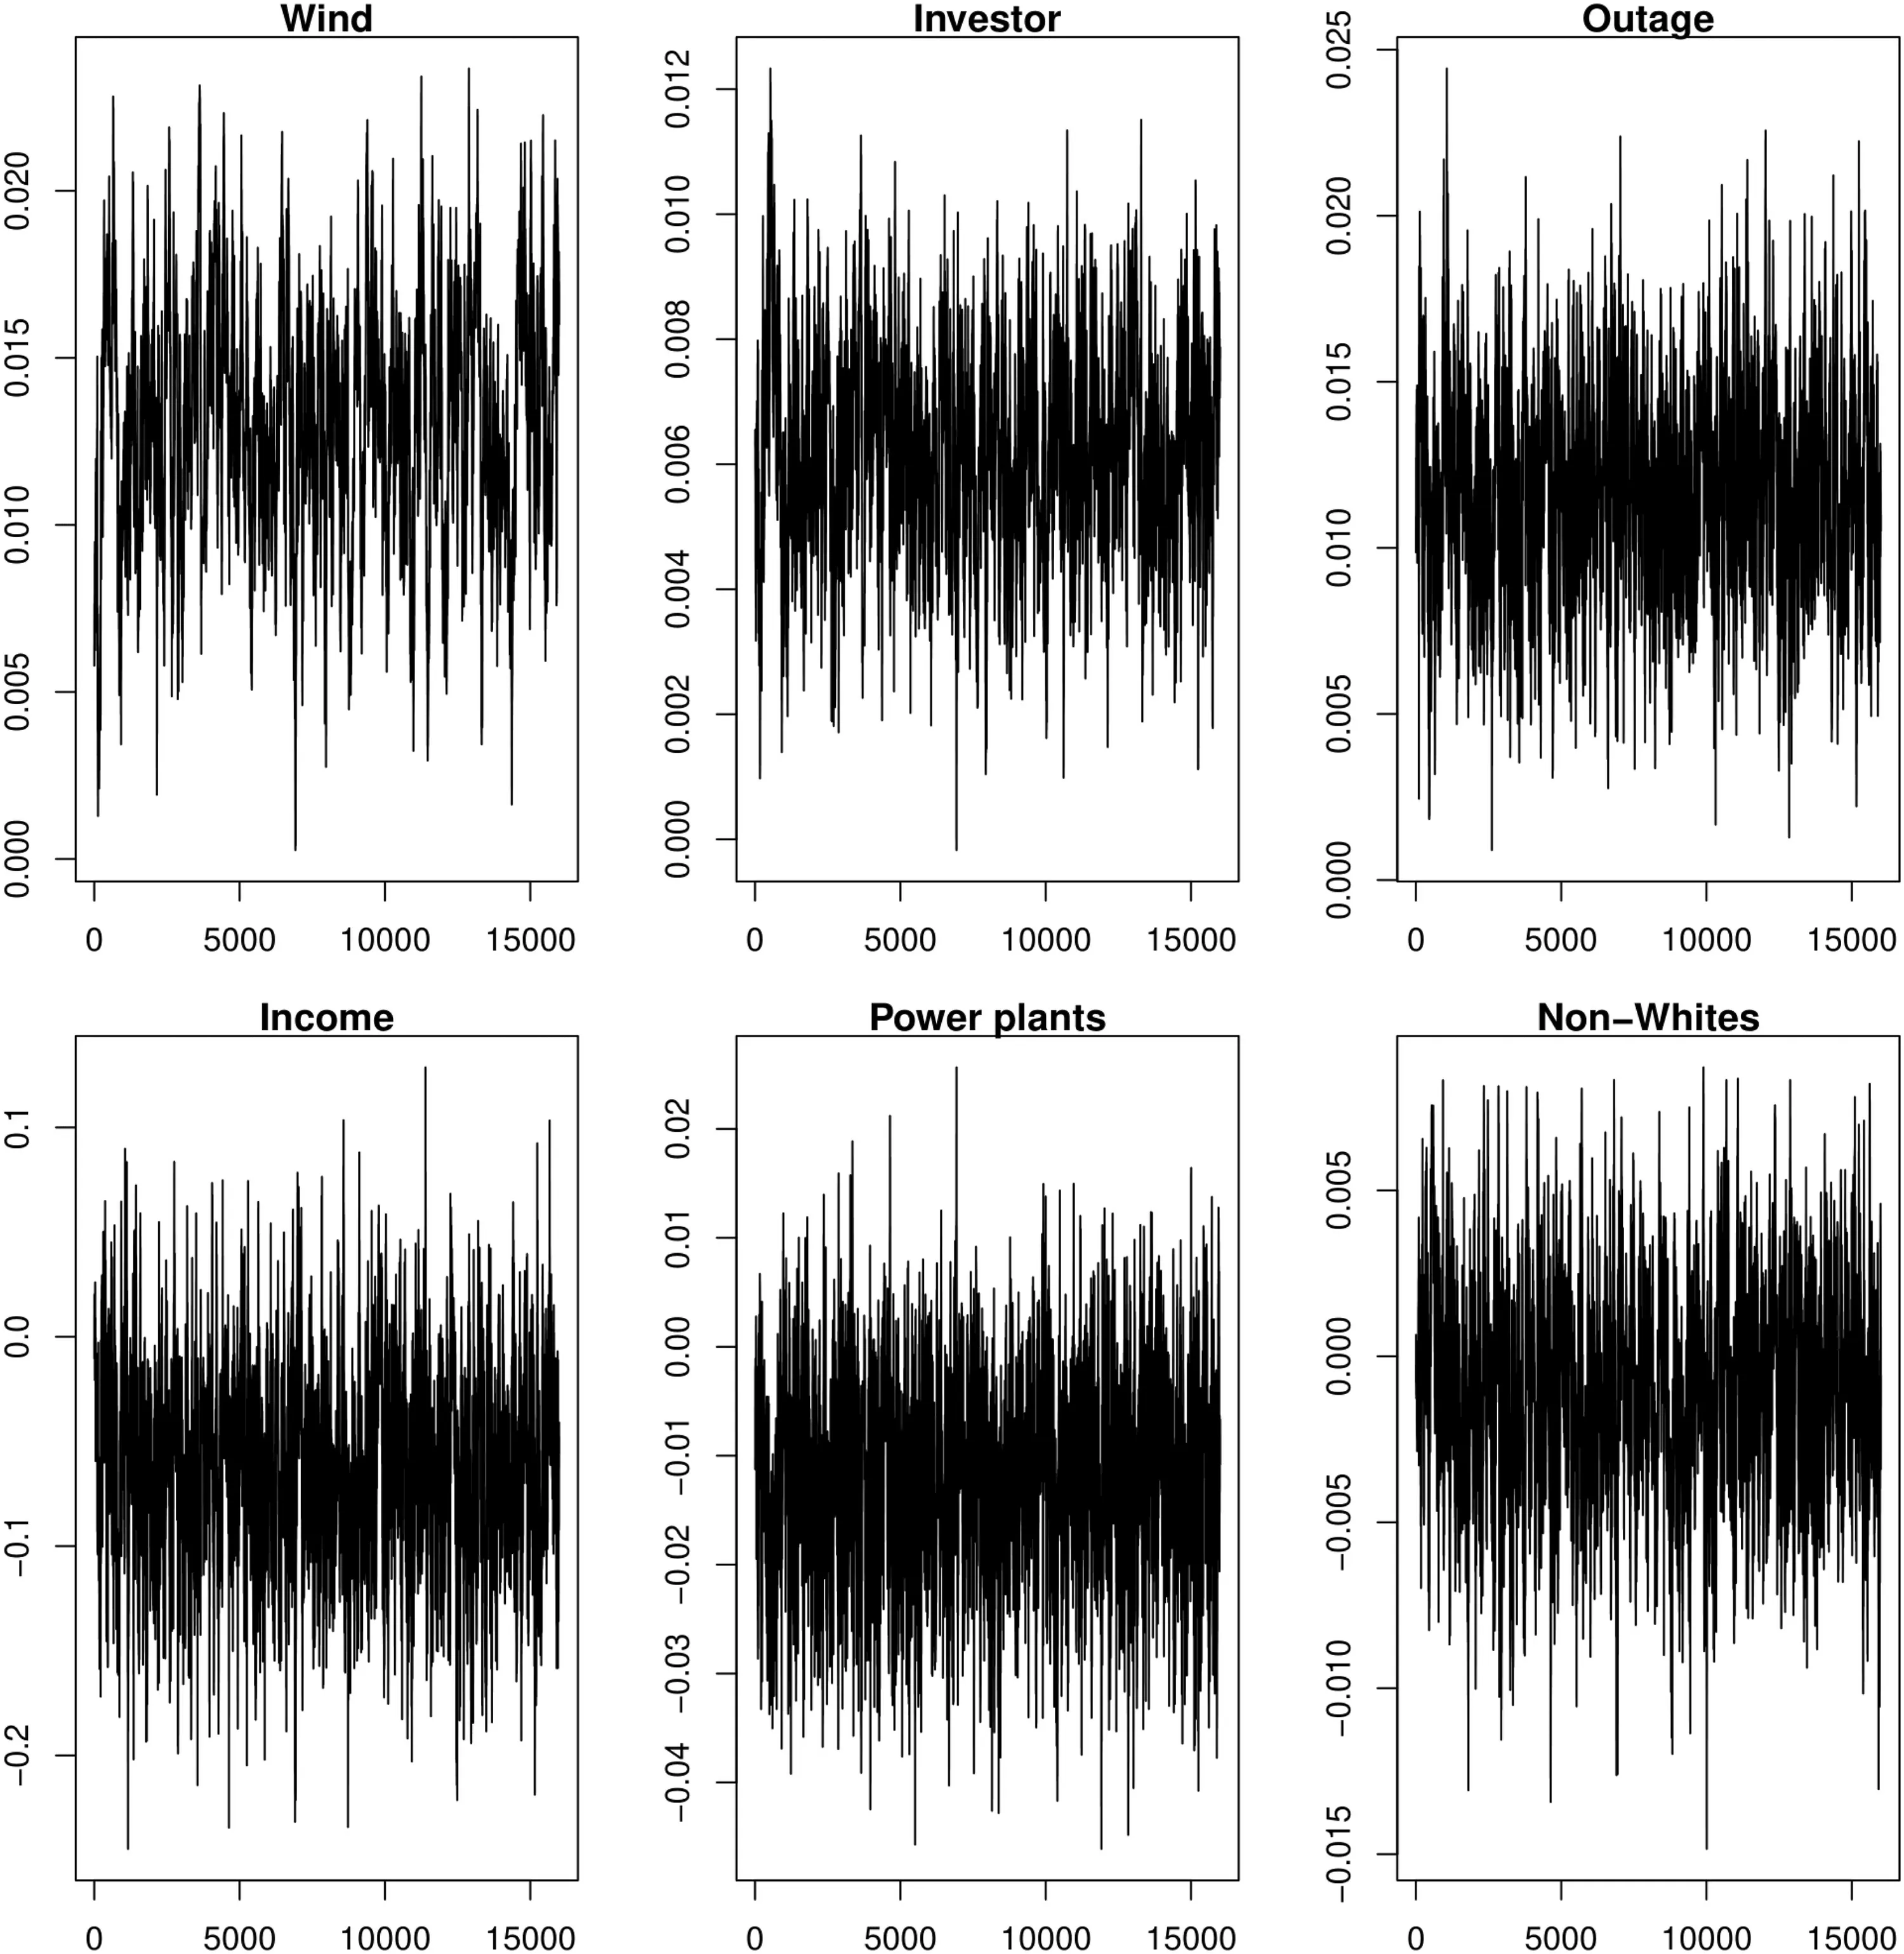
Fig.6 Trace plots of regression coef ficients
Standard deviations of the maximum sustained wind speed, the percentage of customers served by investor-owned power companies, the percentage of customers faced power outages, the number of power plants, and median income are small compared to the mean (Table 2).Moreover, 90%high posterior density interval of the regression coef ficients do not contain zero, indicating that these variables have signif icant inf luence on restoration time.
Among hazard characteristics, maximum sustained wind speed and the percentage of customers faced power outages were found to be signif icant and positively associated with power service restoration time.A positive association means that an increase in a predictor variable will increase restoration time and a negative association indicates the opposite.The exponentiated coef ficient of maximum sustained wind speed ( e0.013=1.013 ) is the factor by which the mean restoration time increases by 1.3% with 1 mph increase in maximum sustained wind speed.One percent increase in % of customers without power ( e0.0117=1.0117 )increases the mean restoration time by 1.17%.Among built environment characteristics, percentage of customers served by investor-owned power companies and the number of power plants were found to be signif icant.Among sociodemographic variables, median income was found to be statistically signif icant in the model without CAR frailties.After adding counties as frailties, the model accounted for spatial autocorrelation, reducing the apparent signif icance of median income and number of power plants.
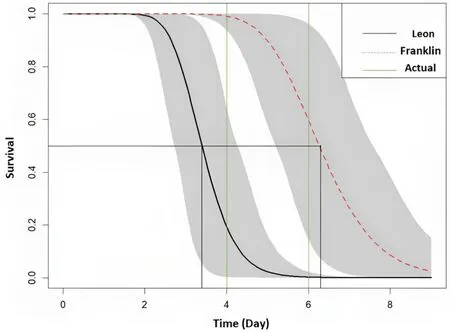
Fig.7 Survival curves for Hurricane Michael
Since Hurricane Irma’s data were used to f it the GAFT model, we generated survival curves for counties af fected by Hurricane Michael to ensure that the model is not overf itting.The model captured restoration time with minimal deviation for seven counties present in our study area.Among those seven counties, Fig.7 shows Leon and Franklin Counties’survival curves (median with 95% conf idence interval) predicted by the model.Survival curves of all seven counties indicated that Jef ferson, Leon, Wakulla, Franklin, Gadsden,Liberty, and Gulf Counties had median restoration times of about 2, 4, 5, 6, 10, 12, and 12 days, respectively and these counties had actual restoration times of 2, 4, 4, 6, 11, 12, and 13 days, respectively.
6 Discussion
In this study, we examined how hazard, built environment,and socioeconomic characteristics of a region are associated with restoration time of power outages due to a hurricane.Our results indicate that counties with higher wind speed had longer restoration times.It is likely that high wind speed during Hurricane Irma caused greater damages to the electric infrastructure systems, causing a longer restoration time.The positive coef ficient for the percentage of customers faced power outage indicates that for regions where higher percentage of customers were out of electricity, it took longer time for the maintenance teams to restore power service in such places.
The percentage of customers of a county served by an investor-owned utility company is also positively associated with restoration time.It indicates that counties with a higher percentage of customers served by investor-owned electric companies faced longer restoration time, adjusting for other covariates and county of residence.This may have happened because the regions where most of the households are served by investor-owned utility companies also faced higher wind speed, and had a large number of customers with power outages.As a result, it took long time for the investor-owned power companies to restore electricity disruption.
The number of power plants is negatively associated with restoration time, adjusting for other covariates and county of residence.That is, counties with more power plants were able to restore their power services fast.A greater number of power plants indicates a more extensive and better power system of a region.In other words, these areas are prioritized to get more systems up and running, resulting in a shorter restoration time of power outages.Utility companies might have prioritized restoration in regions with large number of power plants since component-based restoration strategies prioritize critical components in the following order: power plants, substations, transmissions, and distributions (Esmalian et al.2022).Moreover, we found that it took a longer time for investor-owned power companies to restore electricity disruption, perhaps because of a high number of outages present in the regions served by investor-owned companies.Hence, instead of a component-based restoration strategy, an outage-based restoration strategy can be prioritized, focusing the regions with a greater number of customers without power.Population and vulnerability-based restoration strategies were found to be better than a component based strategy in the agent-based simulation by Esmalian et al.( 2022).
Figure 8 highlights counties with signif icant factors of longer power service restoration time using county-level data.For example, maximum sustained wind speeds in southwest counties of Florida (Monroe, Collier, Lee, Hendry, and Highlands) were greater than southeast counties(Miami-Dade, Broward, Palm Beach, Martin, and St.Lucie)and northwest counties (Taylor, Jef ferson, Leon, Wakulla,Gadsden, Gadsden, Liberty, and Franklin).As a result,southwest counties on average (8 days) had longer time of power outage, southeast counties faced on average 4.5 days,and northwest counties on average 1.75 days of power disruption.Counties where 75% or more customers were served by investor-owned power companies on average faced 4.75 days of electricity disruption.Collier and Highlands Counties faced 9 days of power disruption where about 87% of the customers were served by investor-owned power companies.In such counties, the mean percentage of customers who faced power disruption was also higher (79%).In Collier and Highlands, about 97% customers lost power services due to Hurricane Irma.Counties with 4 or more number of power plants (Polk, Leon, Hillsborough, Alachua, Orange,and Osceola) on average faced 3.5 days of power disruption.
Previous studies on Hurricanes Irma (Mitsova et al.2018)and Hurricanes Bonnie, Isabell, Dennis, and Floyd (Liu et al.2007) showed that maximum sustained wind speed is positively associated with power service restoration time.The number of power plants is important to predict thunderstorminduced power outages (Kabir et al.2019).Mitsova et al.( 2018) found longer disruption for municipal owned power companies and rural cooperatives.Besides, they found the percentage of Hispanic population to be signif icant, which contradict with our results.One possible reason for these discrepancies could be that Mitsova et al.( 2018) considered wind speed information as a dichotomous variable, which cannot account for the dif ferences of wind speeds across counties.Thus, the ef fect of wind speed on restoration times is captured by other variables (for example, % of customers served by different power companies and % of Hispanic population).On the contrary, we have considered actual maximum sustained wind speed for each county.It is often assumed that poor,minority communities are less prioritized, ref lecting inequality in power service restoration activities.Previous studies also found disparities in experienced hardship due to power outages in Puerto Rico and Texas during Hurricane Maria and Harvey(Coleman et al.2020; Azad and Ghandehari 2021).Consistent with these studies, we found disparity issue with respect to median income for power restoration time in Florida during Hurricane Irma.This necessitates accelerated recovery activities and better infrastructure systems in low-income communities to make them resilient to hurricane impacts.
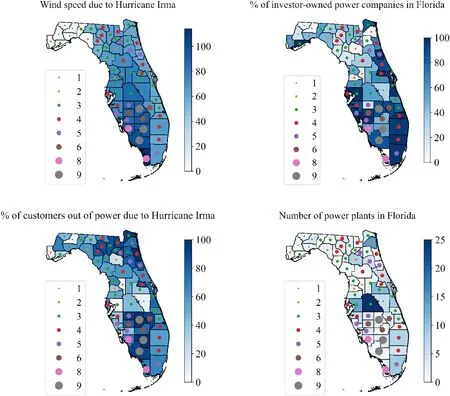
Fig.8 Counties in Florida mapped by signif icant variables for power service restoration time (the color bar represents the factors and dots represent the restoration time in days)
Based on the signif icant factors (for example, maximum sustained wind speed, % of customers faced power outage,% of customers served by investor-owned power companies,and the number of power plants) obtained from the GAFT model with CAR frailties, areas likely to face a longer disruption time after a hurricane can be identif ied.For most of the counties, these four variables could capture the possible critical regions for restoration process of power outages(Fig.8).
7 Conclusion
In this study, spatial distribution of restoration time was investigated at a county level to identify less resilient location for electricity disruption.We presented a generalized accelerated failure time (GAFT) model to determine the factors that have impacts on electricity infrastructure systems.Considering spatial correlation in time to event data analysis has improved the model f it by 12% compared to the model without considering spatial correlation.The proposed model holds potential for the analysis of power service restoration time due to extreme events as it can consider spatial clustering particularly for time as a dependent variable.The f indings of this study suggest that counties with a higher percentage of customers served by investor-owned electric companies, smaller number of power plants, and lower median household income faced power outage for a longer time.Hence, recovery strategies based on number of outages and vulnerability (in terms of median income) may improve power outage recovery time.
The described approaches and f inding of the study can aid policymakers and emergency management of ficials in understanding factors that should be given importance during the restoration process after a hurricane.This study will also allow them to identify which critical counties or regions need attention for restoration process and can ensure rapid restoration and minimize losses in the af fected regions.In general, electricity companies have the knowledge about power system variables (for example, the number of power plants, substations, and total length of overhead lines) and number of outages but do not have much knowledge about disaster conditions.Therefore, if utility companies can work with emergency managers to understand the relationship between disaster condition and electricity disruption, they could take necessary steps that would account for disaster conditions.Such ef forts can improve electrical grid resilience during extreme events and lead to improved recovery outcomes.
Most previous studies (Liu et al.2007; Kabir et al.2019)were based on proprietary data from utility companies.This does not allow reproducibility of the research and prevents implementation in actual crisis management.All the factors included in this study were collected from publicly available data.For example, projected hurricane path or wind speed information can be obtained from the National Weather Service (NWS) and National Hurricane Center (NHC) when planning for power restoration before a hurricane strikes.Similarly, socioeconomic characteristics of a community are available in ACS.Thus, the variables used in this study can be easily collected and used before the occurrence of a hurricane to predict restoration time.Such predictions will help policymakers and emergency management of ficials to accelerate the overall restoration process from power outages.
Our analysis has several limitations, which include: this study is a county-level analysis for power service restoration time.However, county is not the f inest geographic unit.In the future, focus can be given at smaller level of geographic units (for example, county subdivision, zip code, or census tracts) based on data availability.These limitations can be overcome if relevant agencies such as utility companies share outage data at a higher resolution.
AcknowledgmentsThe authors are grateful to the U.S.National Science Foundation for the Grant CMMI-1832578 to support the research presented in this article.However, the authors are solely responsible for the f indings presented here.
Open AccessThis article is licensed under a Creative Commons Attribution 4.0 International License, which permits use, sharing, adaptation, distribution and reproduction in any medium or format, as long as you give appropriate credit to the original author(s) and the source,provide a link to the Creative Commons licence, and indicate if changes were made.The images or other third party material in this article are included in the article's Creative Commons licence, unless indicated otherwise in a credit line to the material.If material is not included in the article's Creative Commons licence and your intended use is not permitted by statutory regulation or exceeds the permitted use, you will need to obtain permission directly from the copyright holder.To view a copy of this licence, visit http:// creat iveco mmons.org/ licen ses/ by/4.0/.
杂志排行
International Journal of Disaster Risk Science的其它文章
- The 2023 Earthquake in Türkiye and Implications for China’s Response to Catastrophe
- A Two-Stage Evolutionary Game Model for Collaborative Emergency Management Between Local Governments and Enterprises
- Reasoning Disaster Chains with Bayesian Network Estimated Under Expert Prior Knowledge
- The Dynamics of Interorganizational Collaboration in Disaster Management: A Network Study Based on Flood Disasters in China
- Identify Landslide Precursors from Time Series InSAR Results
- A Deep Learning Application for Building Damage Assessment Using Ultra-High-Resolution Remote Sensing Imagery in Turkey Earthquake
