Alternation of the Atmospheric Teleconnections Associated with the Northeast China Spring Rainfall during a Recent 60-Year Period
2023-02-08ZhiweiZHURuiLUShanshanFUandHuaCHEN
Zhiwei ZHU, Rui LU, Shanshan FU, and Hua CHEN
Key Laboratory of Meteorological Disaster, Ministry of Education (KLME)/Collaborative Innovation Center on Forecast and Evaluation of Meteorological Disasters (CIC-FEMD)/Joint International Research Laboratory of Climate and Environment Change (ILCEC), Nanjing University of Information Science and Technology,Nanjing 210044, China
ABSTRACT Northeast China (NEC) is China’s national grain production base, and the local precipitation is vital for agriculture during the springtime.Therefore, understanding the dynamic origins of the NEC spring rainfall (NECSR) variability is of socioeconomic importance.This study reveals an interdecadal change in the atmospheric teleconnections associated with the NECSR during a recent 60-year period (1961-2020).Before the mid-1980s, NECSR had been related to a Rossby wave train that is coupled with extratropical North Atlantic sea surface temperature (SST), whereas, since the mid-1980s, NECSR has been linked to a quite different Rossby wave train that is coupled with tropical North Atlantic SST.Both Rossby wave trains could lead to enhanced NECSR through anomalous cyclones over East Asia.The weakening of the westerly jet over North America is found to be mainly responsible for the alternation of the atmospheric teleconnections associated with NECSR during two epochs.
Key words: Northeast China spring rainfall, Rossby wave train, interdecadal change, westerly jet stream
1.Introduction
Northeast China (NEC) is one of China’s key national grain production bases, and the local precipitation has a large impact on the grain yield.Therefore, understanding the physical mechanism and improving the seasonal prediction of the precipitation variability over NEC are of great economic significance.
Previous studies have documented the significant interannual and interdecadal variability of precipitation over NEC.The interannual variability of precipitation over NEC is related to the regional circulation systems such as the cold vertex over Northeast Asia, East Asian monsoon (Shen et al.,2011), and anomalous anticyclone over Japan (Han et al.,2018a), which are remotely driven by the sea surface temperature (SST) variability over the Pacific, Atlantic (Zhang and Sun, 2020), and Indian Oceans (Gao et al., 2014; Zhao et al.,2022).Han et al.(2018b) found that the North Atlantic tripolar SST anomaly (SSTA) could trigger a stationary Rossby wave propagating eastward from the North Atlantic to Northeast Asia, which would modulate the Okhotsk high and East Asian trough and influence NEC precipitation.They also found that SST warming in the tropical Indian Ocean could stimulate the Eurasian wave pattern via induction of upper-level convergence over northern Europe, influencing NEC precipitation.
The long-term variability of SST over the Pacific,Atlantic, and Indian Oceans contributes to the interdecadalvariability of NEC precipitation (Wang and He, 2013; Zhou et al., 2021).NEC precipitation in early summer has had a strong relationship with the SSTA over the tropical Indian Ocean since the late 1980s (Han et al., 2018a).NEC precipitation in winter was closely associated with the SSTA over the Atlantic Ocean before 1990, whereas, it has been related to the SSTA over the Indian Ocean since 1990 (Han et al.,2018b).The SST warming over the tropical North Atlantic could induce an equivalent barotropic cyclonic anomaly over Northeast Asia, leading to a wetter NEC after 2000(Hu et al., 2021), whereas, the SST warming over the tropical Indian Ocean could affect NEC precipitation by exciting a zonal wave train pattern over the midlatitude Eurasian Continent and by inducing local meridional cells over the western Pacific/East Asia sector (Zhang and Sun, 2018).In addition,the transition of the Pacific decadal oscillation (PDO) from a negative to positive phase led to more NEC rainfall in April through inducing anomalous southerly flow over the East Asian coast (Chen et al., 2020).Furthermore, both the regime shift of the zonal distribution of snow cover over the Tibetan Plateau and the decline of sea ice cover over the Barents Sea could contribute to the interdecadal change of precipitation over NEC (Li et al., 2021; Zhang et al., 2022).
Spring is the sowing season in NEC, and, therefore, the local precipitation in this season is vital for grain production.Unfortunately, climate models have not shown satisfactory skill in simulating spring rainfall over NEC (NECSR) (Lu et al., 2020).Although the tropical North Atlantic SSTA is suggested to be closely related with NECSR (Lu et al., 2020;Zhang and Sun, 2020), the seasonal prediction of NECSR has always shown much lower skill than the seasonal predictions for other parts of China in operations (see the website of Beijing Climate Center of China Meteorological Administration, http://cmdp.ncc-cma.net/pred/vescom_history_model.php?elem=prec_china&model=CMMEv1.0), regardless of the known predictability source of the tropical North Atlantic SST.This dilemma motivates us to examine whether the tropical North Atlantic SSTA forcing of NECSR is consistent.Does the tropical North Atlantic SST have a stable relationship with NECSR? If not, what causes the unstable relationship? Unraveling these issues would help us to better understand the dynamic origins of NECSR variability and search reliable predictors for seasonal prediction.
2.Data, method, and model
The datasets used in this study include: 1) The monthly mean precipitation data from gauge stations throughout China regridded to have a horizontal resolution of 0.25° ×0.25°, which is provided by the National Meteorological Information Center (CN05.1, Wu and Gao, 2013).2) The monthly mean precipitation data with a 2.5° × 2.5° horizontal resolution from the National Oceanic and Atmospheric Administration (NOAA)'s Precipitation Reconstruction(PREC) (Chen et al., 2002).3) The monthly mean atmospheric variables from National Centers for Environmental Prediction-National Center for Atmospheric Research(NCEP/NCAR) (Kalnay et al., 1996) with a 2.5° × 2.5° horizontal resolution, the fifth generation ECMWF atmospheric reanalysis of the global climate (ERA5, Hersbach et al.,2020) with a 2.5° × 2.5° horizontal resolution, and the Japanese 55-year Reanalysis (JRA-55, Kobayashi et al.,2015) with a 1.25° × 1.25° horizontal resolution.4) The monthly mean SST data with a 2.0° × 2.0° horizontal resolution from National Oceanic and Atmospheric Administration(NOAA) Extended Reconstructed Sea Surface Temperature,version 5 (Huang et al., 2017).All datasets span from 1961 to 2020.Spring refers to seasonal mean for March to May(MAM).The climatology used in this study is the mean for the period of 1961-2020.Given that the anomalous atmospheric circulation found to be associated with NECSR is consistent between different datasets [see Figs.S1-S3 in the electronic supplementary material (ESM)], only the results derived from the NCEP/NCAR dataset are presented here.
The domain of NEC includes the provinces of Heilongjiang, Jilin, Liaoning, and eastern Inner Mongolia (Lu et al., 2020).Empirical orthogonal function (EOF) analysis(Lorenz, 1956) is employed to extract the leading mode of NECSR variability.The interannual component of the NECSR index (defined as the area mean precipitation over NEC) is extracted by removing the 9-year running mean from the original time series.Since the variance of the interannual component of the NECSR index accounts for around 80% of the total variance of the NECSR index, only the interannual component of the NECSR index is investigated in the present study.Linear regression and Pearson correlation are used for statistical analysis.The effective degrees of freedom (Nedof) are considered when assessing the statistical significance using the student’s t-test.The Nedofare calculated as follows (Bretherton et al., 1999):

where N indicates the sample number, and r1and r2represent the lag -1 autocorrelations of two series.
The wave activity flux (WAF) is calculated to detect the atmospheric teleconnection associated with the NECSR variability, using the following formula proposed by Takaya and Nakamura (2001):

where overbar and prime indicate the climatology and anomaly, respectively.ψand U = (u, v) represents the stream function and horizontal wind, respectively.W denotes the two-dimensional WAF of the Rossby wave.
To validate the physical mechanism of the alternation of the atmospheric teleconnection towards NECSR, an intermediate complexity model, the anomaly atmospheric general circulation model (AGCM), with the observational climatological fields was employed.This model is a global spectralmodel with T42 Gaussian grid horizontal resolution developed from the global spectrum dry AGCM (Held and Suarez, 1994) of the Geophysical Fluid Dynamics Laboratory.Using sigma (σ= p/ps) as its vertical coordinate and a T42 Gaussian grid horizontal resolution, the basic equations in this model include the momentum, continuity, thermal dynamic, and hydrostatic equations.To investigate the atmospheric response to the diabatic heating, the atmospheric heating profile, which mimics the observation, was prescribed at different levels of the troposphere in the AGCM.This model has been widely used to examine the formation of various atmospheric teleconnection patterns (Zhu and Li, 2016,2018; Lu et al., 2020).In the present study, the model is integrated for 30 days, and the 25-30-day mean is treated as the equilibrium state of the atmospheric response to the diabatic heating.
3.Results
The first EOF mode of NECSR (Fig.1a) displays a homogeneous pattern which accounts for 44.7% of total variance.The maximum positive loading locates at the southeast of NEC and declines northwestward gradually, which is consistent with the distribution of the climatology precipitation in the region.The NECSR index is highly consistent with the interannual component of PC1 (r = 0.99, p < 0.05), suggesting the coherence of interannual variability of spring rainfall over the whole NEC domain (Fig.1b).
To explore the dynamic and thermodynamic processes associated with NECSR, the geopotential height, wind, precipitation, and SST fields are regressed onto the NECSR index.As shown in Fig.1c, the enhanced NECSR is accompanied by two Rossby wave trains from the Atlantic to Eurasian continent, which is consistent with the results in Lu et al.(2020).The northern Rossby wave train (NRT) has five cyclonic/anticyclonic anomalies centered at the extratropical North Atlantic, southern Greenland, northern Europe, central Asia, and Northeast Asia, respectively, while the southern Rossby wave train (SRT) has six anticyclonic/cyclonic anomalies located over southern Greenland, the extratropical northeastern Atlantic, Northern Africa, the Red Sea, the Arabian Sea, and the Tibetan Plateau, respectively.These two Rossby wave trains present equivalent barotropic structures(Figs.1c, d).
It is noted that associated with NECSR is a significantly positive SSTA over the tropical North Atlantic (TNA).Thus,the year-to-year area-mean SSTA over the TNA (0°-24°N,10°-75°W) is defined as the TNA index.Figure 2a showsthe running correlations with different sliding windows between the NECSR index and TNA index.It is clear that a significant interdecadal change occurred around the mid-1980s for all sliding windows.The correlation is negligible(r = 0.07) before the mid-1980s, but it is significantly positive(r = 0.48, p < 0.01) afterwards.Therefore, in order to compare the physical processes associated with the NECSR variability, the total period is separated into two epochs, ID1 (from 1961 to 1983) and ID2 (from 1988 to 2020).
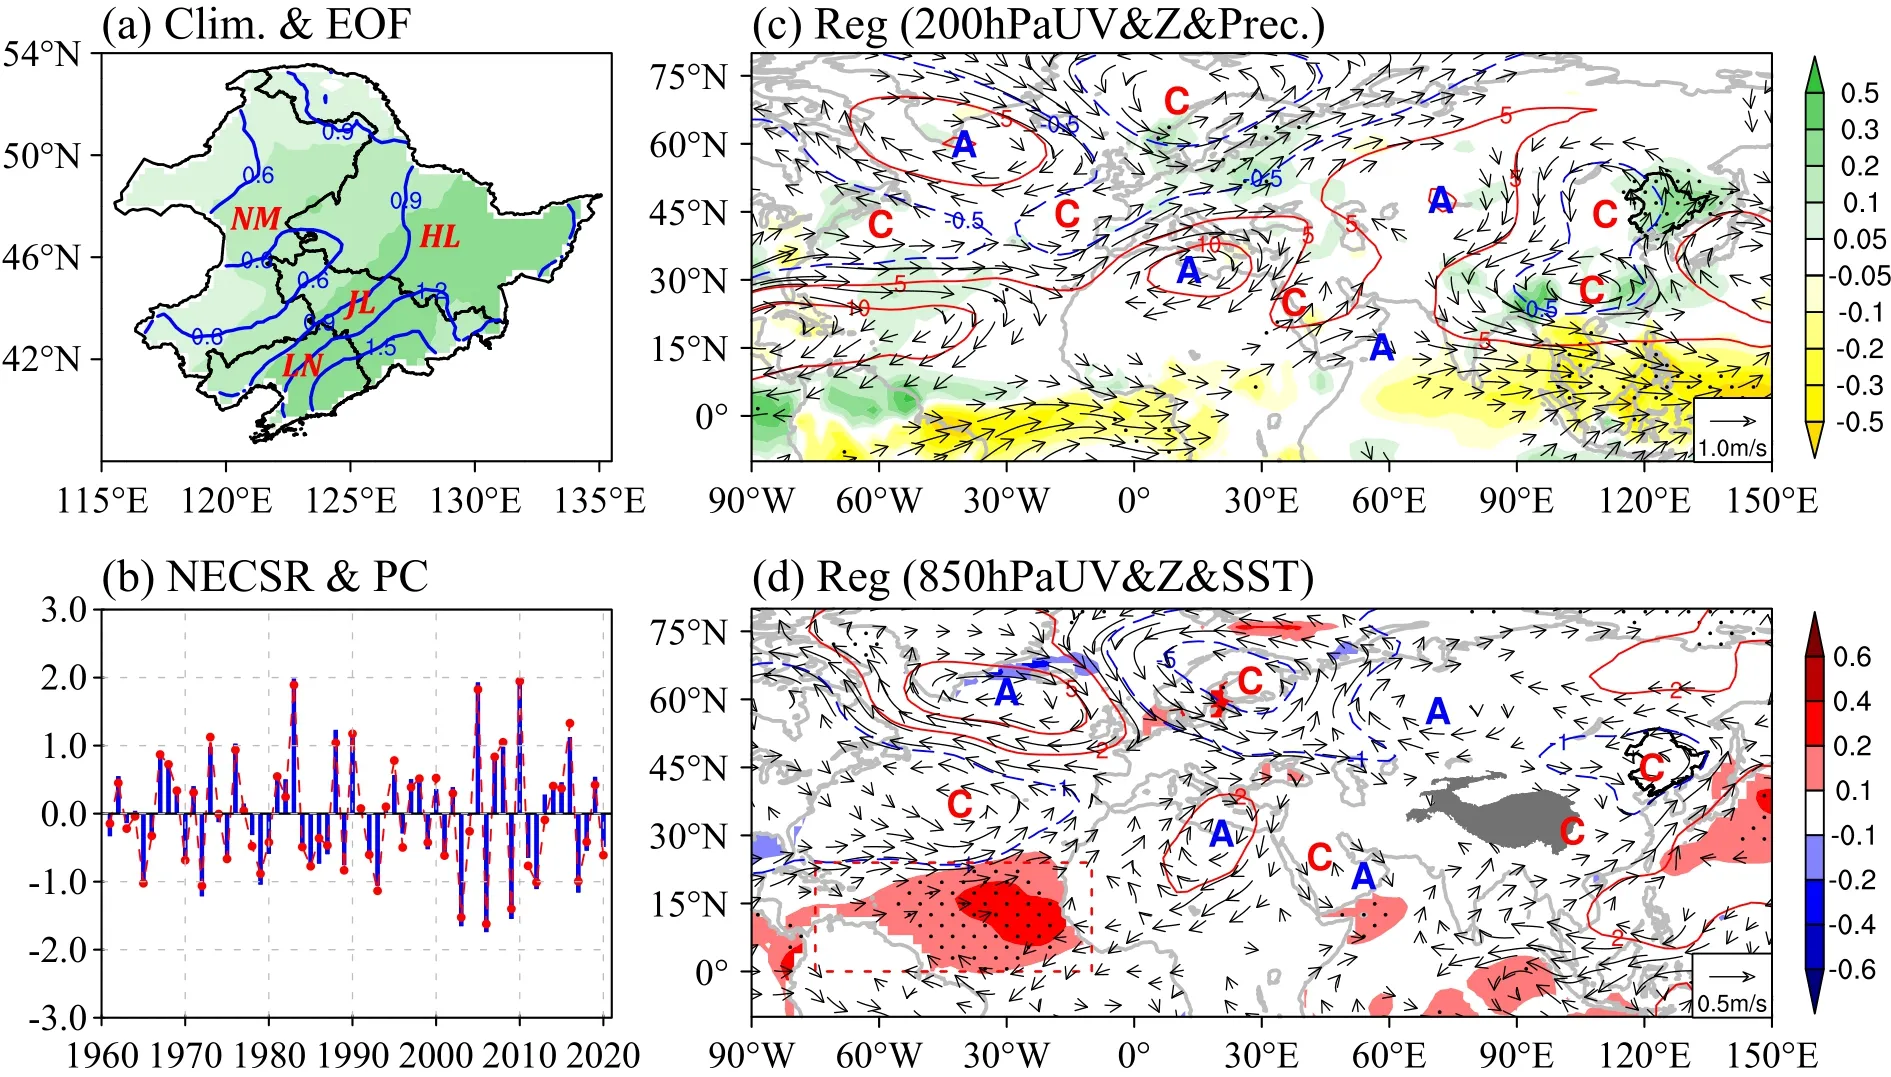
Fig.1.(a) The spatial pattern of the first EOF mode (shading) and climatology (contours, units: mm d-1) of NECSR from 1961 to 2020.(b) The principal component (PC, red dashed curve) of the first EOF mode and the NECSR index (blue bar).(c) The 200-hPa geopotential height (contours, units: gpm), wind (vectors, units: m s-1), and precipitation (shading, units:mm d-1) regressed onto the NECSR index.(d) The 850-hPa geopotential height (contours, units: gpm), wind (vectors, units:m s-1), and SST (shading, units: °C) regressed onto the NECSR index.Locations of Heilongjiang (HL), Jilin (JL), Liaoning(LN), and Inner Mongolia (NM) province are provided in (a).The horizontal thick line in (b) indicates the zero line.Letters A/C in (c-d) indicate the centers of anticyclonic/cyclonic anomalies, and the black bold lines represent the domain of NEC.The gray shading in (d) denotes the Tibetan Plateau, and the red dashed rectangle indicates the region of the tropical North Atlantic.The dotted regions in (c)/(d) indicate the regression coefficient of precipitation/SST passing the 95% confidence level.
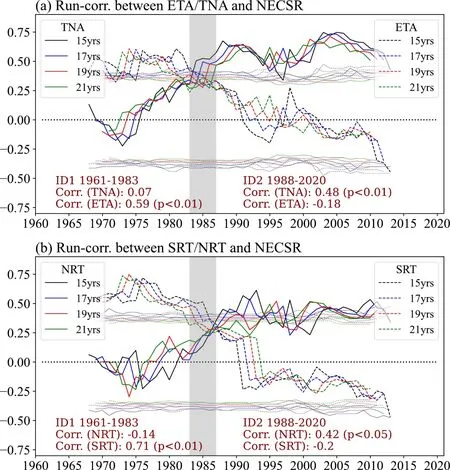
Fig.2.(a) Running correlations between the NECSR index and TNA index(bold solid lines)/ETA index (bold dashed lines), respectively, with sliding windows of 15 years, 17 years, 19 years, and 21 years.The solid and dashed thin lines represent the correlation coefficient for the 99% confidence level based on effective degree of freedom.(b) is the same as (a), but for the running correlations between the NECSR index and NRT index (bold solid lines)/SRT index (bold dashed lines).
Figure 3 shows regressed precipitation, SST, and 200-hPa and 850-hPa geopotential height and wind onto the NECSR index during ID1 and ID2, respectively.It can be concluded that the atmospheric circulation and SST anomalies related to enhanced NECSR are quite different during the two epochs.During ID1 (Figs.3a, b), the enhanced NECSR is accompanied by the SRT, with the wave activity flux propagating eastward from the subtropical western North Atlantic to around the Tibetan Plateau.The anomalous equivalent barotropic cyclone around the Tibetan Plateau could result in the convergence of water vapor over the NEC region (Fig.S4 in the ESM), leading to enhanced NECSR.To quantitively depict the SRT, the SRT index was defined using the 9-points-mean geopotential height around the centers of the anticyclonic/cyclonic anomalies along the wave train (see Fig.S5a in the ESM for the specific locations of the centers).It is clear that the SRT index has a significant correlation (r =0.71, p < 0.01) with NECSR during ID1 (Fig.2b) but no correlation (r = -0.2) with NECSR during ID2.Note that associated with the SRT, a significantly positive SSTA is observed over the extratropical North Atlantic (ETA) during ID1 (Fig.3b).The running correlation between the ETA index (defined as the area-mean SST over 32°-50°N, 65°-30°W) and NECSR also shows an interdecadal change around the mid-1980s; the correlation is significantly positive(r = 0.59, p < 0.01) before the mid-1980s but insignificant(r = -0.18) afterwards (Fig.2a).
During ID2 (Figs.3c, d), the enhanced NECSR is closely associated with the NRT.The wave activity flux of the NRT propagates northeastward from the extratropical North Atlantic to northern Europe and then bends southeastward to Northeast Asia.The anomalous equivalent barotropic cyclonic anomaly over Northeast Asia could result in the convergence of moisture over NEC (Fig.S4b in the ESM), leading to enhanced NECSR.The relationship between the NRT index (see Fig.S5b in the ESM for the specific locations of the centers) and NECSR also presents a remarkable interdecadal change before (r = -0.14) and after(r = 0.42, p < 0.05) the mid-1980s (Fig.2b), consistent withthe relationship between TNA SSTA and NECSR (Figs.2a,and 3).

Fig.3.(a) The 200-hPa geopotential height (contours, units: gpm) and wind (black vectors, units: m s-1), and precipitation (shading, units: mm d-1) fields regressed onto the NECSR index during ID1.The wave activity flux(units: m2 s-2) associated with geopotential height is represented by orange vectors in (a).(b) The 850-hPa geopotential height (contours, units: gpm) and wind (black vectors, units: m s-1), and SST (shading, units: °C) fields regressed onto the NECSR index during ID1.(c, d) same as in (a, b), but for fields during ID2.The dotted regions in(a, c)/(b, d) indicate the regression coefficient of precipitation/SST passes the 95% confidence level.
Therefore, the Rossby wave train and SSTA pattern associated with NECSR transition from the SRT to NRT and from the ETA to TNA, respectively, around the mid-1980s.But, what causes the alternation? It is known that the westerly jet can act as a waveguide of the Rossby wave train, and because the wave activity flux of both the SRT and NRT emanates from the North America/Atlantic sector, it is natural to speculate that changes in the local westerly jet could lead to a pattern change of the Rossby wave train.Figure 4a shows that the decadal change (ID2 mean minus ID1 mean)of zonal wind at 200-hPa is most significant over North America, compared with elsewhere in the Northern Hemisphere.Consistent with the interdecadal change in relationship between the teleconnections and NECSR occurring in the mid-1980s, the westerly jet over North America also shows an interdecadal weakening around the same time.The averaged 200-hPa zonal wind speed is reduced from 27.8 m s-1in ID1 to 26.1 m s-1in ID2.The weakening of the regional westerly jet is induced by the weakening meridional thermal contrast associated with SST warming over the subtropical North Pacific and extratropical North Atlantic (Fig.4b).Because the climatological mean precipitation over the tropical Atlantic is considerable and its variability is quite large(Fig.4a), the local westerly jet can convey the Rossby wave energy that was perturbed by the precipitation-induced diabatic heating in the tropical Atlantic (Figs.3a and c).Thus,it is proposed that the change of the regional westerly jet may have shaped the Rossby waves affecting NECSR into different patterns during two epochs.
To validate the speculation that the weakening westerly jet over North America could lead to the alternation of the atmospheric teleconnections impacting NECSR, two numerical simulations are conducted using an AGCM.In the first experiment (EXP_1), an idealized diabatic heating (with maximum of 1K d-1at 500-hPa, reduced to 80% at 700-hPa, 70%at 300-hPa, 40% at 850-hPa, and 30% at 200-hPa) over the tropical North Atlantic is imposed on the climatological background fields.In the second experiment (EXP_2), the same idealized diabatic heating is imposed in the model, but zonal wind speed over North America (20°-40°N, 140°-30°W) is halved while the same climatological background is kept elsewhere, to examine the effect of the weakening westerly jet over North America on the Rossby wave train.
As shown in Fig.S6 in the ESM, in EXP_1, at the beginning, a Gill-type response (Gill, 1980) to the diabatic heating is induced, in terms of the upper-level anticyclone anomaly over the tropical western North Atlantic.Then, acting as the Rossby wave source (Fig.S7a in the ESM), the anticyclone anomaly perturbs the westerly jet, which leads to the Rossby wave propagating along midlatitudes, forming the SRT.No significant responses can be found farther to the north (Fig.S6).In EXP_2, a similar upper-level anticyclone anomaly over the tropical western North Atlantic is induced by the diabatic heating (Fig.S6d).However, because the westerly jet over North America is largely reduced, the Rossby wave source (Fig.S7b) no longer follows the waveguide;instead, a Rossby wave train following a great circle path (i.e., the NRT) is formed (Fig.S6f).Hence, the simulations verify that the weakening of the westerly jet over North America indeed alternates the atmospheric teleconnections affecting NECSR.
In summary, because of the waveguide of the strong westerly jet over North America during ID1, the Rossby wave energy propagates eastward along the westerly jet towards East Asia, resulting in the cyclonic anomaly in the region and enhanced NECSR.However, as the local westerly jetstream is significantly reduced during ID2, it cannot serve as the waveguide for the eastward propagation of the Rossby wave.Thus, the tropical diabatic heating excites a Rossby wave train along the great circle path from the Atlantic to East Asia (Hoskins and Karoly, 1981), resulting in the cyclonic anomaly in East Asia and the enhanced NECSR.
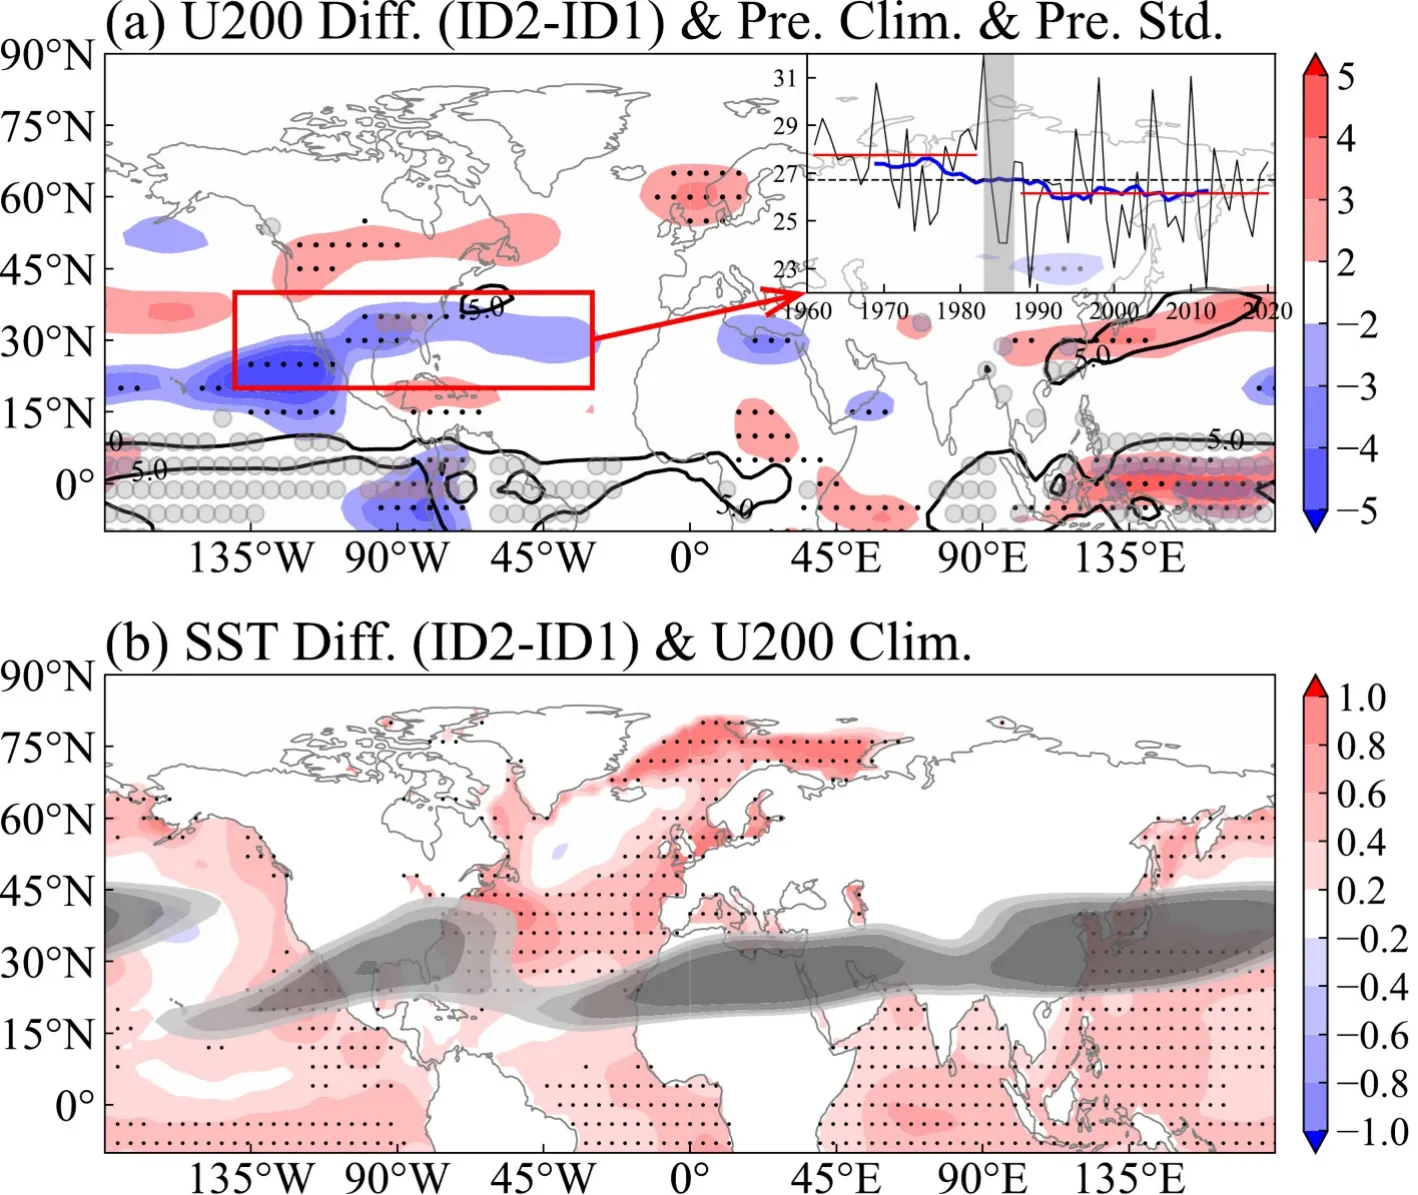
Fig.4.(a) The composite difference (ID2-mean minus ID1-mean) of 200-hPa zonal wind(shading, units: m s-1), and the climatology (contour, units: mm d-1) of precipitation with grey dots showing where the standard deviation is larger than one.The sub-image in (a) is the year-to-year time series of the areal-mean 200-hPa zonal wind over North America (red box:20°-40°N, 140°-30°W) (black curve, units: m s-1) and its 17-year running mean (blue curve,units: m s-1).The two red lines denote the average during ID1 and ID2.(b) The composite difference (ID2-mean minus ID1-mean) of SST (red shading, units: °C), and the climatology of the westerly jet stream (grey shadings, from light to dark, are 26 m s-1, 28 m s-1, 30 m s-1,and 34 m s-1).The differences of 200-hPa zonal wind, and SST passing the 99% confidence level are dotted.
4.Conclusion and discussion
Using the running correlation analyses with different sliding windows, an interdecadal change around the mid-1980s in the relationship between NECSR and the associated anomalous atmospheric teleconnections and SST is identified.
Before the mid-1980s, NECSR is closely related to the southern Rossby wave train (SRT) and SSTA over the extratropical North Atlantic (ETA) (Fig.5 upper panel).The SRT,coupled with ETA SST warming, propagates eastward from the subtropical western North Atlantic to the Tibetan Plateau.The cyclonic anomaly over East Asia leads to enhanced NECSR.After the mid-1980s, NECSR is closely associated with the northern Rossby wave train (NRT) and SSTA over the tropical North Atlantic (TNA) (Fig.5 lower panel).The NRT, coupled with TNA SST warming, occurs along the great circle path from the North Atlantic to Northeast Asia, leading to the cyclonic anomaly in the region and enhanced NECSR.Both the observation and simulated responses demonstrate that the alternation in the relationship between the Rossby wave train (SSTA over the Atlantic)and NECSR is mainly due to the weakening of the subtropical westerly jet stream over North America.
Generally, there are two kinds of Rossby waves.The first one is trapped and modified by the westerly jet, tending to be reflected back toward the jet core, which results in elongated anomalies along the axis of the jet (Hoskins and Karoly, 1981; Hoskins and Ambrizzi, 1993; Lu et al., 2002;Watanabe, 2004; Zhu and Li, 2016; Qian et al., 2022).The second one propagates without the strong gradients in the background mean state (i.e., westerly jet), following a great circle path (Hoskins and Karoly, 1981; Huang, 1992; Hsu,et al., 2021).All these studies indicate the importance of the variations of the upper-level wind field in shaping the propagation of Rossby wave trains (Branstator, 2002; Holman et al., 2014).
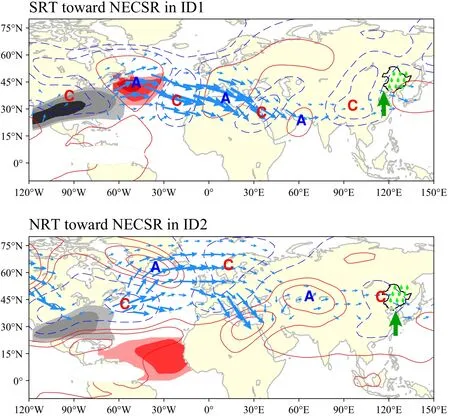
Fig.5.Schematic diagram illustrating the physical mechanism for the alternation of the Rossby wave train towards NECSR during two epochs.The green shadings indicate the diabatic heating.The red shadings over the Atlantic represent the associated SSTA, while the grey shadings (28 m s-1, 30 m s-1, and 34 m s-1, from light to dark, respectively) indicate the westerly jet over the North America sector.The contours and blue vectors represent the anomalous 200-hPa geopotential height and wave activity flux associated with NECSR,while the green arrow denotes the moisture flux.
One may doubt that the NECSR anomaly is linked with the seasonal-mean wind field associated with the stationary Rossby wave train.To address this issue, the water vapor budget analysis was diagnosed, and it showed that the mean circulation dynamic term played the dominant role rather than the transient term (Fig.S8 in the ESM), suggesting that NECSR is mainly related to the seasonal-mean circulation.
Note that the SST anomaly signal associated with NECSR over the tropical and extratropical North Atlantic in ID1 and ID2 could be seen at least one month ahead, suggesting the North Atlantic SSTA could be the predictability source of the NCESR (Fig.S9 in the ESM) during different epochs.Besides, the persistent SSTA signal could be detected at a 1- (6-) month lead over the extratropical (tropical) North Atlantic (Fig.S10 in the ESM).This would also provide useful information for seasonal prediction of NECSR.
The unstable relationship between predictors and the predictand has always been a common issue in empirical/statistical seasonal-prediction models.It may be necessary to properly consider the relative contribution of each predictor and slightly modify their weighting in the empirical model during different epochs.Meanwhile, the underlying mechanism for the alternations of these predictors should be investigated so that their changes could be further predicted.Note that the sliding correlation analyses (Fig.2) indicate that the relationship between the NRT/TNA SST and NECSR has become weakened again in recent years, and the SRT/ETA SST has become negatively correlated with NECSR, making finding reliable predictors for NECSR more challenging.Currently,we are trying to establish a decadal-varying seasonal-prediction model aimed at having stable predictive skill within a century by combining the useful dynamic decadal prediction outputs into the seasonal-prediction model.
Acknowledgements.The authors would like to thank the editor and two reviewers for their strict and high-quality review.This work was supported by the National Natural Science Foundation of China (Grant Nos: 42088101 & 42175033), and the High-Performance Computing Center of Nanjing University of Information Science & Technology.
Data Availability Statement.The NCEP/NCAR Reanalysis can be obtained at https://psl.noaa.gov/data/gridded/data.ncep.reanal-ysis.html, the JRA-55 dataset can be downloaded from https://rda.ucar.edu/#!lfd?nb=y&b=proj&v=JMA%20Japanese%2055-year%20Reanalysis, and the ERA5 reanalysis data can be obtained from https://cds.climate.copernicus.eu/cdsapp#!/search?type=dataset.The global monthly precipitation data can be derived from https://psl.noaa.gov/data/gridded/data.prec.html, and the monthly mean SST data can be obtained at https://psl.noaa.gov/data/gridded/data.noaa.ersst.v5.html.
Electronic supplementary material:Supplementary material is available in the online version of this article at https://doi.org/10.1007/s00376-022-2024-3.
杂志排行
Advances in Atmospheric Sciences的其它文章
- Understanding the Development of the 2018/19 Central Pacific El Niño
- The Importance of the Shape Parameter in a Bulk Parameterization Scheme to the Evolution of the Cloud Droplet Spectrum during Condensation
- Changes in Water Use Efficiency Caused by Climate Change, CO2 Fertilization, and Land Use Changes on the Tibetan Plateau
- Estimation of Lightning-Generated NOx in the Mainland of China Based on Cloud-to-Ground Lightning Location Data
- Circulation Patterns Linked to the Positive Sub-Tropical Indian Ocean Dipole
- Multi-scale Incremental Analysis Update Scheme and Its Application to Typhoon Mangkhut (2018) Prediction
