Changes in Water Use Efficiency Caused by Climate Change, CO2 Fertilization, and Land Use Changes on the Tibetan Plateau
2023-02-08BinghaoJIAXinLUOLonghuanWANGandXinLAI
Binghao JIA, Xin LUO, Longhuan WANG*,3,4, and Xin LAI
1State Key Laboratory of Numerical Modeling for Atmospheric Sciences and Geophysical Fluid Dynamics (LASG),Institute of Atmospheric Physics, Chinese Academy of Sciences, Beijing 100029, China
2Collaborative Innovation Center on Forecast and Evaluation of Meteorological Disasters (CIC-FEMD),Nanjing University of Information Science & Technology, Nanjing 210044, China
3Key Lab of Virtual Geographic Environment (Nanjing Normal University), Ministry of Education, Nanjing 210023, China
4Jiangsu Center for Collaborative Innovation in Geographical Information Resource Development and Application,Nanjing 210023, China
5Plateau Atmosphere and Environment Key Laboratory of Sichuan Province,Chengdu University of Information Technology, Chengdu 610225, China
ABSTRACT Terrestrial ecosystem water use efficiency (WUE) is an important indicator for coupling plant photosynthesis and transpiration, and is also a key factor linking the carbon and water cycles between the land and atmosphere.However,under the combination of climate change and human intervention, the change in WUE is still unclear, especially on the Tibetan Plateau (TP).Therefore, satellite remote sensing data and process-based terrestrial biosphere models (TBMs) are used in this study to investigate the spatiotemporal variations of WUE over the TP from 2001 to 2010.Then, the effects of land use and land cover change (LULCC) and CO2 fertilization on WUE from 1981-2010 are assessed using TBMs.Results show that climate change is the leading contributor to the change in WUE on the TP, and temperature is the most important factor.LULCC makes a negative contribution to WUE (-20.63%), which is greater than the positive contribution of CO2 fertilization (11.65%).In addition, CO2 fertilization can effectively improve ecosystem resilience on the TP.On the northwest plateau, the effects of LULCC and CO2 fertilization on WUE are more pronounced during the driest years than the annual average.These findings can help researchers understand the response of WUE to climate change and human activity and the coupling of the carbon and water cycles over the TP.
Key words: water use efficiency, gross primary productivity, evapotranspiration, Tibetan Plateau, carbon and water cycle
1.Introduction
Plants play an important role in terrestrial ecosystems.On one hand, vegetation releases its own water into the atmosphere through transpiration; on the other hand, it absorbs CO2from the atmosphere through photosynthesis and synthesizes organic carbon to remain in the vegetation itself (Yang et al., 2016; Liu et al., 2020).At the ecosystem level, the carbon-water coupling between the land and the atmosphere is often characterized by the ratio of gross primary productivity(GPP) to evapotranspiration (ET) and is called water use effi-ciency (WUE; Huang et al., 2015).In addition, WUE is an important parameter to describe the water adaptation strategy of plants in different growth environments.High WUE represents the performance of vegetation in adapting to the environment by closing stomata and reducing ET under drought conditions, while low WUE indicates sufficient water or weakened vegetation growth (Guo et al., 2019).
The Tibetan Plateau (TP), the highest plateau in the world, is known as the "Asian water tower" and is also an important ecological barrier and water conservation area for China and Asia (Yao et al., 2017).As one of the most sensitive areas responding to climate change, the fragile ecosystem on the TP has undergone tremendous changes (Zhang et al.,2014; Lamsal et al., 2017).Drought is one of the most serious impacts of climate change, affecting the carbon and water cycles of terrestrial ecosystems on a global and regional scale (Zhao and Running, 2010; Sheffield et al., 2012; Yu et al., 2014).Water stress caused by long-term inadequate water supply inhibits the normal growth of vegetation and reduces carbon sink, which can lead to a series of disasters such as grassland degradation and biological invasion (Song et al., 2019).In addition, as population and economic development increase (Li et al., 2013; Xu et al., 2016), the increased intervention of human activities [such as land use and land cover change (LULCC) and overgrazing] has led to the shrinkage and drying up of many rivers, lakes, and wetlands, desertification, and grassland degradation, which have major impacts on the carbon and water cycles of the plateau (Chen et al., 2013; Li et al., 2017).It has been reported that climate change has dominated the increase of WUE over the TP, while human activities (population growth and overgrazing) have reduced WUE (Wang et al.,2020).Terrestrial ecosystem resilience refers to the ability of an ecosystem to maintain or restore its structure and function in the face of hydroclimatic disturbances such as drought.WUE, which represents carbon-water coupling,has been widely used as an indicator of resilience analysis to evaluate the response of terrestrial ecosystems to hydroclimate disturbances (Sharma and Goyal, 2018a, b).Therefore,we need to further assess the impact of human activities on the ecological resilience on the TP, which helps us understand how human activities affect the degree of carbon-water coupling under drought conditions.
Previous studies have pointed out the significant impact of climate change and human activities on GPP and ET on the TP.Climate change is the dominant factor causing GPP changes; LULCC leads to the reduction of GPP, while CO2fertilization has a positive effect on GPP (Jia et al., 2020;Luo et al., 2020).Xu et al.(2016) found that ecological restoration projects can promote grassland restoration, but overgrazing weakens or even offsets the positive effects of climate change.Li et al.(2017) explored the impact of climate change and human activities on ET based on MODIS data.Although WUE is jointly determined by GPP and ET, the contribution of climate change and human activities to WUE change is unclear, especially in arid and semi-arid areas with fragile ecosystems.Liu et al.(2020) used model simulation data and found that GPP was the dominant factor of WUE variability in humid regions, while ET was the dominant factor of WUE change in arid regions.Fang et al.(2020) used the Budyko-Type model and found that WUE was proportional to vegetation coverage in the arid and semiarid Hailar River basin.For the TP, Shen et al.(2019) found that grazing can improve the carbon and nitrogen content,and the stomatal conductance of grassland, thus improving the WUE of terrestrial ecosystems.However, Wang et al.(2020) pointed out the negative effects of population growth and overgrazing on WUE.Therefore, it is not clear what the quantitative contributions of climate change and human activities to WUE are and whether drought affects the response intensity of WUE to human activities.
This study aims to improve our understanding of how LULCC and elevated CO2has impacted WUE on the TP.To achieve this goal, we first analyzed the spatiotemporal distribution of WUE from 2001 to 2010 based on GPP and ET data from multi-model ensemble simulations, satellitederived products, and observation-based statistical upscaling data sets.Then, the effects of LULCC and CO2fertilization on WUE from 1981-2010 were quantitatively assessed.Finally, the effects of LULCC and elevated CO2on ecological resilience over the TP are given.
2.Materials and methods
2.1.MsTMIP experimental design
We used monthly GPP and ET data from the Multiscale Synthesis and Terrestrial Model Intercomparison Project (MsTMIP; Huntzinger et al., 2013; Wei et al., 2014).Since the dataset from MsTMIP are only available for the period 1901-2010, the study period was chosen to be 1981-2010 in this work.The same driving data were used in the model simulation with a spatial resolution of 0.5° ×0.5°.In this study, we explored three simulation experiments: SG1, with time-varying climate, constant LULCC data at 1801 values, and constant atmospheric CO2concentrations at 1801 values; SG2 is similar to SG1, but with timevarying (annual) LULCC data; SG3 is similar to SG2, but with time-varying (monthly) atmospheric CO2concentration.Based on this experimental design, we were able to isolate the contribution of the environmental drivers to WUE changes, such as LULCC based on the difference between SG2 and SG1.The difference is then divided by the corresponding values of baseline simulation to obtain the percentage, i.e.(SG2-SG1)/SG1, (SG3-SG2)/SG2.We used the aggregate simulation results of nine terrestrial biosphere models (TBMs) to reduce the uncertainty of a single model simulation (Hagedorn et al., 2005; Schwalm et al., 2015; Liu et al.,2016).It is noted that the areas which are not covered by vegetation were excluded in this study.
2.2.Satellite-derived data and upscaling data
In order to reduce systematic biases and errors, threedatasets were used for comparison and mutual verification.First, we used the GPP (MOD17A3) and ET (MOD16A3)data of the Moderate Resolution Imaging Spectrometer(MODIS) product (Running et al., 2000; Zhao and Running,2010), which has a spatial resolution of 1 km and a temporal resolution of 8 days.To compare with the WUE simulated by MsTMIP, we used the nearest neighbor algorithm of ArcGIS 10.2 to resample the MODIS data to obtain monthly average data with a spatial resolution of 0.5° × 0.5°from 2001 to 2010.
Observation-driven global gridded monthly GPP and ET products derived from FLUXNET measurements were used for statistical scaling by machine learning algorithms(hereafter referred to as MTE; Jung et al., 2011, 2017).The statistical MTE model combines the remote sensing index, climate and meteorological data, and land cover information.The spatial resolution of the resulting product is 0.5° × 0.5°,covering the period from 1982 to 2011.
FLUXCOM used more machine learning algorithms (random forests, model tree ensembles, and multivariate adaptive regression splines; Tramontana et al., 2016; Jung et al.,2017).The spatial resolution of the resulting product is 0.5° ×0.5°, the GPP product coverage period is from 1980 to 2013,and the ET data coverage period is from 2001 to 2015.This article uses the arithmetic average of the three algorithms(hereinafter referred to as FLUXCOM).
Since the three datasets mentioned above (MODIS,MTE, and FLUXCOM) have different time ranges, we chose the same time period for them (2001-10), which would be convenient for the comparison with model simulations from MsTMIP.
2.3.Analytical methods
In this study, we use multiple linear regression to determine the response of WUE to climate variability (temperature, precipitation, and radiation) over the TP, using the following formula:
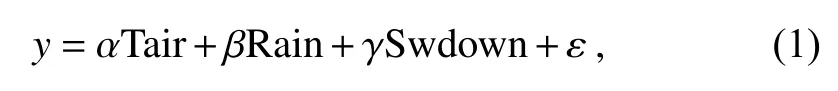
whereyis the WUE from SG3 for a given grid cell and year,and Tair, Rain, and Swdown are the annual average air temperature, rainfall, and incoming shortwave radiation, respectively.The α ,β, and γ are regression coefficients, and ε is the residual error term.To avoid inconsistency in the unit,we then calculated the standardized regression coefficients by multiplying the standard deviation of the independent variable and dividing the standard deviation of the dependent variable:
where σT, σR, σS, and σWUEare the standard deviation of Tair, Rain, Swdown, and WUE, respectively.It is noted that the standardized coefficients are consistent with the multiple regression coefficients using standardized variables (Siegel and Wagner, 2022).We attribute the change in the time series of y using the above equations in Eq.(1) to the dominance of the changes in Tair, Rain, and Swdown.The standardized regression coefficients are used to indicate the importance of each variable (Tair, Rain, and Swdown).
When hydro-climatic conditions change abruptly (such as from a dry to a humid year or from a humid to a dry year),the ability of the ecosystem to maintain the same structure and functions is called the ecosystem resilience (Walker et al., 2004; Ponce-Campos et al., 2013).Here, we quantify ecosystem resilience (Rd) to drought as the ratio of WUE in drought years (WUEd; the driest year refers to the minimum of annual precipitation per pixel) to the annual average WUE for the period from 1981 to 2010 (WUEm; Sharma and Goyal, 2018a, b):
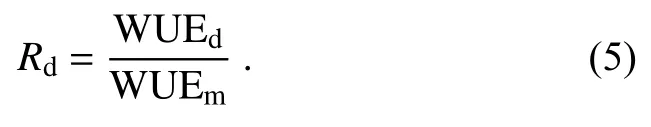
A resilient ecosystem could maintain or increase WUE to ensure its productivity in a water-limited environment due to drought (i.e., as WUEdwas equal to or greater than WUEm), where the Rdwould be equal to or greater than 1.Thus, a higher value (equal to or greater than 1) of Rdindicates a resilient ecosystem.
3.Results
3.1.Spatial patterns of WUE on the TP
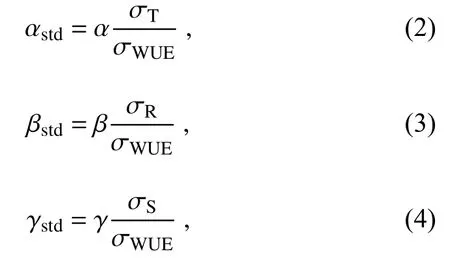
Over the TP, WUE decreases from southeast to northwest(Fig.1).Large differences exist among the individual models regarding the spatial distribution of WUE, and the annual mean value of simulated WUE ranges from 0.235 g C(kg H2O)-1(VISIT) to 1.706 g C (kg H2O)-1(LPJ-wsl).In addition, the result of the ENSEMBLE is 0.923±0.522 g C(kg H2O)-1(Table 1), indicating that the WUE for the TP simulated from the single models has great uncertainty.The estimated annual average WUE based on satellite remote sensing data is 0.465 g C (kg H2O)-1, and the MTE and FLUXCOM results are 0.897 g C (kg H2O)-1and 0.657 g C (kg H2O)-1, respectively.This is mainly due to the uncertainty in the ET and GPP estimates on the TP between different data and models, which increases the uncertainty in WUE.The multi-model ensemble strategy can effectively reduce the uncertainty of the mode simulation WUE.
3.2.Interannual variations and trends
Figure 2 shows interannual time series of WUE, GPP,and ET from the MTE, FLUXCOM, MODIS, and the ensemble mean of the nine MsTMIP models.CO2fertilization efficiency promotes the photosynthesis of vegetation, thereby increasing the value of GPP and improving the carbon-water coupling in the terrestrial ecosystems [the differences of annual GPP and WUE between SG3 and SG2 are 15.34 g C m-2yr-1and 0.09 g C (kg H2O)-1, respectively].The annual WUE of SG2 is 0.19 g C (kg H2O)-1less than that of SG1, which indicates that LULCC decreases the WUE.The trends in the different data indicate a significant upward trend in the WUE on the TP.We further analyzed the WUE trend values from different subregions and different plant functional types (PFTs), and found the largest trend values for the Brahmaputra [0.0049 g C (kg H2O)-1yr-1] and the forest [0.0142 g C (kg H2O)-1yr-1].LULCC causes the trend value of WUE to decrease [Table 2, the trend of WUE of SG2 is 0.0008 g C (kg H2O)-1yr-1less than that of SG1],and the CO2fertilization greatly improves the growth trend of WUE [Table 2, the trend of WUE of SG3 is 0.0023 g C(kg H2O)-1yr-1more than that of SG2].
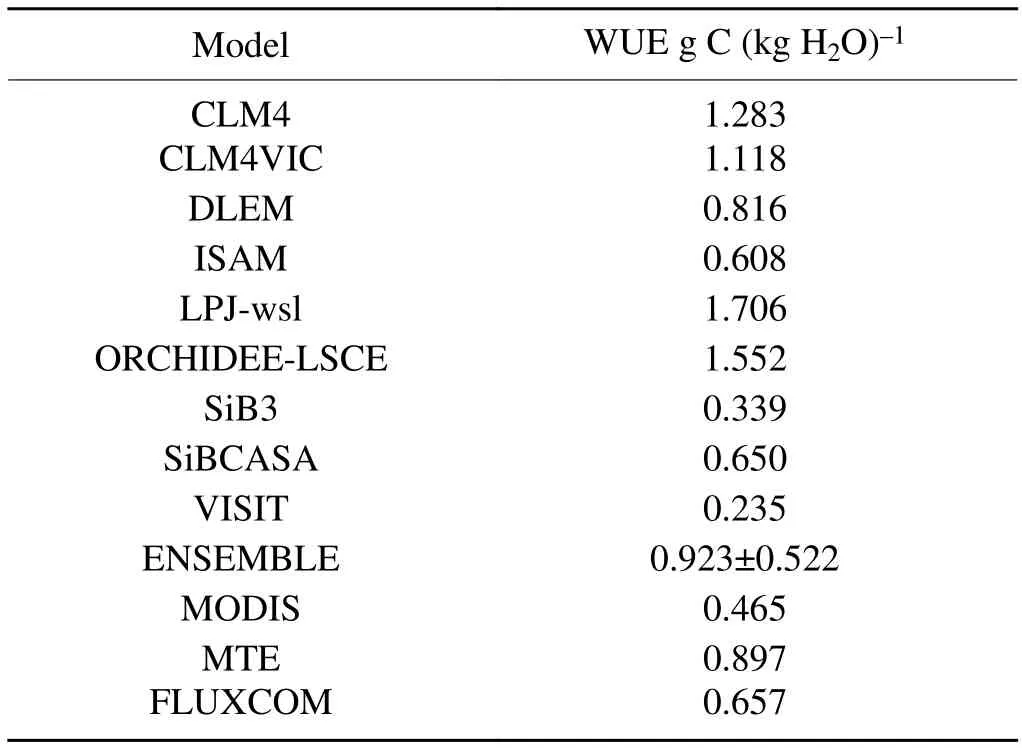
Table 1.Annual mean values from MsTMIP (SG3), MODIS,MTE, and FLUXCOM for the Tibetan Plateau (TP) from 2001 to 2010.
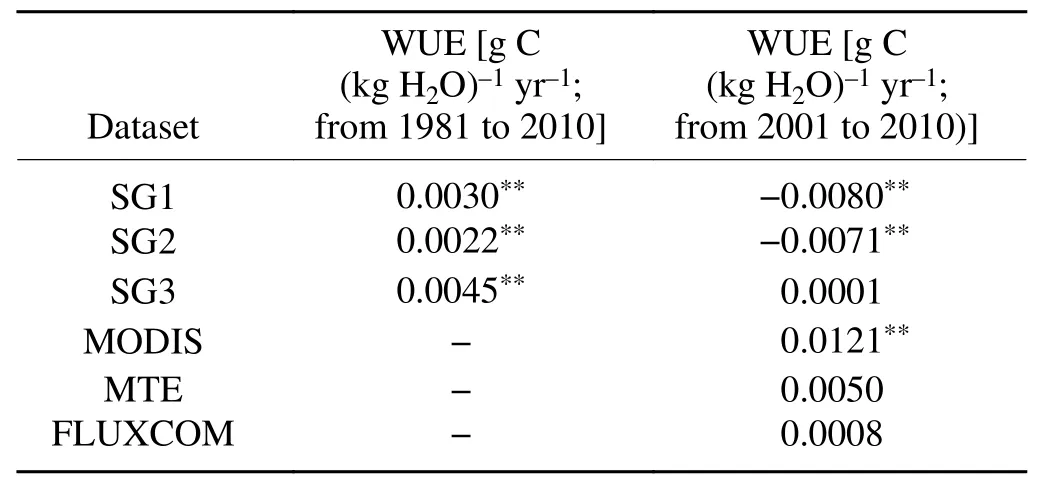
Table 2.The linear trends of WUE from the MODIS (from 2001 to 2010), MTE (from 2001 to 2010), FLUXCOM (from 2001 to 2010), and MsTMIP models (SG1, SG2, and SG3; from 1981 to 2010) on the TP.** indicates that the trends are statistically significant (p < 0.01).
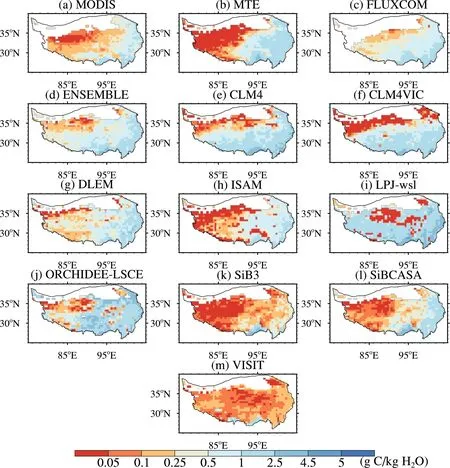
Fig.1.Annual mean water use efficiency (WUE) from the MODIS, MTE, FLUXCOM, and MsTMIP models (SG3 simulation) over the TP for 2001-10.ENSEMBLE is the ensemble mean of the nine MsTMIP models.
3.3.Impacts of climate factors, LULCC, and CO2 fertilization on WUE
Figure 3 shows the spatial distributions of the impacts of different climatic factors (temperature, precipitation, and radiation) on WUE.It is found that temperature dominates the change of WUE on the TP, and precipitation and radiation have little influence on WUE (Fig.3d).This indicates that WUE is mainly restricted by thermal conditions on the TP.The annual average temperature is low on the TP, and theincrease in temperature can alleviate the thermal stress of vegetation growth and increase the rate of photosynthesis(Chen et al., 2013; Xu et al., 2016).In the midwest and northwest of the TP, precipitation is the dominant factor and positively correlates with WUE.While in other areas, there is a negative correlation, similar to previous research (Guo et al.,2019; Fang et al., 2020).
Figure 4 shows the spatial distribution of the WUE response rate to LULCC on the TP from 1981 to 2010.The ENSEMBLE indicates that LULCC makes a negative contribution to WUE in most areas of the TP but a significant positive contribution to the central and northwestern areas.For single models, the percentage of the simulated WUE response to LULCC varies greatly among the models.We believe that it is caused by the great uncertainty in the impact of the different LULCC models on GPP and ET over the TP.For the whole TP, LULCC resulted in a decrease in the annual average WUE, with a contribution rate of-20.63%, especially on the eastern plateau.We find that the negative impact of LULCC on WUE is mainly due to the negative contribution of LULCC to GPP.
Figure 5 shows the response percentage of WUE to the CO2fertilization effect on the TP.All models indicate a positive effect of CO2fertilization on WUE in most areas of the TP.The positive effect is caused by the positive contribution of the CO2concentration change to GPP and the negative contribution to ET.For the whole TP, the annual average WUE showed a positive response to CO2fertilizatio- n (11.65%),but it was negative in the west and the northwest.It is worth noting that the positive contribution of the CO2fertilization effect can offset part of the decrease in WUE caused by LULCC, but both contributions are much smaller than that of climate change.
3.4.Impacts of LULCC and CO2 fertilization on ecosystem resilience
The ecosystem resilience represents the ability of anecosystem to sustain or recover its structure and functions with disturbances from hydroclimate.A resilient ecosystem could maintain or increase WUE to ensure its productivity in a water-limited environment due to drought.We further analyze the impact of human activities on the ecological resilience, which helps us understand how human activities affect the degree of carbon-water coupling under drought conditions.
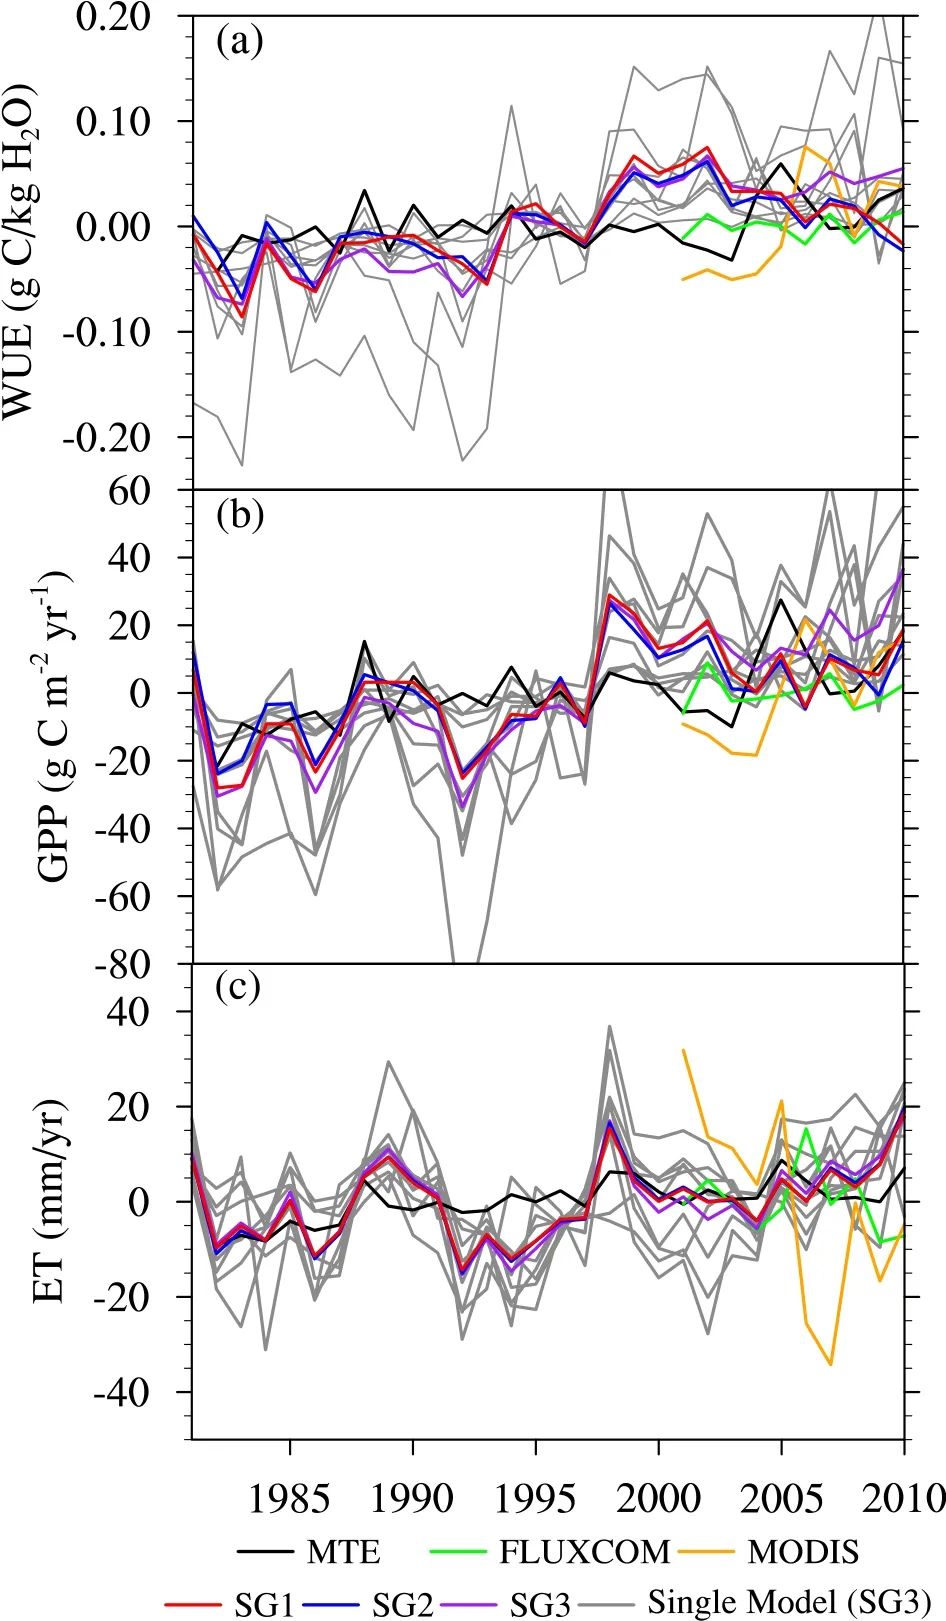
Fig.2.Interannual changes of WUE, gross primary productivity (GPP), and evapotranspiration (ET) from the MTE (black line), FLUXCOM (green line), MODIS (orange line), and the ensemble mean of the nine MsTMIP models:SG1 (red), SG2 (blue), SG3 (purple).The gray lines represent the variables of the single models from SG3.The anomalies were calculated as the difference between annual value and the long-term mean over the period for each data source.
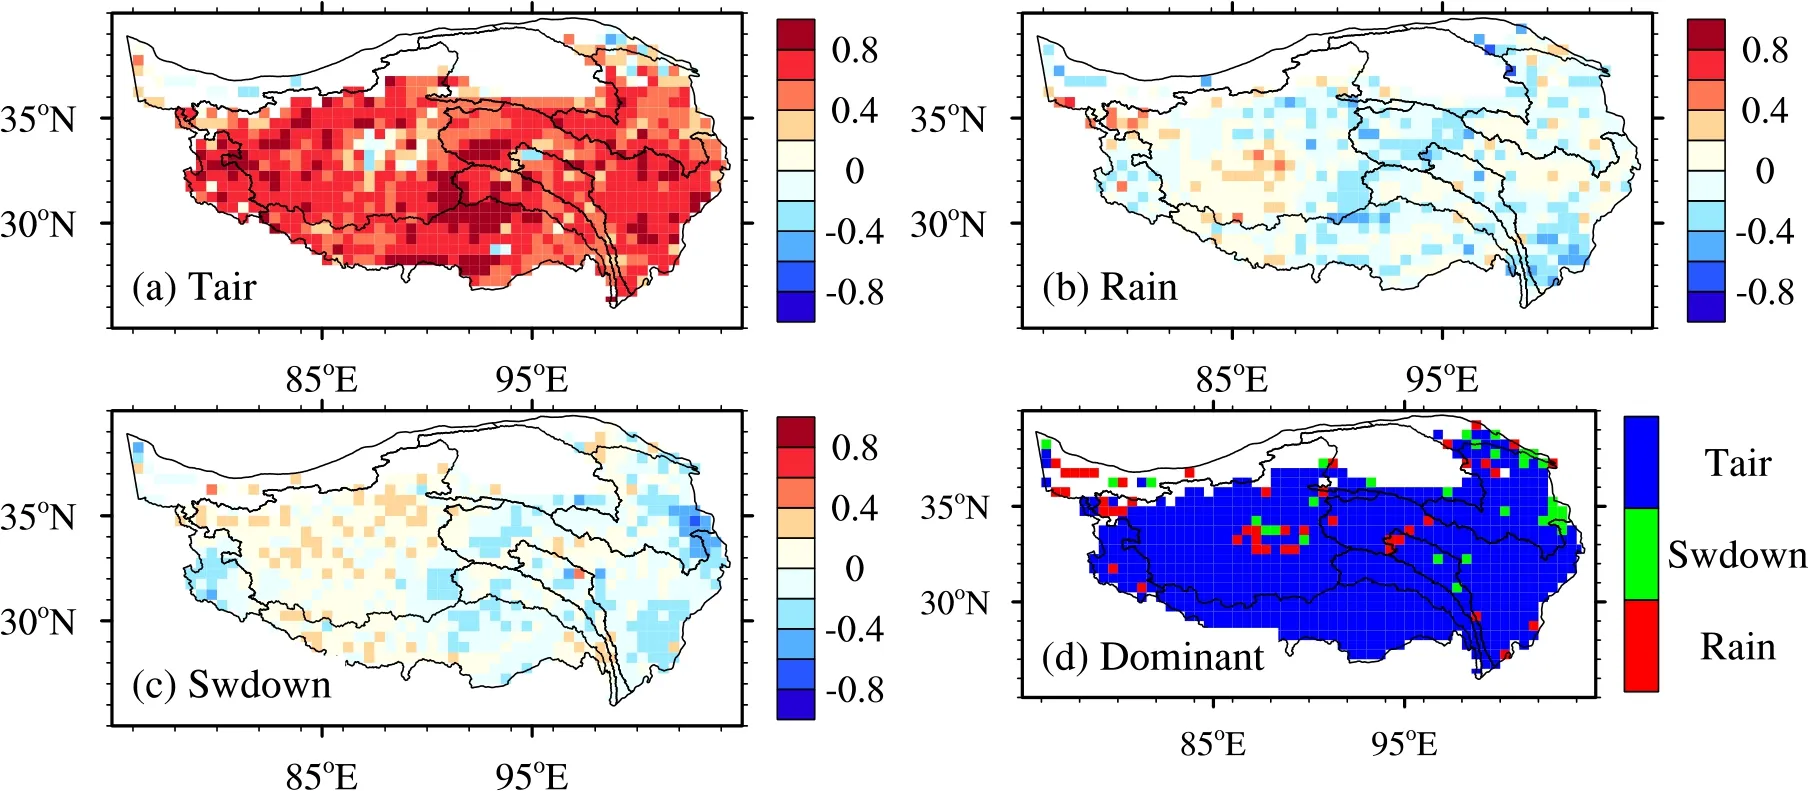
Fig.3.The spatial distributions of the impacts of (a) temperature, (b) precipitation, (c) incoming shortwave radiation,and (d) the dominant climatic factors on WUE from the MsTMIP models on the TP for 1981-2010.
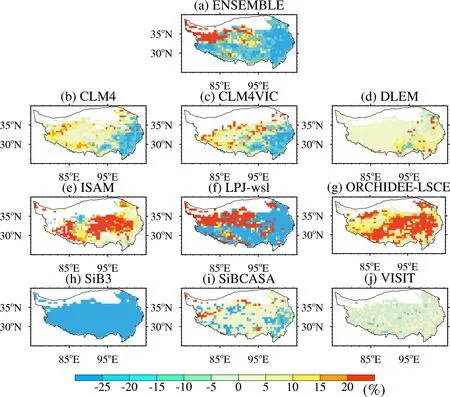
Fig.4.The spatial patterns of the WUE response rate (%) to land use and land cover change (LULCC) on the TP from 1981 to 2010.
Our research shows that the increase in atmospheric CO2concentration greatly increased the ecological resilience over the TP, while LULCC reduced the ecological resilience over the central TP (Fig.6).At the same time,studies have shown that as the climate warms and atmospheric CO2rises, the Qinghai-Tibet Plateau is becoming greener.Conversely, grasslands are more vulnerable to drought than other PFT.Our research shows that the effect of CO2fertilization can improve the ecological resilience of the TP meadow.
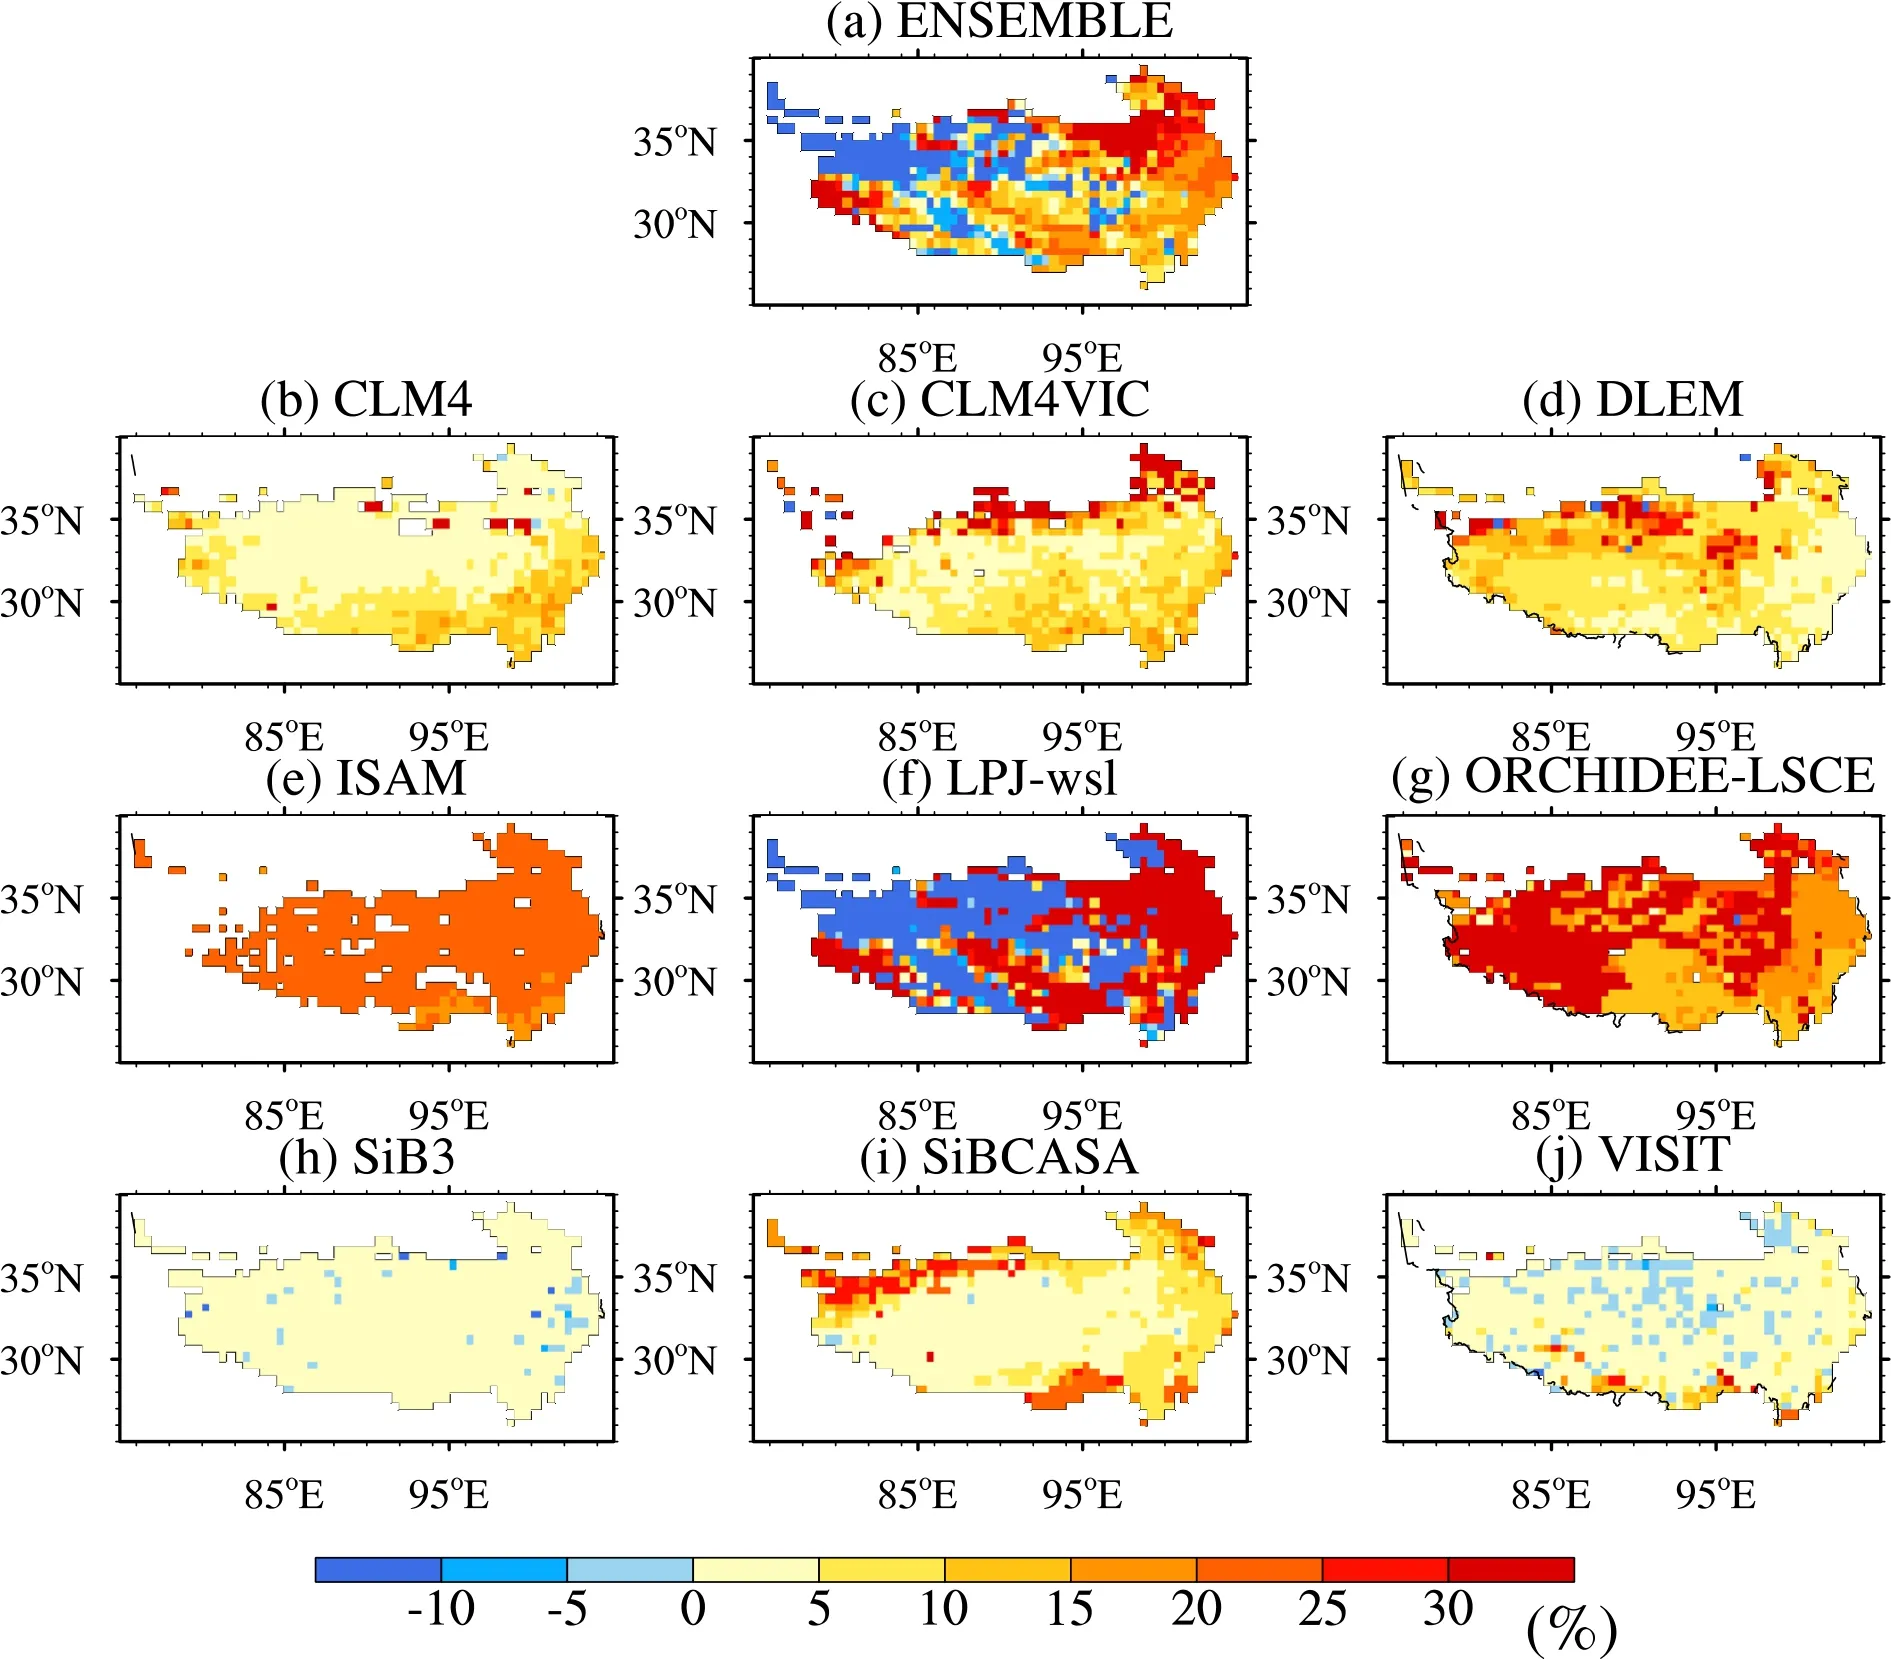
Fig.5.The spatial patterns of the WUE response rate (%) to the CO2 fertilization effect on the TP from 1981 to 2010.
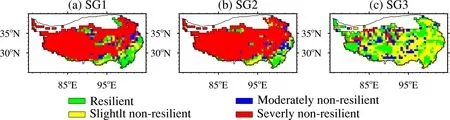
Fig.6.The spatial patterns of ecosystem resilience (Rd) to drought from the ensemble mean of the nine MsTMIP models(SG1, SG2, and SG3) for 1981-2010.Resilient: Rd ≥ 1; slightly non-resilient: 0.9 < Rd < 1; moderately non-resilient: 0.8 ≤Rd ≤ 0.9; and severely non-resilient: Rd < 0.8.
We further analyzed the impact of LULCC and CO2fertilization effects on WUE under drought years and average annual conditions.Under drought, the ecosystem WUE is clearly more sensitive to LULCC and CO2fertilization effects (Fig.7).
4.Discussion
4.1.Uncertainties
Uncertainty from the model structure is unavoidable,and multi-model ensembles are often used to represent uncertainty and the likelihood of predictions.It is difficult for a single model to predict the carbon-water cycle realistically.Using MsTMIP model ensembles can better reflect the actual uncertainty in ecosystem carbon-water cycle modeling(Huntzinger et al., 2013).On the other hand, we used the aggregate simulation results of nine terrestrial biosphere models (TBMs) to reduce the uncertainty of a single model simulation.Results of ENSEMBLE (the aggregate simulation results of nine TBMs), including the spatial pattern and linear trends of WUE (Fig.1 and Table 2), are consistent with the satellite-derived data.SG3 has a trend of 0.0045 g C (kg H2O)-1yr-1(p < 0.01, 1981-2010), which is similar to that[0.0038 g C (kg H2O)-1yr-1, 1999-2015] obtained by Wang et al.(2020).Therefore, our results are reliable and can reflect the influence of climate change and LULCC on the WUE on the TP, which can help us to understand the response of WUE to climate change and human activity and the coupling of the carbon and water cycles over the TP.In the future, it will be essential to improve the robustness of model simulation results by refining the ecosystem carbonwater coupling process.
4.2.Impacts of climate factors, CO2 fertilization, and LULCC
Figure 3 shows the multivariate linear relationship between climatic factors (temperature, precipitation, and radiation) and WUE.Temperature dominates the change of WUE on the TP, and precipitation and radiation have little influence on WUE.Fang et al.(2020) found that climate warming increased GPP and WUE on the TP, while the correlation between radiation and WUE was low.This indicates that WUE is mainly restricted by thermal conditions on the TP.Studies have shown that in the regions with small WUE values, temperature had a negative effect on WUE.The negative effects of wind speed and sunshine duration on WUE are greater than the positive effects of temperature (Li et al.,2017).Evans et al.(2018) thought that a warming climate will alter water resources in frigid regions.Climate warming leads to early snow melting, snow equivalent precipitation,and decreases in the duration and thickness of seasonally frozen soil, increasing the effective permeability of groundwater, promoting groundwater flow, and reducing shallow soil water content and ET.Conversely, the complementary correlation of ET holds that actual ET decreases with the increase of potential ET, and their sum is a constant value, which can also better explain the ET decrease caused by the temperature increase (Brutsaert, 2015; Wang et al., 2018; Ma et al.,2019).In addition, high correlations were observed between GPP and temperature in temperature-limited regions (i.e.,the TP, Yuan et al., 2021).The increasing temperature can alleviate the thermal stress of vegetation growth, increase the rate of photosynthesis, and significantly improve the primary productivity of the TP (Niu et al., 2011; Chen et al.,2013; Xu et al., 2016; Fang et al., 2020).In the midwest and northwest of the TP, precipitation is the dominant factor and is positively correlated with WUE, while in other areasthere is a negative correlation, which is similar to previous research (Guo et al., 2019; Fang et al., 2020).This indicates that the WUE water limit is mainly concentrated in the northwest of the TP.

Fig.7.The spatial patterns of WUEd (WUE in the driest year) and WUEm (the mean annual WUE) from the ensemble mean of the nine MsTMIP models (SG1, SG2, and SG3) for 1981-2010.
WUE is affected not only by climate change, but also by human activities.LULCC and increased atmospheric CO2concentrations are two important manifestations of human activities.On one hand, LULCC influences ET mainly through physical changes of the surface (Douglas et al., 2009; Dias et al., 2015).And changes between different land use patterns lead to changes in ET (Li et al., 2017).The negative impact of LULCC on GPP is mainly to reduce vegetation carbon turnover time (Xia et al., 2017).Increased WUE in the northwestern TP during 1981-2010 was mainly due to the fact that increased GPP overwhelmed the increase of ET across this area, while decreased WUE in most areas of the TP might be related to the reduction of GPP (figure not shown).44% of the proportion of shrubland for the grids in the northwest TP increased between 1981 and 2010, which probably caused the increase in GPP in this area.We also compared the annual changes in WUE between the SG2 and SG1.LULCC decreased WUE by 0.19 g C (kg H2O)-1from 1981 to 2010.And the increasing trend of WUE of SG2 is smaller than that of SG1 as described in section 3.2.On the other hand, the effect of CO2fertilization occurs mainly through the enhanced photosynthesis of ecosystem vegetation, thereby improving WUE and achieving better carbon-water coupling.And the effect of CO2fertilization had little effect on ET.Our results indicated that due to CO2fertilization, WUE increased in most areas of the TP (Fig.8c).GPP increased significantly and ET slightly decreased during this time period, which led to an increase in WUE except for the northwestern TP (figure not shown).WUE increased by 0.09 g C (kg H2O)-1during 1981-2010, equivalent to 11.65% of the annual average WUE in the TP.El Masri et al.(2019) thought that the small effect of CO2fertilization on ET was not caused by the difference between model evapotranspiration schemes,but by the assumptions of models.
4.3.Ecosystem resilience
Drought disturbance directly affects the transpiration process of vegetation and the evaporation process of soil and therefore affects the photosynthesis and WUE of vegetation(Zhao and Running, 2010; Teuling et al., 2013).Comparing WUEdand WUEm, WUEddecreased significantly in the dry years, especially in the northwest part of the TP (Figs.7a and 7b) that is covered with plateau grassland and showed the lowest WUE.Research shows that the growth and activity of grassland greatly depends on water supply, and the GPP is closely related to precipitation (Knapp et al., 2001; Ponce-Campos et al., 2013).However, the average annual precipitation here is very low, resulting in the lowest GPP and ET and therefore the lowest WUE (Liu et al., 2013a, b).During the driest years, the growth of grassland decreases, and GPP is more sensitive to drought than ET, leading to a higher decline rate of GPP than ET and a decrease in WUEd(Yang et al., 2016).As a result, WUEdis less than WUEmand Rdis less than 1, i.e., the local ecosystem is severely nonresilient (Figs.6a and 6b).
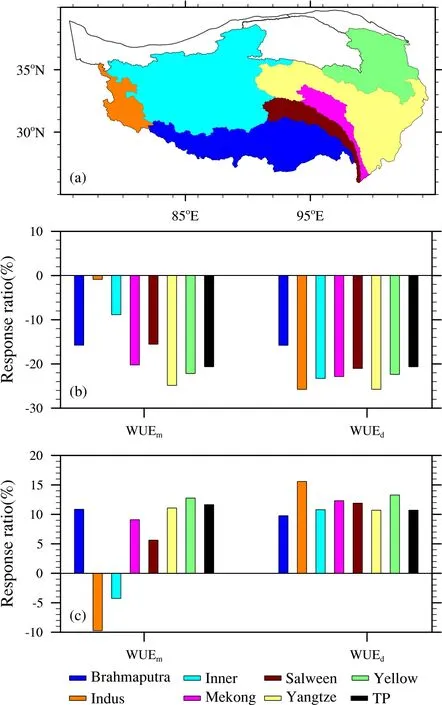
Fig.8.(a) The subregions over the Tibetan Plateau; the relative contribution of (b) the LULCC and (c) the CO2 fertilization effect on WUEm and WUEd in the MsTMIP models from 1981 to 2010.
However, we found that when CO2fertilization is taken into account, the ecosystem resilience is significantly increased, especially in the northwest part of the TP (Fig.6c).Comparing Figs.7c and 7f, WUEdand WUEmhave high values.This indicates that the CO2fertilization effect offsets the impact of drought on WUEd, which is consistent with the results of Liu et al.(2020).The increase of atmospheric CO2concentration can directly improve the photosynthesis of vegetation, and indirectly reduce ET by reducing stomatal conductance (Lavergne et al., 2019), which increases the ecosystem WUEd, offsets the negative impact of drought on WUEd, thereby achieving better carbon-water coupling, and improves ecosystem resilience (Fig.7c).For the subregions of the TP, the LULCC and CO2fertilization effects contribute more to WUEdthan WUEmin the western and northwestern regions (Fig.8).We believe that drought enhances the sensitivity of vegetation to environmental factors.That is to say,under drought conditions, the role of human intervention ismore significant.Therefore, in arid and semi-arid areas, we need to strengthen ecological restoration projects and reduce adverse human interventions.
5.Conclusions
Based on satellite-derived data and multi-model ensemble simulations, we analyzed the spatiotemporal variations of WUE on the TP.WUE shows a spatial pattern decreasing from southeast to northwest on the TP and an overall increasing trend from 2001 to 2010, especially in Brahmaputra and in the forest.We also investigated the impacts of climate change, LULCC, and CO2fertilization on WUE from 1981 to 2010.Temperature dominates the change in WUE in most areas of the TP, and precipitation and radiation have little influence on the interannual change of WUE.In addition,LULCC causes WUE to have a downward trend, while CO2greatly enhances the increase in WUE.The contribution of LULCC and CO2fertilization in the eastern part of the plateau was significantly greater than that in other regions.
Acknowledgements.This work was supported by the Second Tibetan Plateau Scientific Expedition and Research Program(STEP) (Grant No.2019QZKK0206), the Strategic Priority Research Program of Chinese Academy of Sciences (Grant No.XDA20100300), the Youth Innovation Promotion Association CAS (2021073), the National Key Scientific and Technological Infrastructure project “Earth System Science Numerical Simulator Facility” (EarthLab), the Natural Science Foundation of Hunan Province (Grant No.2020JJ4074), and the Open Fund Project of Key Lab of Virtual Geographic Environment (Nanjing Normal University), Ministry of Education (2021VGE04).
杂志排行
Advances in Atmospheric Sciences的其它文章
- Understanding the Development of the 2018/19 Central Pacific El Niño
- Alternation of the Atmospheric Teleconnections Associated with the Northeast China Spring Rainfall during a Recent 60-Year Period
- The Importance of the Shape Parameter in a Bulk Parameterization Scheme to the Evolution of the Cloud Droplet Spectrum during Condensation
- Estimation of Lightning-Generated NOx in the Mainland of China Based on Cloud-to-Ground Lightning Location Data
- Circulation Patterns Linked to the Positive Sub-Tropical Indian Ocean Dipole
- Multi-scale Incremental Analysis Update Scheme and Its Application to Typhoon Mangkhut (2018) Prediction