基于三脚架羧酸和咪唑基配体的两种镉基配合物的合成、结构与荧光性质
2023-02-03陈鲁园侯向阳王记江
唐 龙 陈鲁园 侯向阳 王 潇 王记江
(1延安大学新能源与新功能材料重点实验室,延安大学化学与化学工程学院,陕西化学反应工程重点实验室,延安 716000)
(2陕西精艺化工有限公司,榆林 719300)
0 Introduction
Metal‑organic coordination polymers(MOCPs)of mixed‑ligand assembly have become a very attractive research field[1‑4].Due to its many advantages,it has applications in many fields,such as absorption,hetero‑geneous catalysis,electrochemistry,ion exchange,and fluorescence sensing[5‑8].The mixed ‑ligand strategy by the judicious choice of various organic linkers has been proven to be high‑efficient for the construction of MOCPs.Among such systems,the most outstanding is the incorporation of polycarboxylates and N‑donors co‑ligands,which has successfully been utilized to generate more diverse and interesting polymeric net‑works with potential properties and contributes to refin‑ing our knowledge of self‑assembly processes[9‑11].Within polycarboxylate ligands,aromatic polycarboxyl compounds have extensively been documented as mul‑tifunctional structures,owing to their versatile linking capability by virtue of both covalent bonding and supra‑molecular interactions[12‑14].Luminescent metal‑organic coordination polymers(LMOCPs)are a very important branch of MOCPs.At present,lots of studies have proved that LMOCPs as fluorescent sensors are feasi‑ble and effective in detecting pollutants.LMOCPs gen‑erally emit light in the following ways:organic ligands emit light,and the charge transfer between metal ions and ligands can emit light[15‑17].The tunable structures and properties of cadmium ‑based coordination poly‑mers provide an important advantage to fluorescence sensing materials.
In our strategy,multidentate O‑or N‑donor ligands have also been employed in the construction of coordi‑nation polymers(CPs).Among the family of organic carboxylate,tripodal carboxylate shows more superiori‑ty,the ligand 4,4′,4″‑s‑triazine‑2,4,6‑tribenzoic acid(H3tatb)as a class example of tripodal ligands has been utilized,and some MOCPs based on H3tatb have also been investigated[18‑21].To explore the influence of N ‑donor ligands on achieving different dimensional and topological structures based on tripodal carboxylate ligands,we also employ 1,4‑bis(imidazole‑1‑ylmethyl)benzene(1,4‑bimb)and 1,4‑bis(1‑imidazoly)benzene(1,4‑bib)with different conformations as co‑ligands.Two cadmium‑based CPs,[Cd(Htatb)(1,4‑bimb)]·H2O(1)and[Cd(Htatb)(1,4‑bib)(H2O)]·DMF(2),were synthe‑sized and characterized.In addition,their fluorescent properties were also investigated.
1 Experimental
1.1 Materials and chemical analysis
The H3tatb,1,4‑bimb,and 1,4‑bib ligands were purchased in the Jinan Henghua Sci.&Technol.Co.,Ltd.All other reagents and solvents employed were commercially available and used without further purifi‑cation.Elemental analyses were performed with a Perkin‑Elmer 2400 CHN Elemental analyzer.Infrared spectra on KBr pellets were recorded on a Nicolet 170SX FT‑IR spectrophotometer in a range of 400‑4 000 cm-1.Thermogravimetric(TG)analyses were con‑ducted with a Nietzsch STA 449C micro analyzer under the atmosphere at a heating rate of 5℃·min-1.Powder X‑ray diffraction(PXRD)patterns were recorded on a Shimadzu XRD‑7000 diffractometer analyzer.The working voltage was 40 kV,the current was 40mA,the radiation source was CuKα(λ=0.154 18 nm),and the scanning range was 20°‑80°.The fluorescence spectra were obtained using a Hitachi F‑7100 fluorescence spectrophotometer at room temperature.
1.2 Synthesis of CP 1
A mixture of Cd(NO3)2·4H2O(0.1 mmol,0.031 g),H3tatb(0.1 mmol,0.044 g),1,4‑bimb(0.1 mmol,0.024 g)and 8 mL DMF‑H2O(1∶1,V/V)was stirred for 30 min in the air.The mixture was then transferred to a 20 mL airtight glass reactor and kept at 100℃for 5 d under autogenous pressure,and then cooled to room temperature at a rate of 5℃·h-1.Colorless crystals of 1 were obtained and washed with DMF and dried in the air(Yield:49% based on Cd).Elemental analysis Calcd.for C38H29N7O7Cd(% ):C,56.48;H,3.62;N,12.13.Found(% ):C,56.62;H,3.72;N,12.24.IR data(KBr,cm-1):3 424(w),3 108(s),1 719(s),1 656(w),1 581(w),1 522(vs),1 364(m),1 122(w),1 063(m),1 013(w),933(w),822(m),766(s),647(w).
1.3 Synthesis of CP 2
The preparation of 2 was the same as that of 1 except using 1,4‑bib ligand(0.1 mmol,0.021 g)instead of 1,4‑bimb.Colorless crystals of 2 were obtained and washed with DMF and dried in the air(yield:51% based on Cd). Elemental analysis Calcd. for C39H32N8O8Cd(% ):C,54.91;H,3.78;N,13.13.Found(% ):C,54.83;H,3.87;N,13.21.IR data(KBr,cm-1):3 429(w),3 122(w),1 713(m),1 655(w),1 540(m),1 516(vs),1 401(m),1 362(s),1 237(m),1 112(m),1 088(m),1 016(m),939(w),833(m),771(s),650(w).
1.4 X‑ray crystallographic studies
Diffraction intensities for CPs 1 and 2 were col‑lected at 293 K on a Bruker SMART 1000 CCD diffrac‑tometer employing graphite‑monochromated MoKαradiation(λ=0.071 073 nm).A semi‑empirical absorp‑tion correction was applied using the SADABS pro‑gram[22].The structures were solved by direct methods and refined by full‑matrix least‑squares onF2using the SHELXS 2014 and SHELXL 2014 programs,respectively[23‑24].Non ‑hydrogen atoms were refined anisotropically and hydrogen atoms were placed in geo‑metrically calculated positions and refined using a rid‑ing model.The crystallographic data for CPs 1 and 2 are listed in Table 1,and selected bond lengths and angles are listed in Table S1(Supporting information).
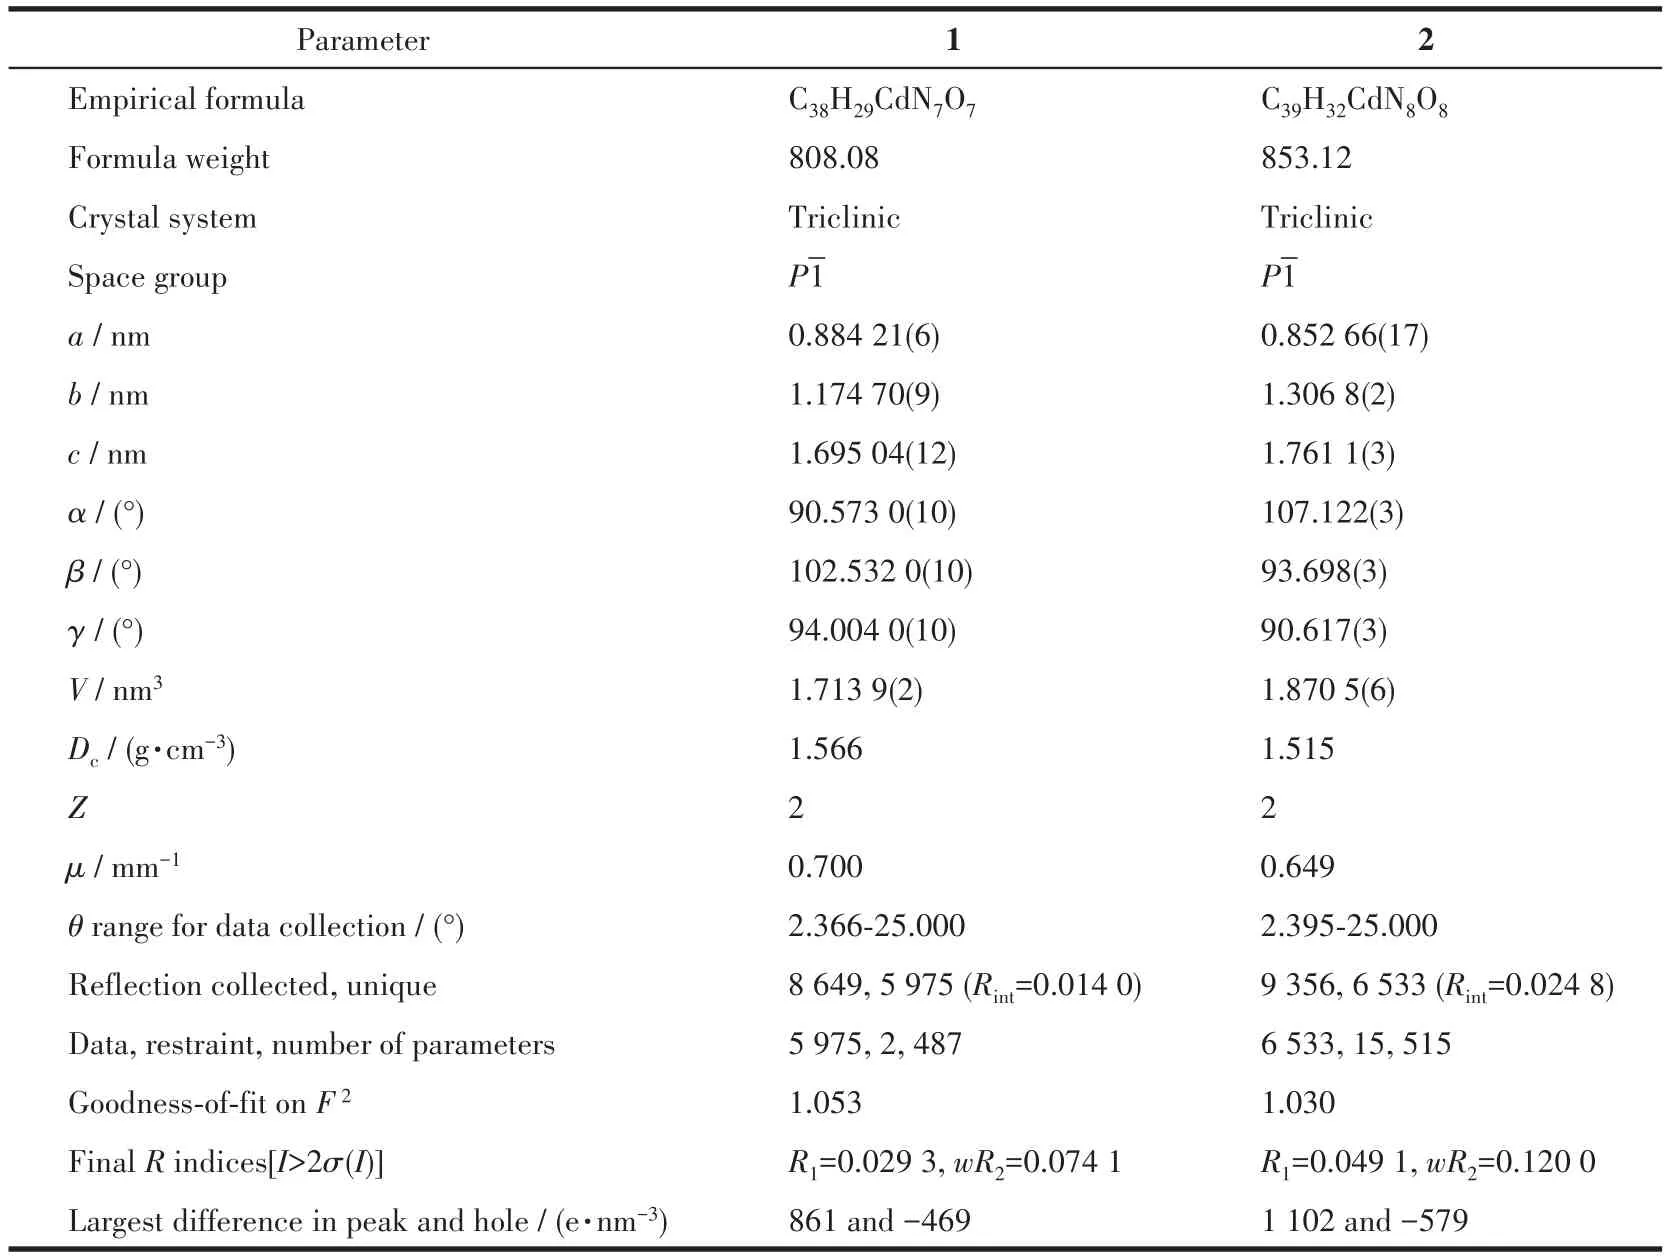
Table 1 Crystal data and structural refinement summary of CPs 1 and 2
CCDC:2178172,1;2178173,2.
2 Results and discussion
2.1 Description of the structure
2.1.1 Crystal structures of CP 1
Single‑crystal X‑ray analysis reveals that CP 1 exhibits a 4‑fold interpenetrating 3D structure.The asymmetric unit of 1 comprises one CdⅡion,one Htatb2-ion,one 1,4‑bimb molecule,and one free water molecule.Each five‑coordinated CdⅡcenter is sur‑rounded by two nitrogen atoms coming from two 1,4‑bimb molecules,and three oxygen atoms from two Htatb2-ions,taking a distorted square pyramidal geom‑etry(Fig.1).The bond lengths of Cd—O/N are in a range of 0.220 25(18)‑0.244 1(2)nm,and the O/N—Cd—O/N bond angles cover a range of 53.80(8)°‑134.41(9)°.In CP 1,the tripodal carboxylate ligands are partly deprotonated and one carboxylate group adoptsμ1‑η1‑η0to link one CdⅡion,and another one adoptsμ1‑η1‑η1chelating mode to link one CdⅡion,resulting in a 1D chain structure,further through 1,4‑bimb ligand bridging,the adjacent chains are connect‑ed to generate a 2D layer structure(Fig.2).These 2D layers are further joined by O—H…O hydrogen bond‑ing(O6…O2 distance:0.257 8(3)nm,O6—H6…O2 angle:162.3(4)°)to produce a 3D architecture(Fig.3).To simplify the 3D framework,we considered the Htatb2-anion as a 3‑connected node and CdⅡion as a 5‑connected node,1,4‑bimb ligand as linkers,and topological analysis by TOPOS program suggests that the 3D framework can be simplified as a 3,5‑connected net with a point symbol of(3·72)(32·75·83)(Fig.S1).However,due to the absence of large guest molecules to fill the void space,the potential voids are filled via mutual interpenetration of three independent equiva‑lent frameworks,generating a four‑fold interpenetrating 3D architecture(Fig.4).
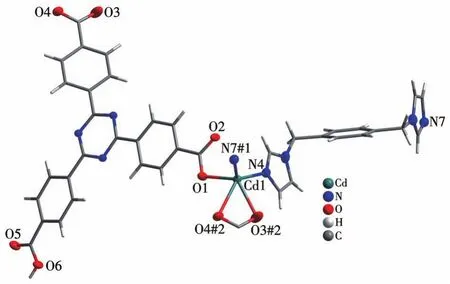
Fig.1 Coordination environment of Cdion in CP 1
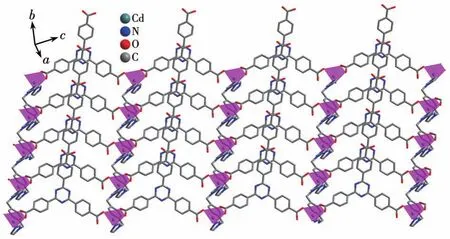
Fig.2 Two‑dimensional layer structure of CP 1
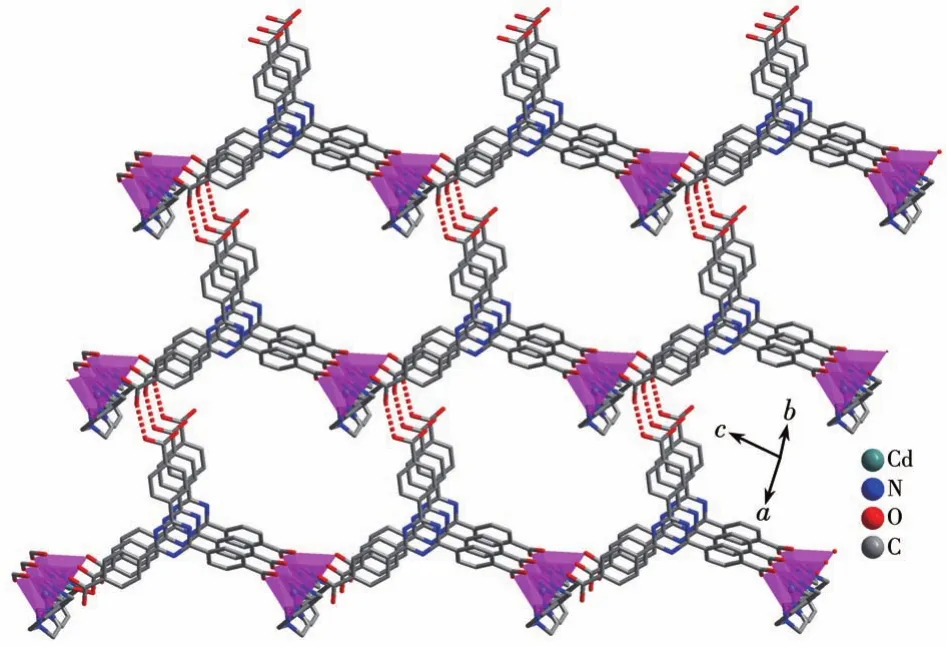
Fig.3 Three‑dimensional architecture of CP 1
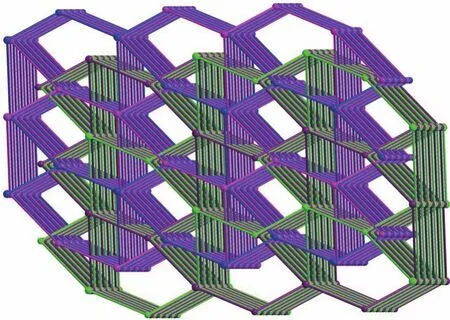
Fig.4 Four‑fold interpenetrating 3D architecture of CP 1
2.1.2 Crystal structures of CP 2
CP 2 shows a 2‑fold interpenetrating 3D structure.Each seven‑coordinated CdⅡion is located in a[CdO5N2]distorted pentagonal bipyramid geometry and is coordinated to five oxygen atoms of two Htatb2-ions and a coordination water molecule,and two nitrogen atoms of two 1,4‑bib molecules,as shown in Fig.5.The bond lengths of Cd—O and Cd—N are in a range of 0.225 1(4)‑0.263 7(3)nm,these bond lengths are simi‑lar to those found in related cadmium‑based coordina‑tion polymers[25].Compared with CP 1,the carboxylic groups of 2 adoptμ1‑η1‑η1andμ1‑η1‑η1chelating mode to link CdⅡions,resulting in a 1D chain structure(Fig.S2),and through 1,4‑bib ligand bridging,the adjacent chains are connected to generate a 2D layer structure(Fig.6).These 2D layers are further joined through O—H…O hydrogen bonding(O5…O2 distance: 0.259 7(5)nm,O5—H5…O2 angle:161.76(4)°)to produce a 3D architecture(Fig.S3).Topological analysis by the TOPOS program suggests that the 3D framework can be simplified as a 3,5‑connected net with a point sym‑bol of(3·72)(32·75·83)(Fig.7).It is noteworthy that there are large open channels in CP 2.It is apt to form interpenetrating frameworks,accordingly,the final structure of CP 2 is a two‑fold interpenetrating 3D framework(Fig.8).
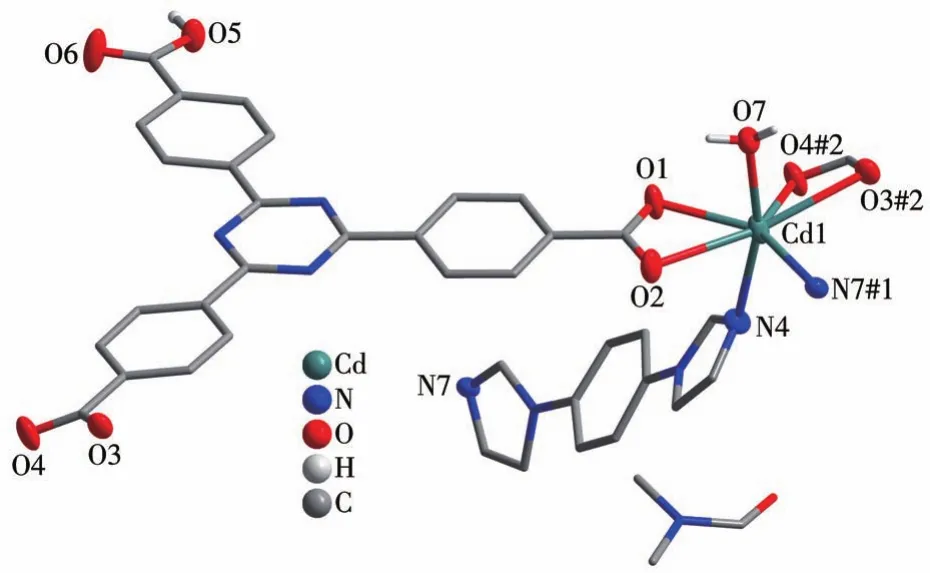
Fig.5 Coordination environment of Cdion in CP 2
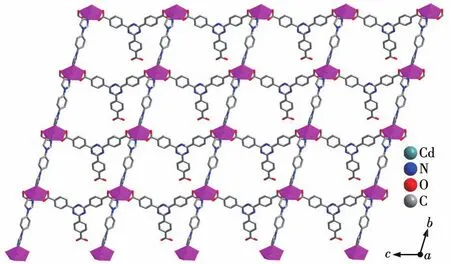
Fig.6 Two‑dimensional layer structure of CP 2

Fig.7 3,5‑connected net topology of CP 2

Fig.8 Two‑fold interpenetrating 3D architecture of CP 2
2.2 TG analysis
The experimental diffraction patterns featured peaks that are almost consistent with the simulated pat‑terns,indicating that the products are almost pure phases(Fig.S4 and S5).To study the thermal stability of CPs 1 and 2,TG analyses were performed on the polycrystalline samples under a nitrogen atmosphere(Fig.S6 and S7).TG curve of 1 revealed that the first weight loss of 2.4% from 50 to 110℃corresponds to the loss of the lattice water molecules(Calcd.2.23% ),and then the larger weight loss(Obsd.84.3% )occurred in a range of 240‑490 ℃,corresponding to the decom‑position of the Htatb2-and 1,4‑bimb ligands(Calcd.83.86% ).The TG curve of 2 showed two‑step weight losses.The first weight loss in a range of 60‑170 ℃(Obsd.10.9% ,Calcd.10.68% )is assignable to the loss of DMF and coordination water molecules.The second weight loss of 76.4% in a temperature range of 240‑460℃corresponds to the release of the Htatb2-and 1,4‑bib ligands(Calcd.76.14% ).The final decomposi‑tion products of 1 and 2 were confirmed to be CdO,which has also been further confirmed by the PXRD patterns of the CPs.
2.3 Infrared spectra of CPs 1 and 2
IR spectra of CPs 1 and 2 showed features attrib‑utable to compositions of the coordination polymers(Fig.S8 and S9).The observed strong characteristic peaks appearing around 3 424 and 3 429 cm-1in spec‑tra are attributed to the O—H stretching vibrations,respectively.Due to partial deprotonation of carboxyl‑ate in 1 and 2,the absorptions of about 1 719 and 1 713 cm-1can be attributed to the stretching vibrations of theνCOOHin the carboxylate.The presence of the char‑acteristic bands at 1 656 and 1 655 cm-1for 1 and 2 suggests theν—C=N—stretching vibrations of Htatb2-ion.The intense characteristic peaks appearing around 1 581 and 1 522,1 364 cm-1for 1,1 540 and 1 516,1 401 cm-1for 2 in the IR spectra correspond to asym‑metric and symmetric stretching vibrations of carboxyl‑ic groups,respectively.The presence of the characteris‑tic bands at 1 122 and 1 112 cm-1for 1 and 2 suggests theνC—Ostretching vibrations.The presence of the char‑acteristic bands at 1 063 cm-1for 1 and 1 088 cm-1for 2 suggests theνC—Nstretching vibrations of the imidaz‑ole ring.The absorptions of 640‑850 cm-1of 1 and 2 can be attributed to theγC—Hout‑of‑plane bending vi‑bration of the phenyl ring.
2.4 Photoluminescence properties
The luminescent emission spectra of CPs 1 and 2 were examined in the solid state at room temperature as shown in Fig.9.The main emission peak of the free H3tatb appeared at 454 nm(λex=364 nm),which can be assigned to the intra‑ligandπ*‑πtransitions[26].CP 1 showed a strong emission peak at 409 nm(λex=369 nm),however,the intense emission of 1,4‑bimb was observed at 473 nm(λex=400 nm),respectively.Rela‑tive to their ligands,1 showed a blue shift,probably owing to ligand ‑to‑metal charge transfer(LMCT)[27‑28].CP 2 showed an emission peak at 394 nm(λex=334 nm),in comparison with that of free H3tatb and 1,4‑bib(an intense emission at 398 nm withλex=306 nm),which are attributed to H3tatb or 1,4‑bib ligand‑based charge transfer[29‑30].
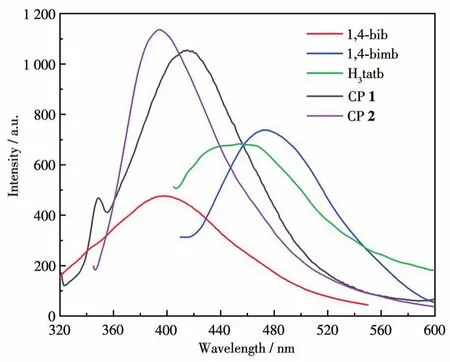
Fig.9 Emission spectra of the ligands and CPs 1,2
2.5 Detection of nitroaromatic compounds
The luminescent responses of CPs 1 and 2 were investigated by treating suspensions(2 mg dispersed in 2 mL aqueous solution)with 50 μmol·L-1different ana‑lytes such asp‑nitrobenzoic acid(p‑NBA),m‑nitroani‑line (m‑NA),o‑nitroaniline (o‑NA),o‑nitrophenol(o‑NP),p‑nitrophenol(p‑NP),p‑nitrophenylhydrazine(p‑NPH),nitrobenzene(NB),2,4‑dinitrophenylhydra‑zine(2,4‑DNPH),2,4,6‑trinitrophenol(2,4,6‑TNP),and 2,4,6‑trinitrophenyl hydrazine(2,4,6‑TNPH),respec‑tively.Among these nitroaromatic compounds,NB almost quenched the luminescent intensity of1(Fig.10).The result indicates that 1 may be regarded as a potential luminescent sensor for detecting NB.The luminescent intensities gradually decreased with the increasing concentration of NB.The best quenching efficiency observed for NB was calculated to be 99.17% upon incremental addition of 0 ‑400 μL 1 mmol·L-1NB solution(Fig.11).To further analyze the luminescent titration results,the Stern ‑Volmer equa‑tion:I0/I=1+KsvcNBwas used to calculate the lumines‑cence quenching constant,in whichI0andIare the luminescence intensities before and after the addition of NB,Ksvis the quenching constant(L·mol-1),andcNBis the concentration of NB (mmol·L-1),respective‑ly[31‑32].At low concentrations,the Stern‑Volmer curves displayed an almost linear relationship,and the linear equation wasI0/I=0.851 58+148.684 9cNB.TheKsvfor NB was calculated to be 1.49×10⁵L·mol-1(Fig.12).The Stern‑Volmer curve deviated from the linear corre‑lation when the concentration increased,demonstrating the simultaneous involvement of both the static and dynamic quenching process.Further detailed analysis denoted that the LOD(limit of detection)was 0.197 μmol·L-1according to 3σ/k(σandkrepresent the standard error and slope,respectively)[33‑34].

Fig.10 Fluorescent spectra(left)and fluorescent intensities(right)of CP 1 dispersed in aqueous solutions of different nitroaromatic analytes
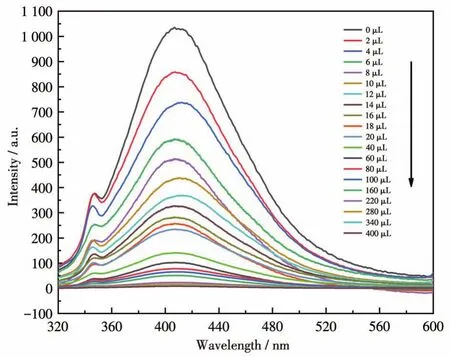
Fig.11 Fluorescence response of CP 1 upon incremental addition of 1 mmol·L-1NB in aqueous solutions
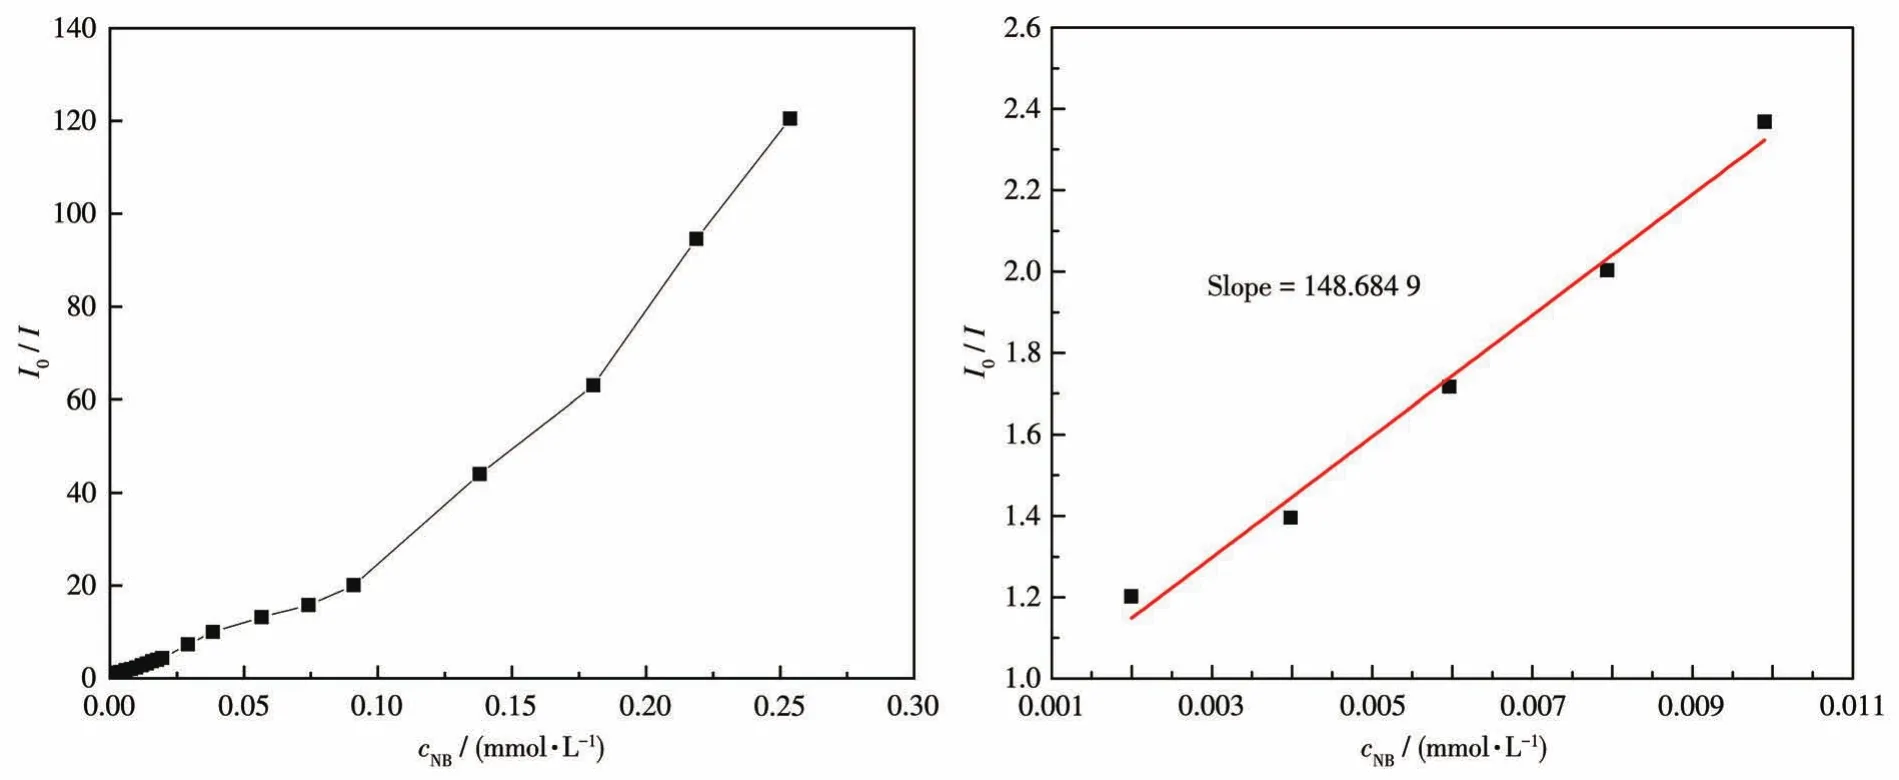
Fig.12 Stern‑Volmer plot of I0/I vs cNBin the aqueous dispersion of CP 1(left);The area enlarged view for linearity of the plot at lower concentrations of NB(right)
In the fluorescence titration,emission profiles of CP 2 showed selective and significant quenching for 2,4,6‑TNP,and relatively low quenching was observed for other nitroaromatic analytes(Fig.13).The best quenching efficiency observed for 2,4,6‑TNP was cal‑culated to be 99.76% upon incremental addition of 0‑80 μL 1 mmol·L-12,4,6‑TNP solution(Fig.14).When the concentration of 2,4,6‑TNP is as low as 0.074 mmol·L-1,the luminescent intensity of 2 is completely quenched by 2,4,6‑TNP.As shown in Fig.15,good lin‑earity of the plot at low concentrations of 2,4,6‑TNP was observed which fitted well with the Stern‑Volmer equation(I0/I=0.536 92+468.319 7cTNP).High fluores‑cence quenching efficiency was proved by the high Stern ‑Volmer quenching constant(Ksv=4.68×10⁵L·mol-1),and further detailed analysis denoted that the LOD was 0.062 6 μmol·L-1.However,a nonlinear curvature at higher concentrations of 2,4,6‑TNP was obtained.The nonlinear nature of the Stern‑Volmer plot of 2,4,6‑TNP can be attributed to self‑absorption,a combination of static and dynamic quenching,or an en‑ergy‑transfer process between 2,4,6‑TNP and 2[35‑36].
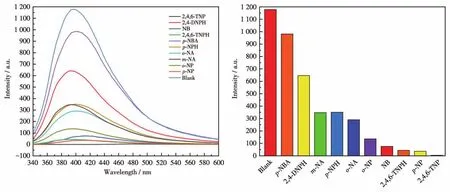
Fig.13 Fluorescent spectra(left)and fluorescent intensities(right)of CP 2 dispersed in aqueous solutions of different nitroaromatic analytes

Fig.14 Fluorescence response of CP 2 upon incremental addition of 1mmol·L-12,4,6‑TNP in aqueous solutions
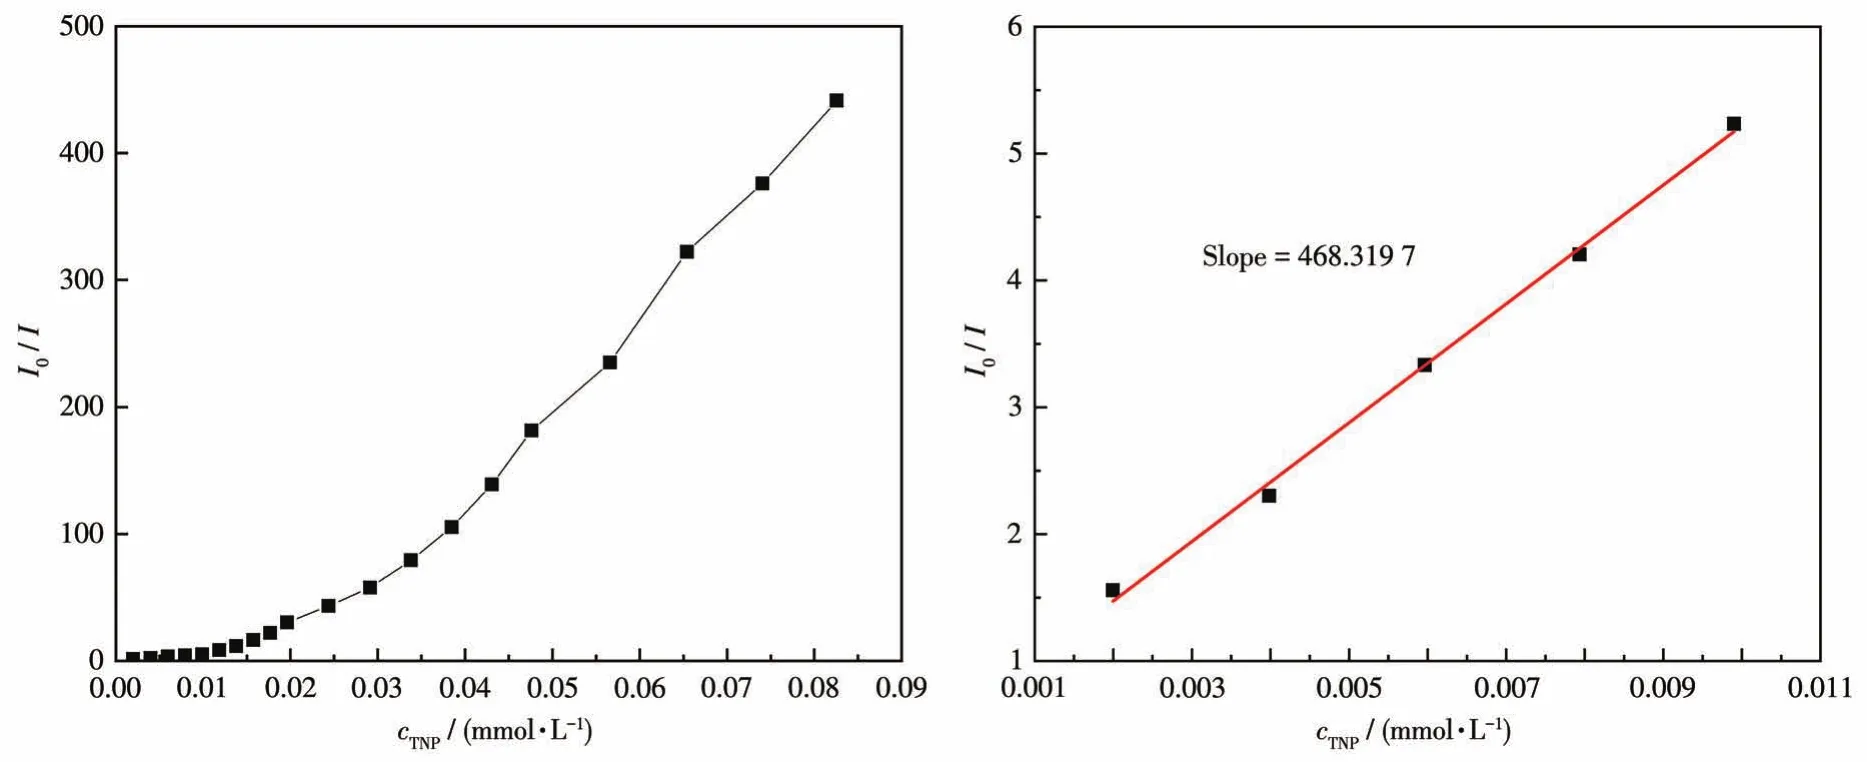
Fig.15 Stern‑Volmer plot of I0/I vs c2,4,6‑TNPin the aqueous dispersion of CP 2(left);The area enlarged view for linearity of the plot at lower concentrations of 2,4,6‑TNP(right)
2.6 Detection of metal ions
To examine the potential of CP 1 for sensing metal ions,changes in the fluorescence intensity of 1 dis‑persed in water on the addition of different metal ions,including Na+,K+,Mg2+,Ca2+,Ba2+,Al3+,Fe3+,Co2+,Ni2+,Cu2+,Zn2+,Cd2+,Ag+,Pb2+,and Hg2+in aqueous solutions,were investigated(Fig.16).Among these met‑al ions aqueous solutions,high fluorescence quenching of the luminescent intensity of 1 was observed in Fe3+aqueous solution.To further study how the presence of non‑Fe3+metal cations affected the recognition of 1 to Fe3+ions,all previously tested metal cations were ana‑lyzed again by adding to the solution of 1 containing Fe3+.The fluorescence spectra produced by these new mixtures are shown in Fig.17.From these results,it can be seen that the emission intensity of 1 and Fe3+was subject to fluctuation when in the presence of the testing cations.However,these fluctuations were deemed mostly minor concerning relative percent change,therefore,the conclusion shows that 1 still retains significant selectivity for the recognition of Fe3+ions even in the matrix containing all cations tested[37].The luminescent intensities gradually decreased with the increasing concentration of Fe3+,and the best quenching efficiency observed for Fe3+was calculated to be 97.92% upon incremental addition of 0 ‑160 μL 1 mmol·L-1Fe3+solution(Fig.18).As shown in Fig.19,good linearity of the plot at low concentrations of Fe3+was observed which fitted well with the Stern‑Volmer equation(I0/I=1.063 76+82.839 7cFe3+).High fluores‑cence quenching efficiency was proved by the high Stern ‑Volmer quenching constant(Ksv=8.28×10⁴L·mol-1),and further detailed analysis denoted that the LOD was 0.354 μmol·L-1.However,a nonlinear curva‑ture at higher concentrations of Fe3+was obtained,revealing that both dynamic and static quenching take place.
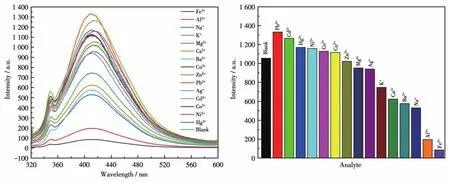
Fig.16 Fluorescent spectra(left)and fluorescent intensities(right)of CP 1 dispersed in aqueous solutions with various metal cations
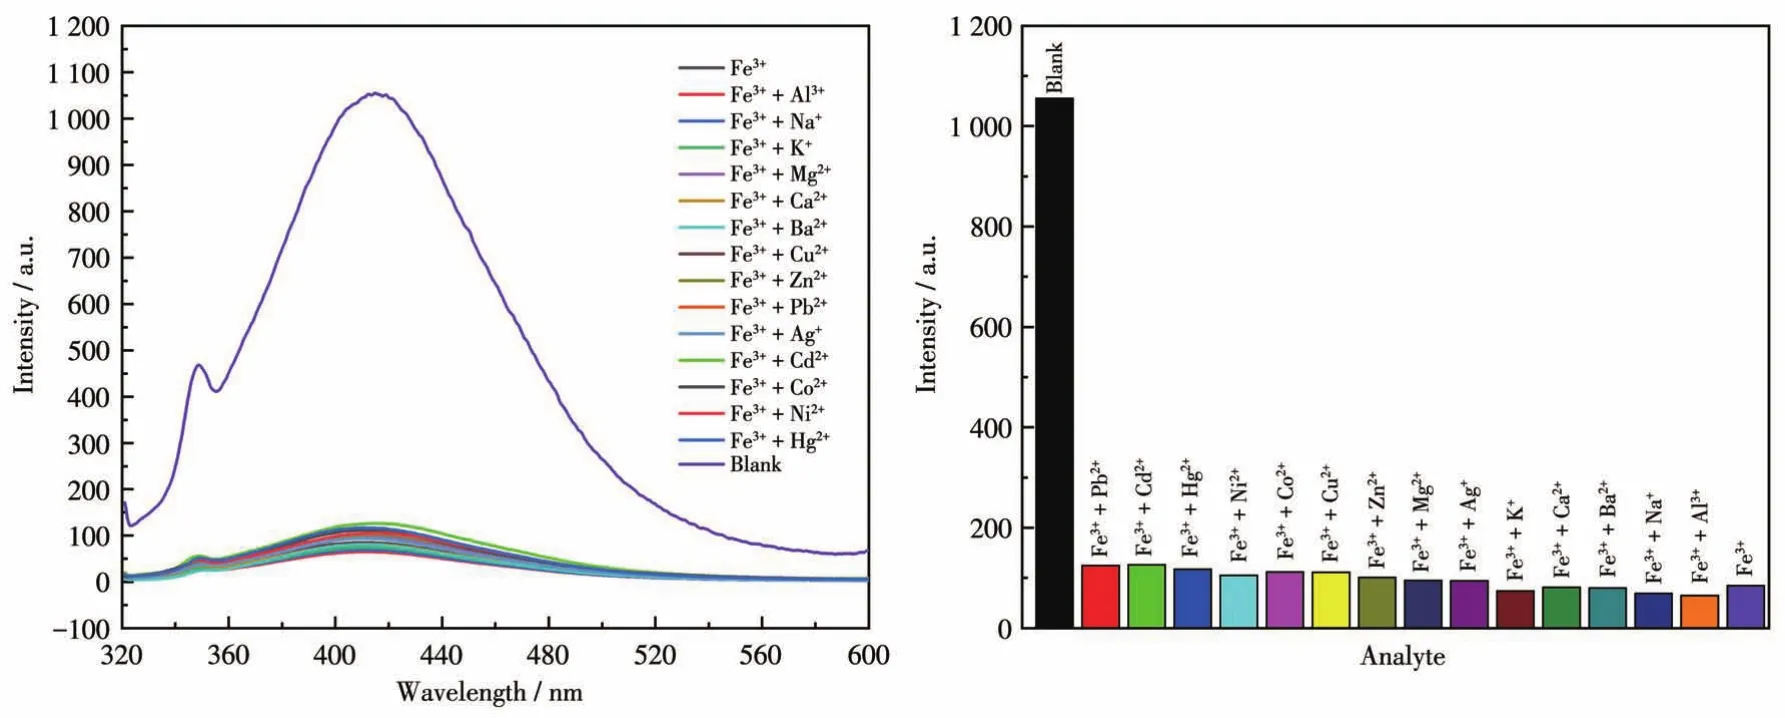
Fig.17 Fluorescent spectra(left)and fluorescent intensities(right)of CP 1 and Fe3+in the presence of other cations
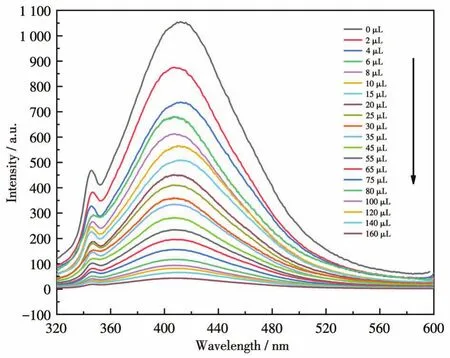
Fig.18 Fluorescence response of CP 1 upon incremental addition of 1 mmol·L-1Fe3+in aqueous solutions
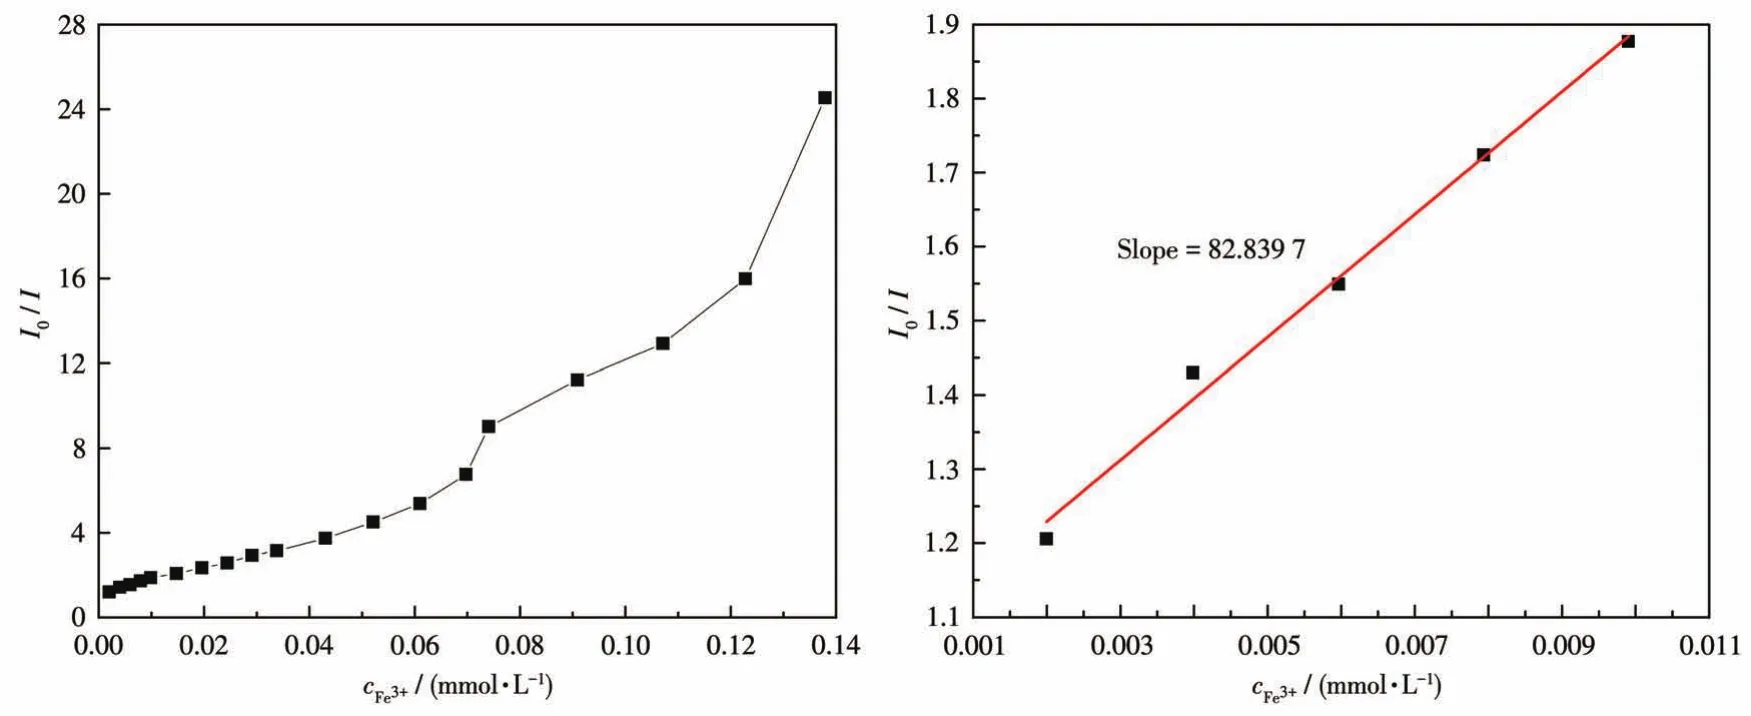
Fig.19 Stern‑Volmer plot of I0/I vscFe3+in the aqueous dispersion of CP 1(left);The area enlarged view for linearity of the plot at lower concentrations of Fe3+(right)
2.7 Detection of anions
To examine the potential of CP 2 for sensing anions,changes in the fluorescence intensity of 2 dis‑persed in water on the addition of different anions,including I-,Br-,Cl-,IO3-,ClO3-,NO3-,CO32-,SO42-,CrO42-,Cr2O72-,and PO43-in aqueous solutions,were investigated(Fig.20).Among these anions,high fluores‑cence quenching of the luminescent intensity of 2 was observed in CrO42-aqueous solution.To further study how the presence of non‑CrO42-anions affects the rec‑ognition of 2 to CrO42-anions,all previously tested anions were analyzed again by adding to the CP 2 solu‑tion containing CrO42-.The fluorescence spectra pro‑duced by these new mixtures are shown in Fig.21.From these results,it can be seen that the emission intensity of 2 and CrO42-was subject to fluctuation when in the presence of the testing anions.However,these fluctuations were deemed mostly minor with respect to relative percent change,so the conclusion shows that 2 still retains significant selectivity for the recognition of CrO42-anions even in the matrix contain‑ing all anions tested.The luminescent intensities grad‑ually decreased with the increasing concentration of CrO42-.The best quenching efficiency observed for CrO42-was calculated to be 97.45% upon incremental addition(0 ‑200 μL)of 1 mmol·L-1CrO42-solution(Fig.22).As shown in Fig.23,good linearity of the plot at low concentrations of CrO42-was observed which fitted well with the Stern‑Volmer equationHigh fluorescence quench‑ing efficiency was proved by the high Stern‑Volmer quenching constant(Ksv=7.01×10⁴L·mol-1).Further detailed analysis denoted that the LOD was 0.418 μmol·L-1.A nonlinear curvature at higher concentra‑tions of CrO42-was obtained,revealing both dynamic and static quenching take place.
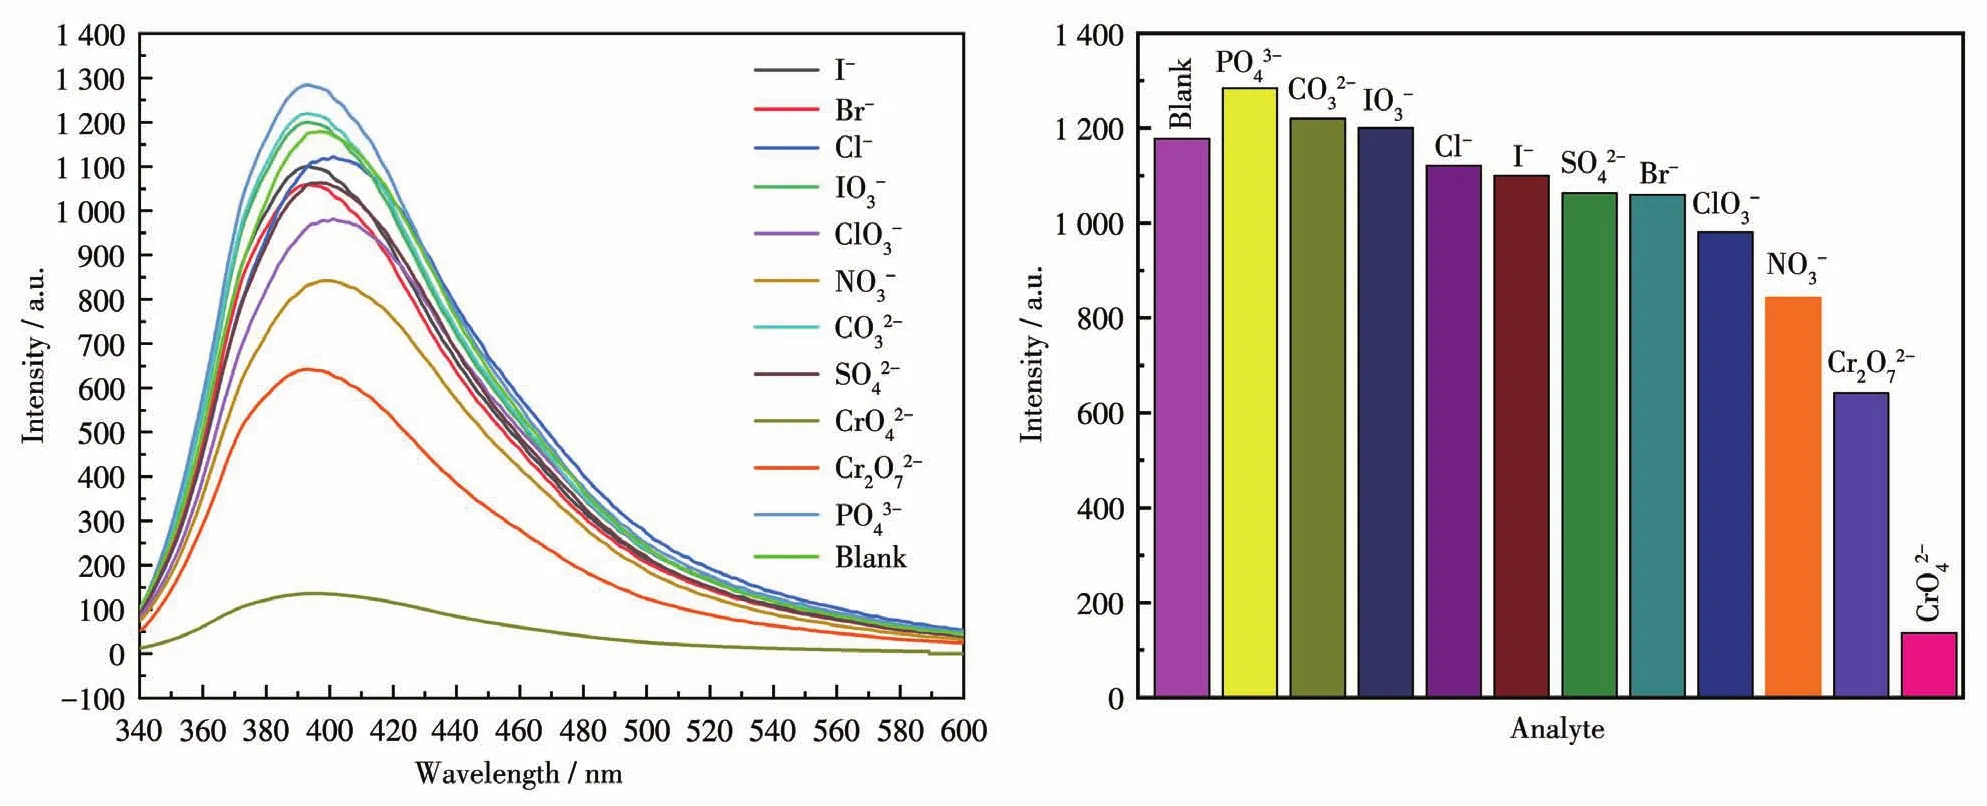
Fig.20 Fluorescent spectra(left)and fluorescent intensities(right)of CP 2 dispersed in aqueous solutions of different anions

Fig.21 Fluorescent spectra(left)and fluorescent intensities(right)of CP 2 and CrO42-in the presence of other anions

Fig.22 Fluorescence response of CP 2 upon incremental addition of 1 mmol·L-1CrO42-in aqueous solutions
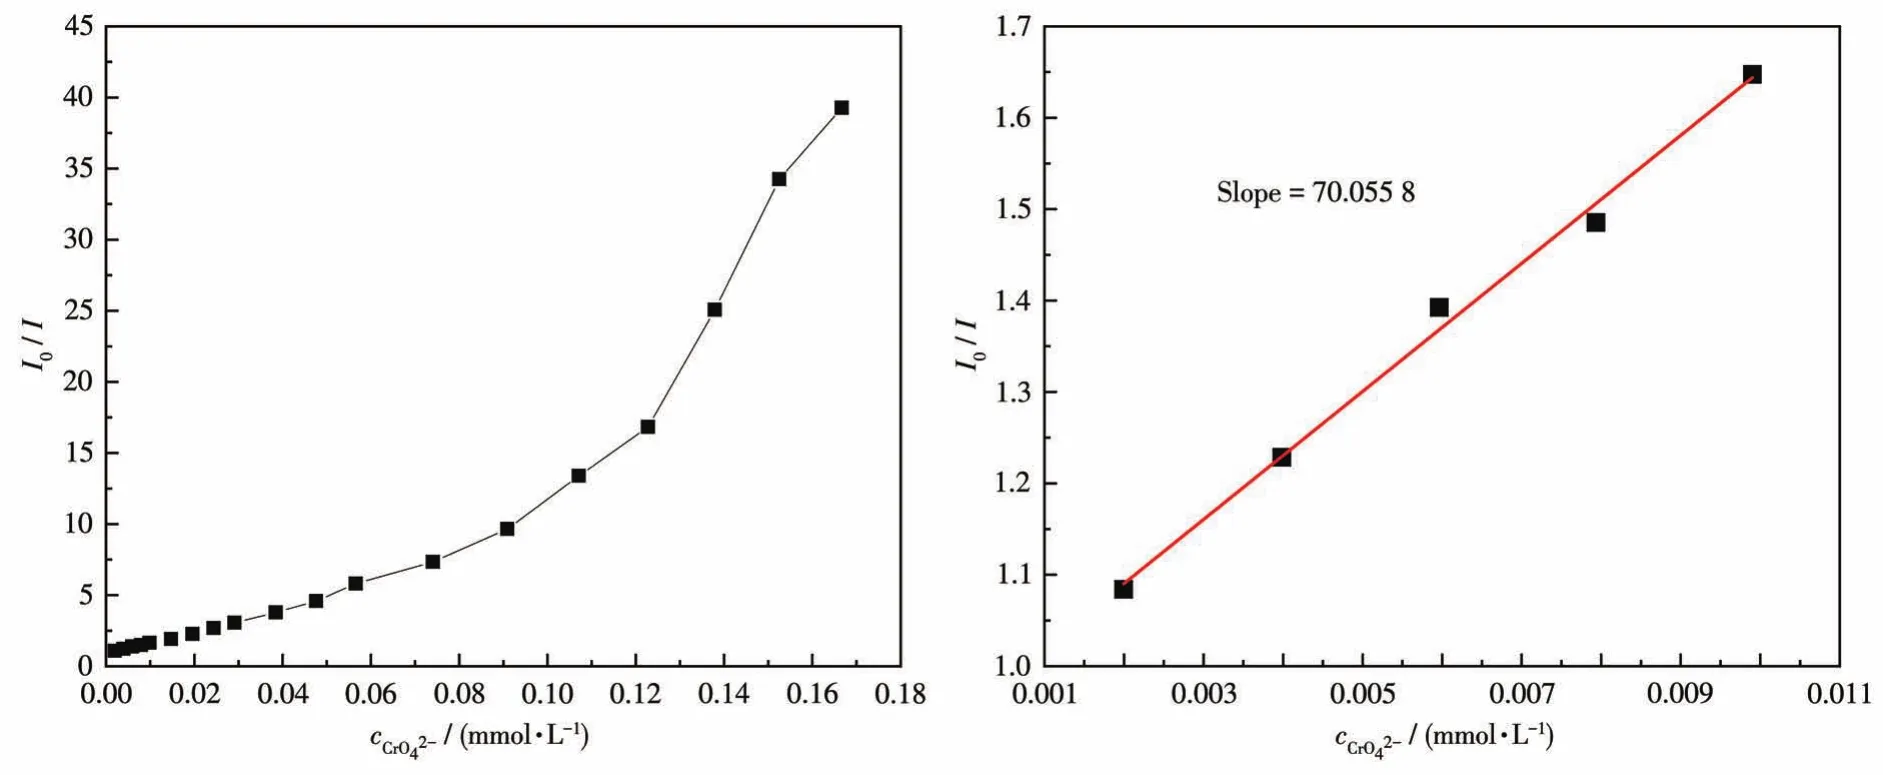
Fig.23 Stern‑Volmer plot of in the aqueous dispersion of CP 2(left);The area enlarged view for linearity of the plot at lower concentrations of CrO42-(right)
3 Conclusions
In summary,two cadmium‑based coordination polymers have been synthesized and characterized by the self‑assembly of Cdsalts with H3tatb and imidaz‑olyl ligands.CPs 1 and 2 display the 2D layer struc‑ture,further these layers are joined by O—H…O hydrogen bonding to generate the interpenetrating 3D architecture.The fluorescent properties of CPs 1 and 2 have been investigated.CP 1 was highly selective and sensitive towards NB and Fe3+through different detec‑tion mechanisms,while CP 2 was highly selective and sensitive towards 2,4,6‑TNP and CrO42-through differ‑ent detection mechanisms.This work demonstrates the potential application of fluorescent CPs 1 and 2 as multi‑responsive probes for the detection of nitroaro‑matic compounds and anions or cations in the aqueous phase.
Supporting information is available at http://www.wjhxxb.cn