Sensory-directed f lavor analysis of key odorants compounds development of French fries and oils in the break-in, optimum and degrading frying stage
2023-01-22LirongXuGangchengWuJianhuaHuangHuiZhangQingzheJinXingguoWang
Lirong Xu, Gangcheng Wu, Jianhua Huang, Hui Zhang, Qingzhe Jin, Xingguo Wang,*
a Institute of Nutrition and Health, Qingdao University,Qingdao 266071, China
b Collaborative Innovation Center of Food Safety and Quality Control in Jiangsu Province, School of Food Science and Technology, Jiangnan University, Wuxi 214122, China
Keywords:French fries Frying stages Off-flavor Odor activity value Aroma recombination
A B S T R A C T The flavor is a decisive sensory characteristic that determines the popularity of French fries (FFs). During high-oleic rapeseed oil (RO) frying, the flavor development of FFs showed three noticeable stages including break-in (3.5%–7.5% of total polar compounds (TPC)), optimum (7.5%–22.18% of TPC), and degrading stages (above 22.18% of TPC). Further, in order to distinguish the key aroma compounds in each stage, the FFs prepared in RO at TPC of 3.5% (FF4), 14.5% (FF15), and 26.96% (FF27) and their relevant oils (RO4,RO15, RO27) were selected for sensory-directed analysis. The results revealed that the FF4 had low contents of (E,E)-2,4-decadienal (deep-fried odor) which also caused lower sensory score in FF4 sample. The higher contents of (E,E)-2,4-decadienal in FF15 induced its higher deep-fried odor. The FF27 had higher hexanoic acid (sweaty odor), heptanoic acid, nonanoic acid, benzene acetaldehyde (stale odor), and trans-4,5-epoxy-(E)-2-decenal (metallic odor) compared with FF4 and FF15, thus leading to the undesirable flavor of FF27.Moreover, the decrease of 2,5-dimethylpyrazine and 2-ethyl-6-methyl-pyrazine in FF27 induced the lower roasty flavor, which may also lead to the decline of the sensory score. Similarly, the higher contents of(E)-2-undecenal, hexanoic acid, heptanoic acid, and nonanoic acid in RO27 lead to increase its rancid score and thus lower the sensory score.
1. Introduction
Frying is a popular and fast cooking practice that has been used domestically and commercially for decades to improve the sensory quality of food products [1]. The f lavor of fried food is one of the fundamental and the decisive sensory characteristics which ultimately determines the acceptance of deep-fried food [2]. From the perspective of practicability and economic eff iciency, the frying oil is continuously used in the household kitchen, restaurants and catering industries, it is also widely used in the fast-food industry, and snack processing enterprises. When the oil was heated, the temperature increased constantly, and several aroma compounds e.g. (E,E)-2,4-decadienal, (E,E)-2,4-heptadienal, octanal, nonanal, appeared,ultimately directly affecting the food flavor [3]. During the frying process, the oil will undergo a series of complex chemical reactions,which further induce changes in components of fried food such as triacylglycerols, polysaccharides, and proteins. During prolonged deep frying, the degradation of oil will inevitably contribute to the losses of vital potato nutrients. These reactions could induce volatile products, and determine the sensorial values of fried products. Among these reactions, lipid oxidation acted as a protagonist, and decided the fried f lavor through the formation of hydroperoxides to be eventually broken down into aroma compounds (e.g., aldehydes, ketones, and alcohols) [4]. Consequently, it is important to explore the degradation of oil when frying and the influence of oil on fried food, contributing to the acquisition of high-quality fried food.
The study carried out by Blumenthal proposed a “Frying Oil Quality Curve”, which introduced five stages of oil degradation(break-in, fresh, optimum, degrading, and runaway stages) that explained the relationship between the changes of oil and the quality of food. Fried products prepared in the first stage were raw with light color and smell [5]. As oil degraded further, the frying process entered in the “fresh” and “optimum” stages with improved food quality,golden brown colored and desired smell. Finally, the oil continued to degrade and entered in the “degrading” and “runaway” stages. In the last stage, the long-term usage of frying oil resulted in the excessive lipid oxidation which finallly obtained a lower sensory score [6].However, this curve did not point out which compounds have a meaningful influence on food flavor because the conclusion was only based on the sensory evaluation, nonetheless, the detailed quantitative information of aroma compounds need further investigation.Numerous studies evaluated the impact of oil types on the French fries (FFs) flavor [7,8]. Furthermore, only a few studies evaluated the fried food sensory, one of which was carried out by Enríquez-Fernández et al., who reported an influence of oil type and freshness on the sensory perception of FFs, without determining the volatile compounds [9]. Also, the study of Santos et al. compared the sensory quality of potatoes during deep-frying in three commercial oils [10].Further, this study revealed that the volatile compounds of potatoes was only characterized roughly neglecting the detailed change of each aroma-active compounds.
In recent studies, the sensory-directed flavor analysis was used for a comprehensive analysis of the key aroma-active compounds in oil and other food matrices [11,12]. Therefore, the aim of this study is to characterize and compare the quantitative information related to the key odor-active flavor compounds in FFs and high-oleic rapeseed oil (RO) during break-in, optimum, and degrading stages using sensory-directed flavor analysis. Moreover, this study will provide new insights regarding the mechanism underlying the generation of desirable and off-flavors after deep-frying in different stages, and the total polar compounds (TPC) value at the turning point of each stage.Results obtained from this study will assist in limiting the off-flavors formation and improving the aroma of fried food. Furthermore,the present study may benefit food industries for the control and standardization of flavor.
2. Materials and methods
2.1 Materials and reagents
Fresh potatoes (Solanum tuberosum L, Helan15 cultivar)were obtained from a farm located in Shandong, China. The higholeic RO (Brassica napus) was donated by (Cargill Cereals &Oils (Nantong) Co., Ltd.), without additives, was stored at 4 °C.The reagents and volatile compound standards were purchased from Sigma (St. Louis, MO, USA).
2.2 Frying procedure
A commercial deep fryer (Aigoli, China) with a maximum capacity of 2.5 L was used for frying. A batch of (100 ± 2) g of potatoes was fried in the RO for 5 min at 170 °C. Then, the next frying cycle was done after 55 min. The overall time was 3 days(8 h/day). The FFs and the RO were collected for further analysis after each cycle.
2.3 Determination of fatty acid composition
The fatty acid composition was determined according to the method reported by Li et al. [13] with methyl nonadecanoate as an internal standard. The fatty acid composition was analyzed by gas chromatography using Agilent 7820 (Agilent, USA) and the conditions were referred from our previous research [14].
2.4 Determination of AV, PV, p-AnV, TOTOX and TPC
The acid value (AV), peroxide value (PV),p-Anisidine value(p-AnV) and TPC were determined according to AOCS official method 3a-63 [15], Cd 8b-90 (AOCS, 2003) [16], Cd18-90 (AOCS, 2011) [17],and Cd 20-91 with minor modifications (AOCS,1993), respectively. The total oxidation (TOTOX) value was calculated using values of PV andp-AnV according to the AOCS official method Cg 3-91.
2.5 Determination of moisture and total oil contents and color of FFs
The moisture content of the samples was determined by the oven drying method [19]. The oil content of FFs was determined by the Soxhlet extraction method [10]. Color of the FFs sample was expressed as lightness (L*), yellowness (b*) and redness (a*), and was measured by using a high-precision spectrophotometer (UltraScan Pro 1166, HunterLab Inc., USA). Color change (ΔE) and the browning index were calculated according to the study of Yost et al. [20].
2.6 Sensory evaluation
The FFs were analyzed by an 80 sensory panel members (65%female; 18–40 years old, from Jiangnan University) for flavor desirability on a 7-point hedonic scale, from 1 (extremely undesirable flavor) to 7 (extremely desirable flavor), the panelists were trained according to the national standard method (GB/T 16291). The FFs were placed in paper cups which were marked with 3-digit ofrandom numbers, and were presented to each assessor. Furthermore, twelve trained panelists (6 males and 6 females; with an average age of 30 years) from Jiangnan University were employed to evaluate the sensory attributes of RO and FFs in three different frying stages. Prior to analysis, several aroma qualities were selected by a descriptive test as reported by Thürer et al. [8]. A reference solution in refined sunflower oil was provided for each descriptor as follows: hexanal for green, (E,E)-2,4-decadienal for deep-fried, (E)-2-nonenal for fatty,butyric acid for sweaty,trans-4,5-epoxy-(E)-2-decenal for metallic,hexanoic acid for rancid, 3-(methylthio) propanal for cooked potatolike, 2,6-dimethyl-pyrazine for roasty, 2,5-dimethyl-4-hydroxy-3(2H)-furanone for caramel, and benzene acetaldehyde for stale/beeswax-like. The intensities of selected odor attributes (green/grassy,metallic, deep-fried, fatty, sweaty, rancid for RO and cooked potatolike, roasty, caramel, deep-fried, fatty, stale, metallic, and rancid for FFs) were rated by a trained sensory panelist on a linear scale from 0(not perceivable) to 3 (strongly perceivable) on a seven-point scale in step. Each sample was evaluated thrice by each panelist.
2.7 Aroma extract dilution analysis by gas chromatographyolfactometry-mass spectrometry (GC-O-MS) analysis
A GC-MS (QP-2010, Shimadzu, Shimane, Japan) combined with an olfactory port was used to analyze the samples. GC-O analysis was performed on DB-WAX column (30 m × 0.25 mm × 0.25 μm),experimental conditions were in accordance with GC-MS. The volatile extracts were obtained by HS-SPME, and the sample was diluted by increasing the GC inlet split ratio from 4:1 to 16:1, 64:1,256:1. The flavor dilution (FD) factor was defined as the maximum dilution at which the aroma compound could be detected.
2.8 Quantitation of the aroma-active compounds and calculation of odor activity values (OAVs)
The SPME method was referred from the study carried out by Santos et al. [10], with minor modification. The FFs (1.50 ± 0.02) g were placed in a 20 mL vial, while 5ml of saline solution and 20 μL of standard solution (1,2-dichlorobenzene, 51.55 μg/mL) were added to each sample before extraction. For frying oil analysis, (3.00 ± 0.02) g oil samples and 20 μL of standard solution (1,2-dichlorobenzene,1 031 μg/mL) were added to a 20 mL vial. The 50 μm/30 μm DVB/CAR/PDMS fiber (Supelco Inc., Bellefonte, PA, USA) was used for headspace sampling. Volatile compounds were analyzed on GC-MS apparatus using a TSQ Quantum XLS (Thermo, USA)operating in electron ionization mode (EI, 70 eV) with the DBWAX MS column (30 m × 0.25 mm × 0.25 μm). The odor-active compounds were quantified by an external standard method with mass spectra, and detected in a selected ion monitoring mode. Prior to quantitative analysis, the FFs were further treated to obtain an artificial odorless matrix as described in the previous study with minor modification [21]. The odorless refined rapeseed oil was obtained by molecular distillation. OAVs were calculated as the ratio of the concentration of each odorant to its respective threshold in oil, and the threshold was obtained from the previous study [22].
2.9 Aroma recombination and omission experiment
All flavor standards with OAVs ≥ 1 were added in the odorless FFs and the odorless refined RO, as shown in the recombination model 1. Then, each standard was omitted in the recombination model 2 to compare the difference from original samples. The aroma of model 2 was differed from that of the original samples, indicating that the lacked aroma compounds were key aroma compound. Finally,the selected key aroma compounds were recombined as model 3.Recombination model 3 was evaluated based on whether it was consistent with the original FFs and RO by panelists as described above for APA.2.10 Statistical analyses
All analyses were conducted in triplicates. One-way analysis of variance (ANOVA) and Duncan’s multiple range tests were performed using the IBM SPSS Statistics for Macintosh (Version 22.0).
3. Results and discussion
3.1 Physicochemical analysis
3.1.1 Fatty acids compositions of frying oil
The changes in fatty acids composition of RO during the frying process are showed in Table 1. Remarkably, oleic acid (72.79 g/100 g)was recovered with the most predominant fatty acid in fresh RO. The oxidative susceptibility of lipids was correlated with their fatty acid composition and resulted in different volatile compounds degraded from fatty acids [23]. Furthermore, our results showed that the oleic acid was decreased from 72.79 g/100 g to 60.42 g/100 g in the RO over the frying process. While, the degradation of polyunsaturated fatty acids was increased with the frying time. Further, the contents of the linoleic and linolenic acids were decreased in the RO. At the end of the frying process, linoleic and linolenic acids were decreased by 4.29 and 1.84 g/100 g, respectively, in RO. Moreover, the saturated fatty acids similarly showed a declining trend with frying time(10.47 g/100 g to 7.87 g/100 g). These results were consistent with the previous study of Liu et al. [23]. Also, the trans fatty acids (TFA)were observed to be a common indicator for oil thermal degradation.The TFA in the RO was increased with frying time (from 0.23 g/100 g to 0.31 g/100 g) which is in accordance with the increasing trend for canola oil and olive oil during 28 h of frying [10].
3.1.2 The change of AV, PV, p-AnV, TOTOX and TPC of frying oil
As shown in Table 2, the AV was rapidly increased over frying time in the RO and reached 4.70 mg/g after 16 h of frying. The PV in the RO showed an initial sharp increasing trend until it reached the highest value (17.40 meq/kg) at 16 h. Thep-AnV indicated the degree of secondary oxidation by measuring the content of aldehydes. Thep-AnV was low in fresh oil (0.73) and then it was sharply increased by 144.38 after 8 h of deep-frying. Then, the value showed a moderate increasing trend (form 146.80 to 157.70) until the end of the frying time. The TOTOX value was used to describe the degree of overall oxidation [24]. The TOTOX value was low (3.63) in the fresh oil, then showed a continuously increasing trend (from 3.63 to 192.49) during 16 h of frying. The TPC content was one of the greatest representative indicators, which described the degree of oil deterioration in frying oils. According to the Chinese national standard (GB 2716–2018),when the TPC is over 27%, the frying oils should be discarded [14].The TPC content of RO was gradually increased during the prolonged frying period and reached 26.96% at 16 h of the frying.
3.1.3 The moisture, oil content and color change of FFs
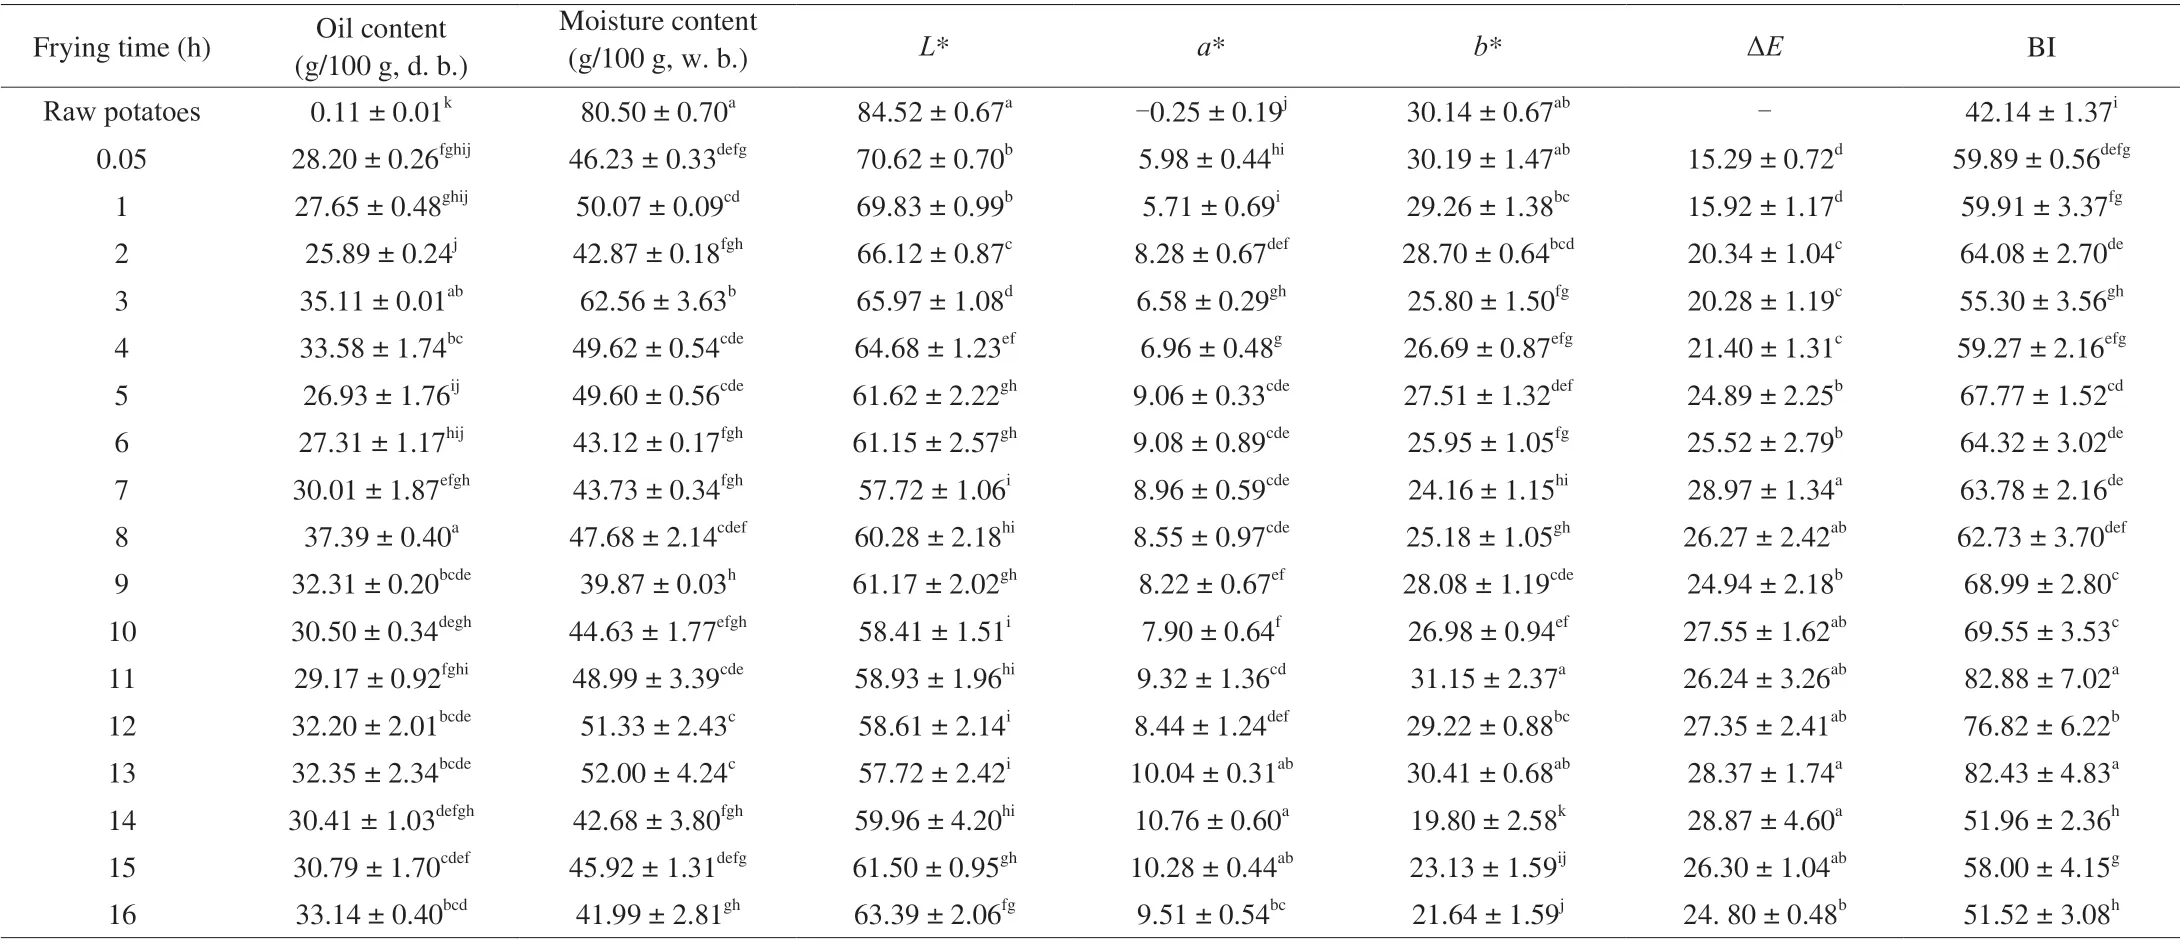
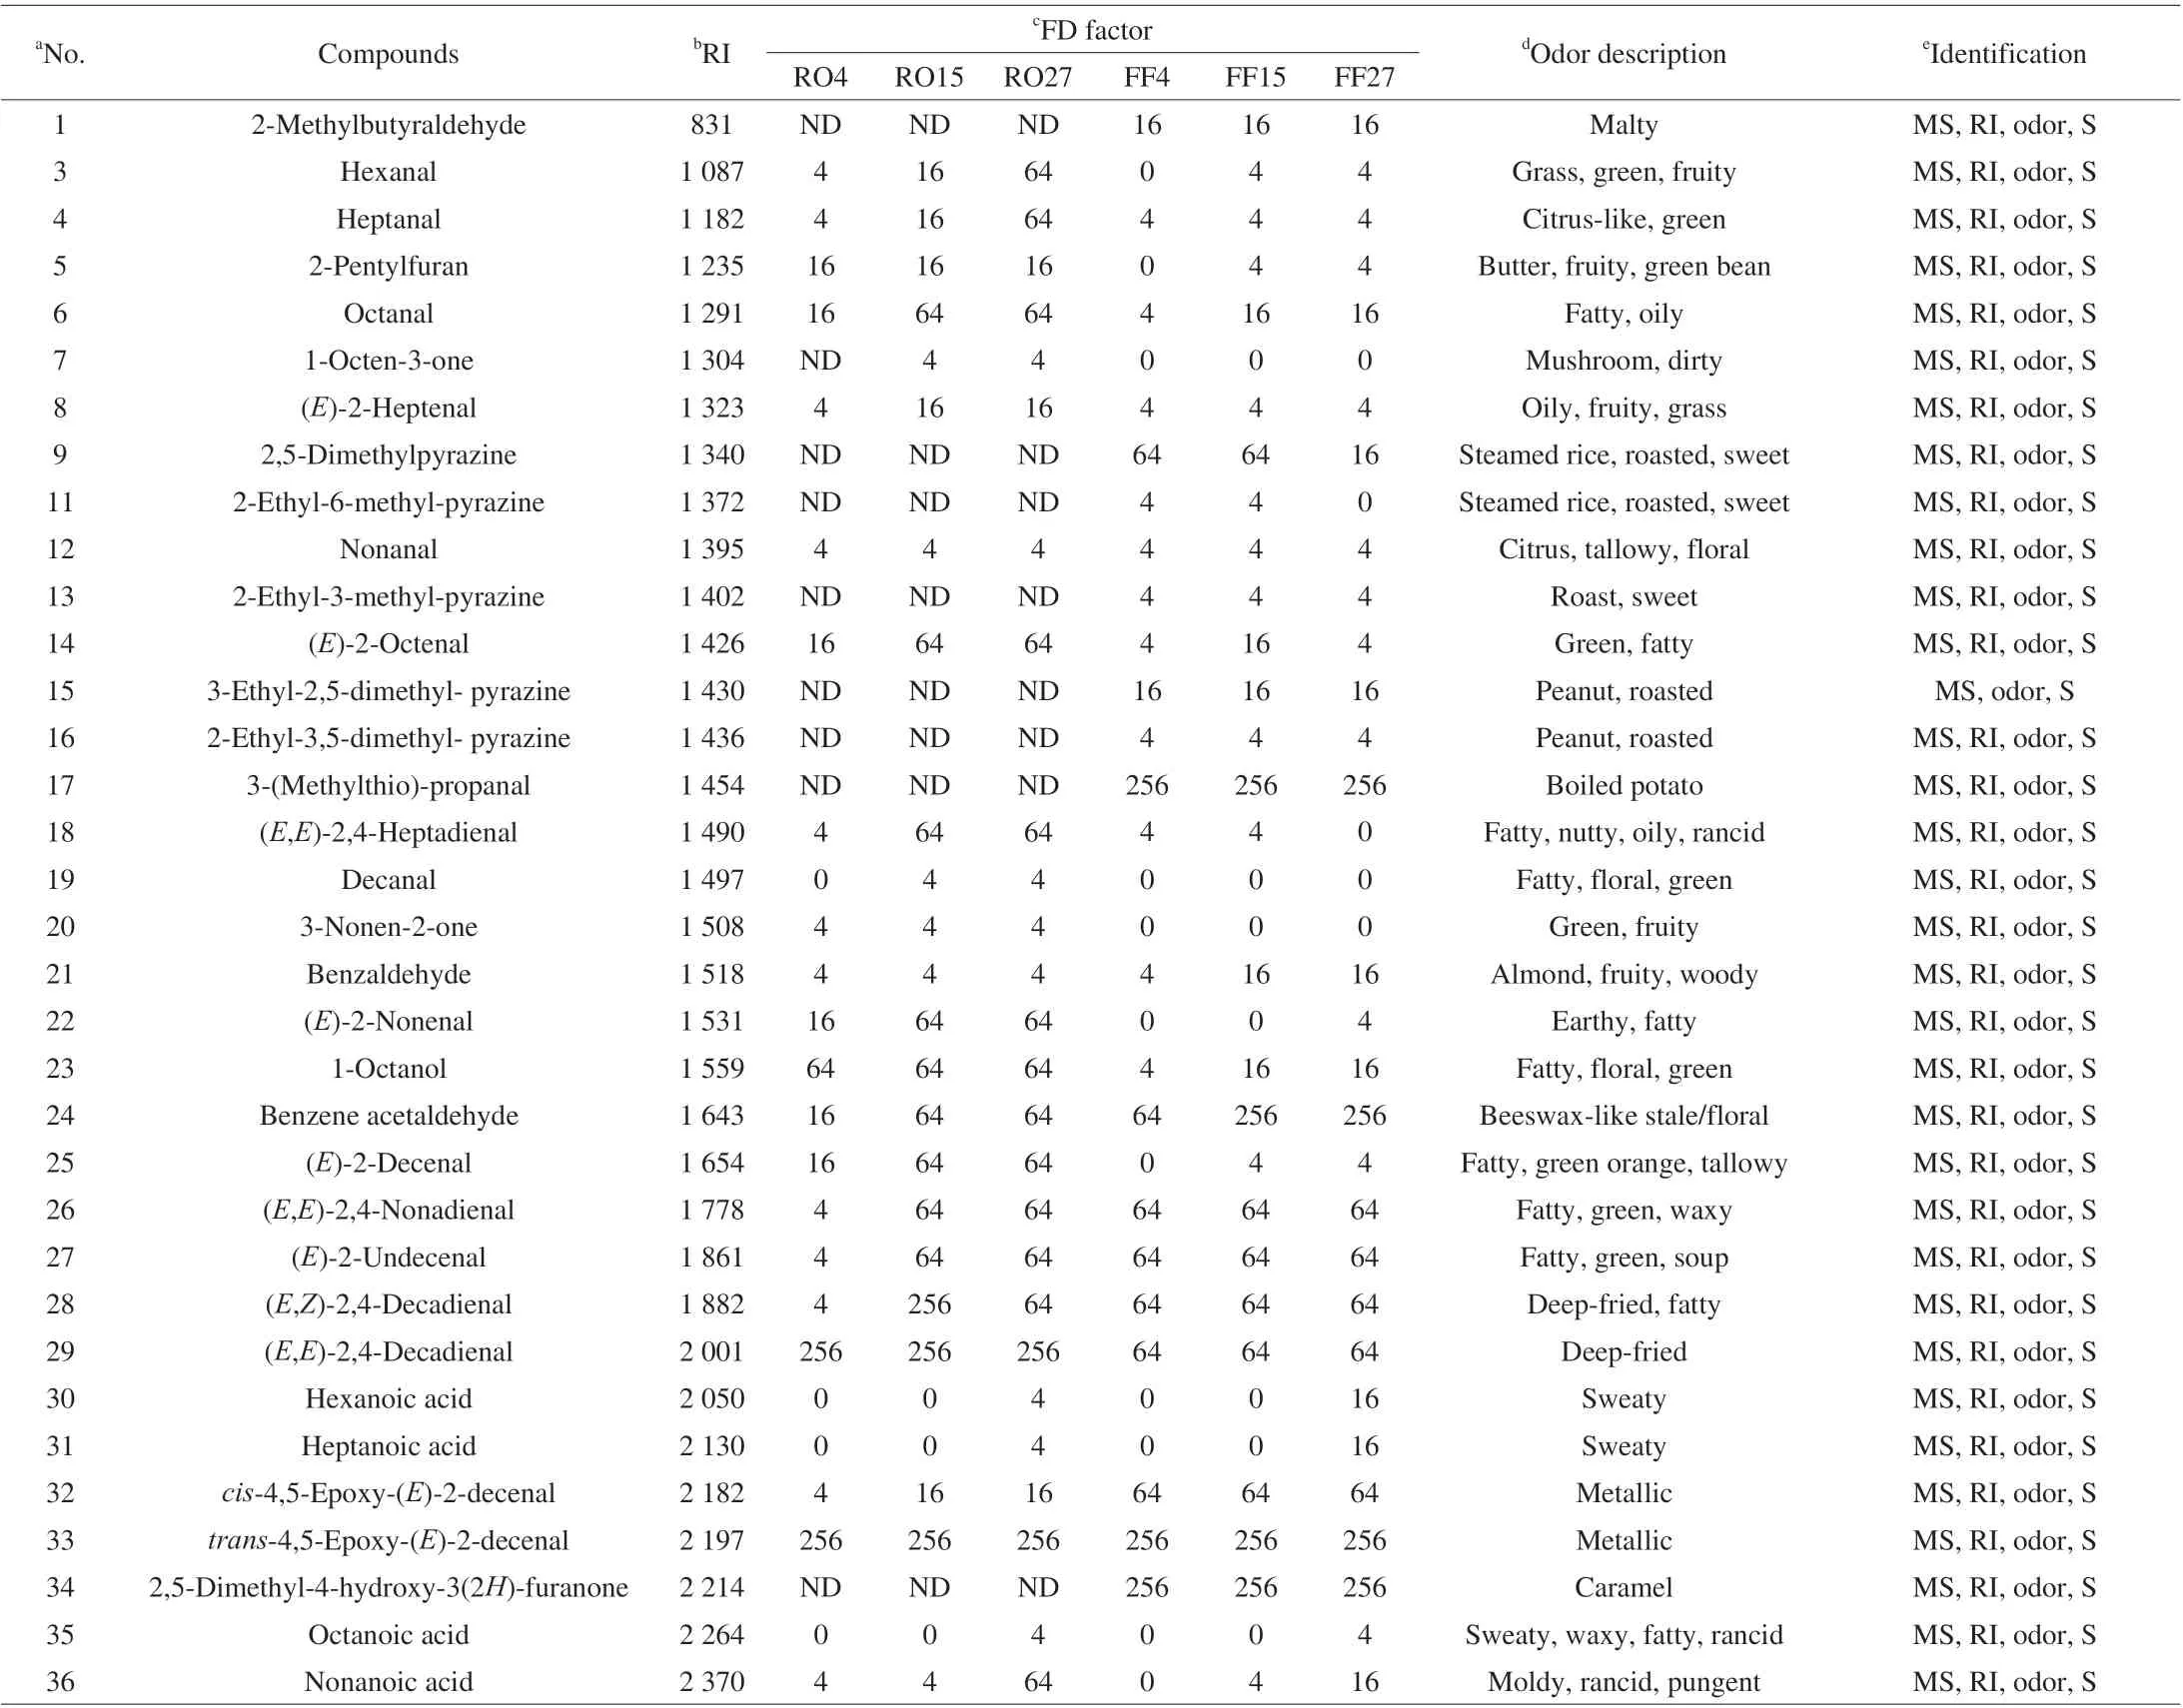
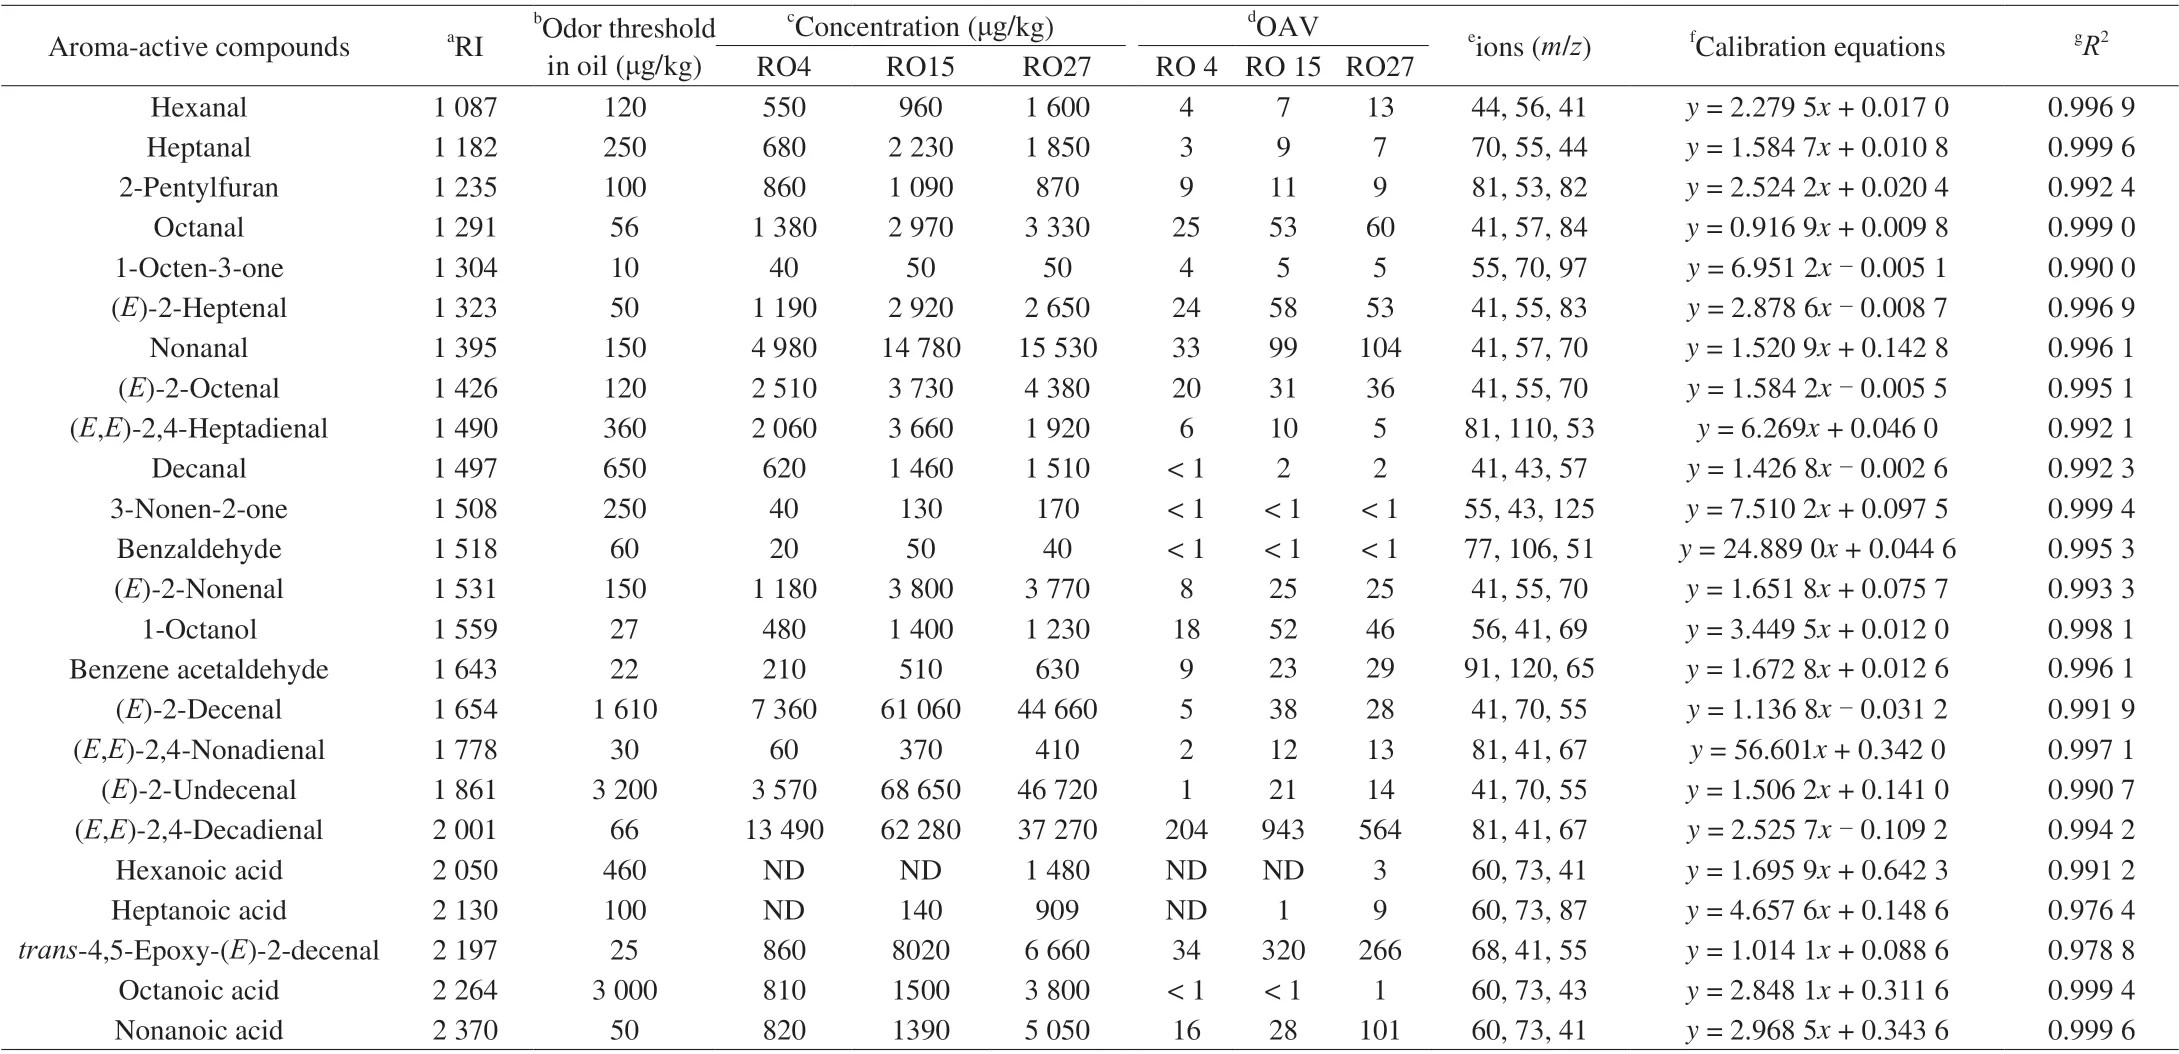
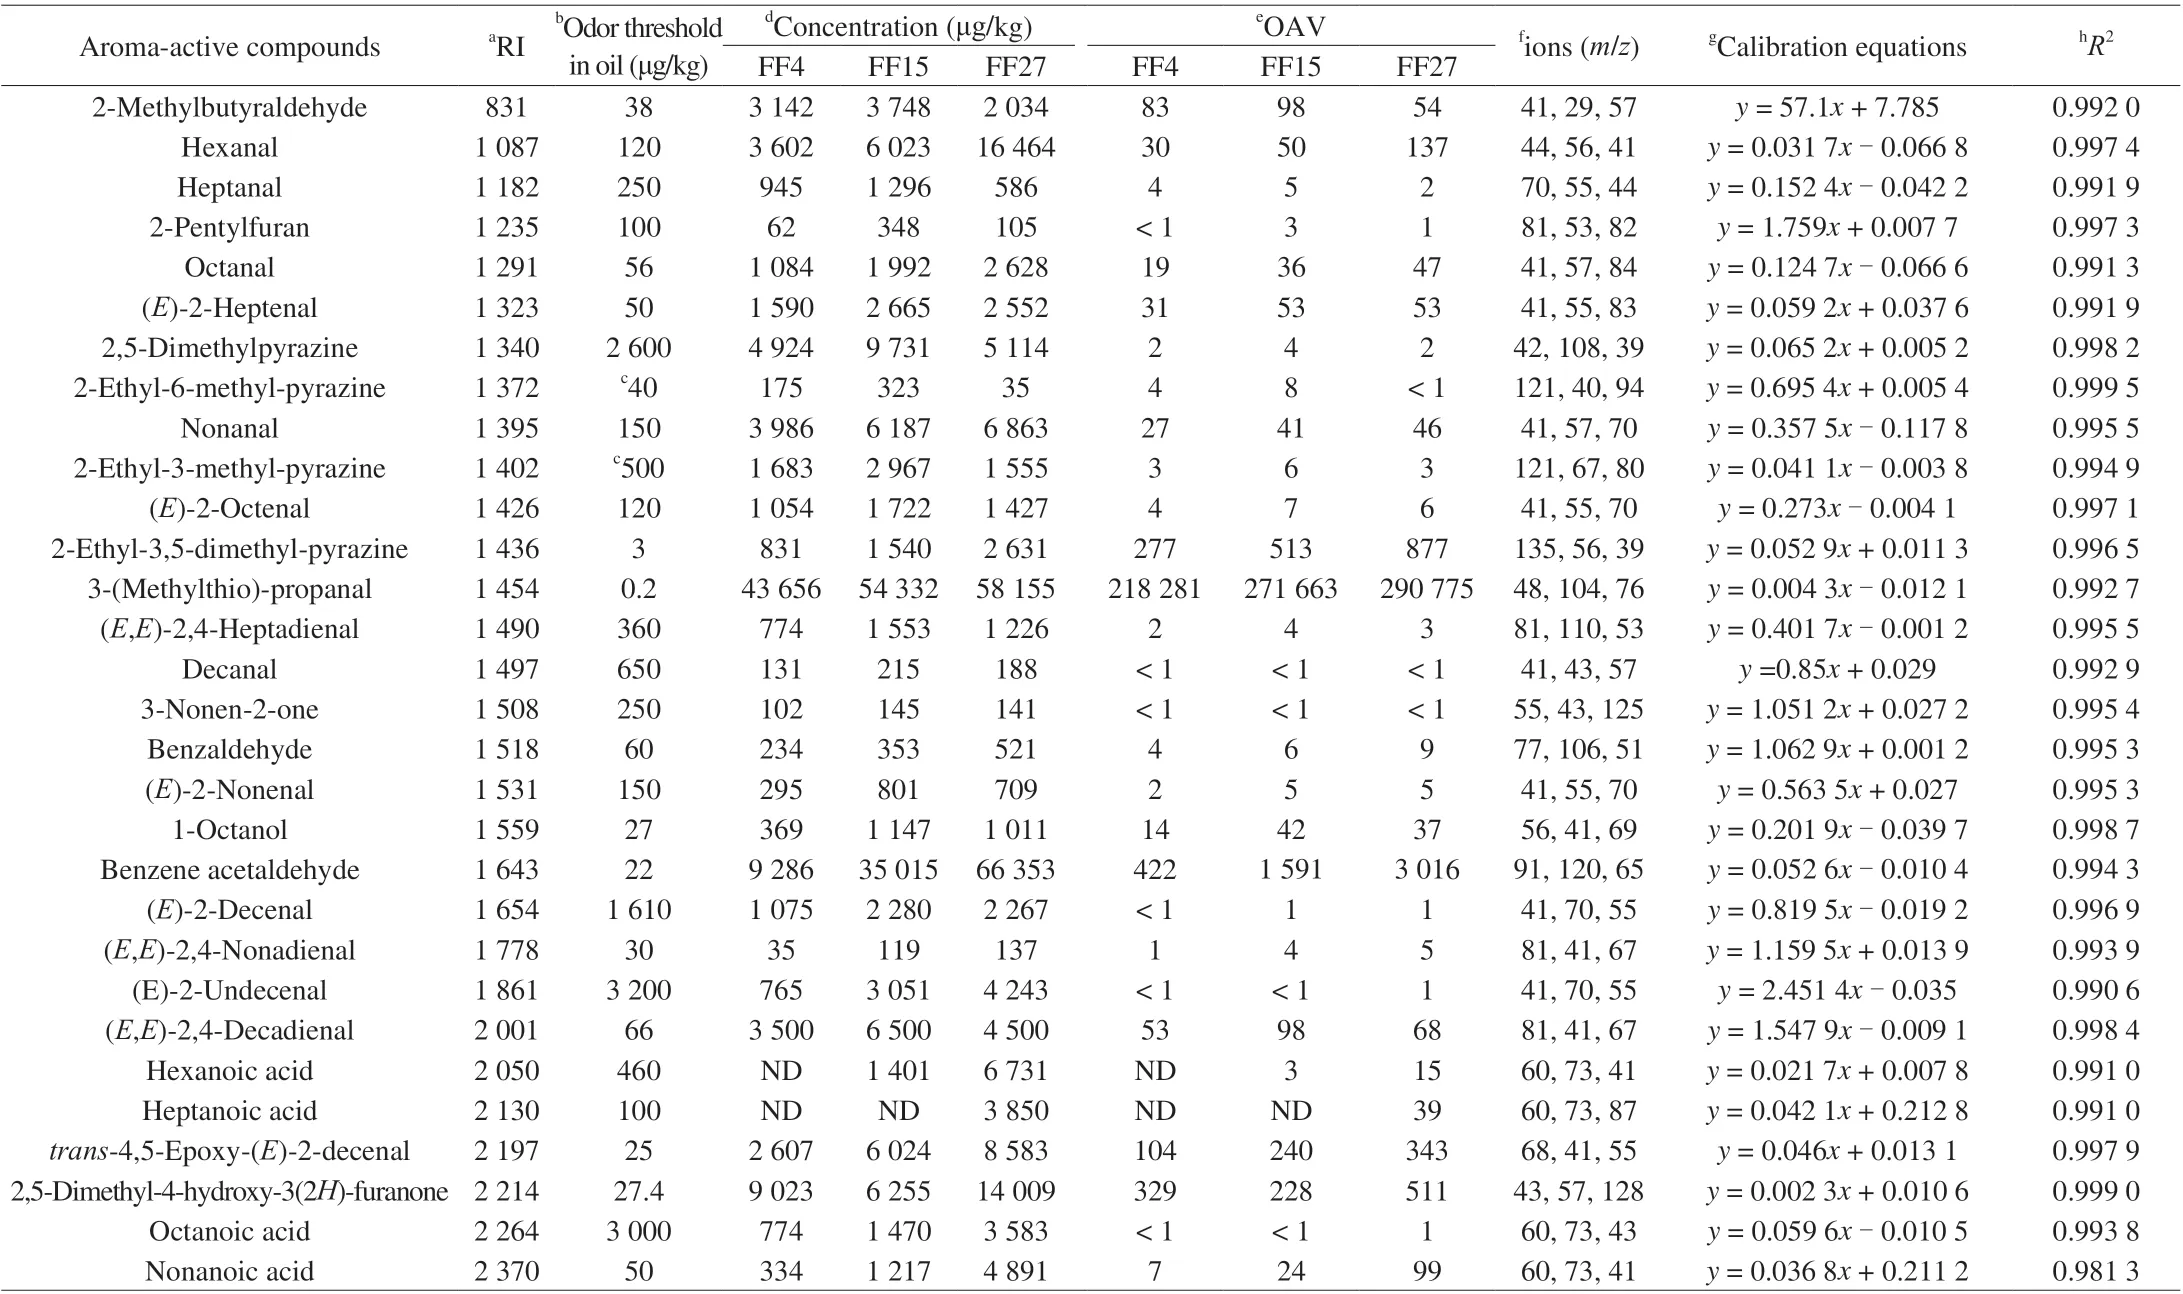
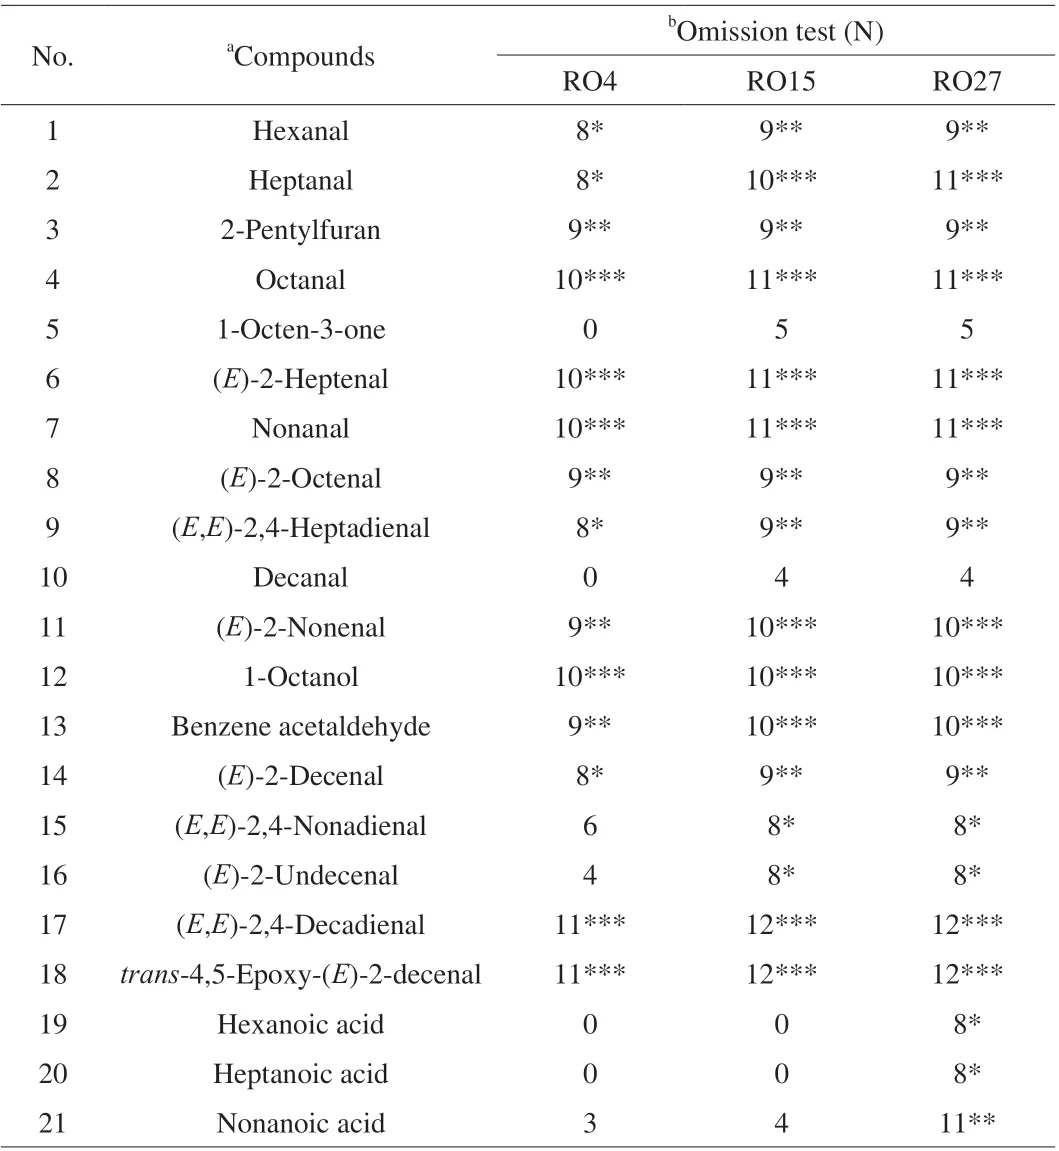
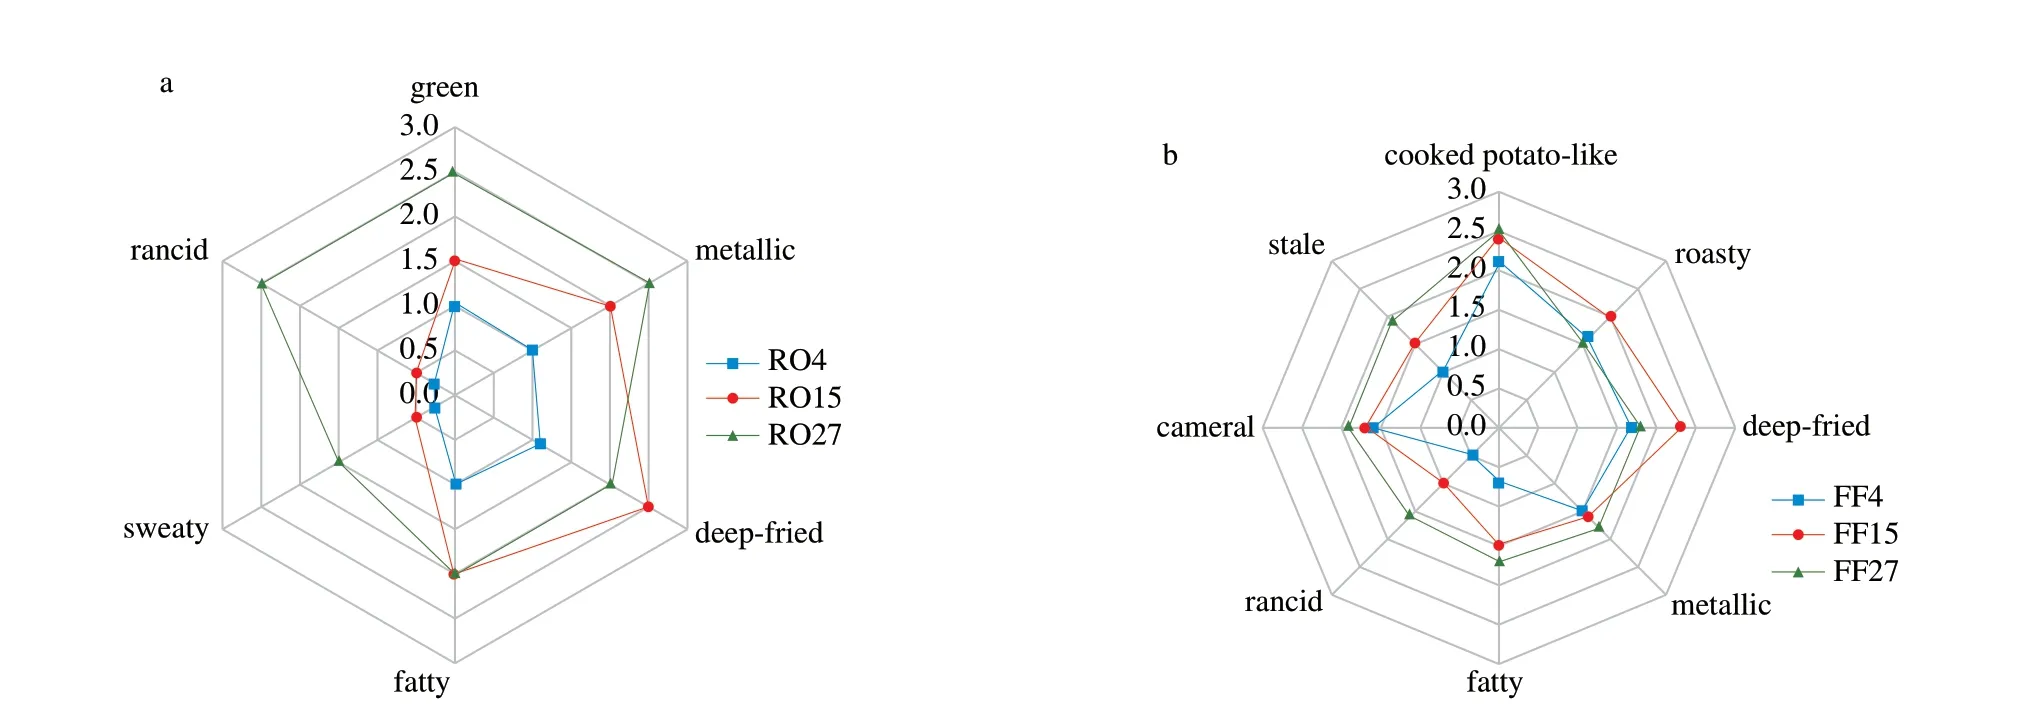
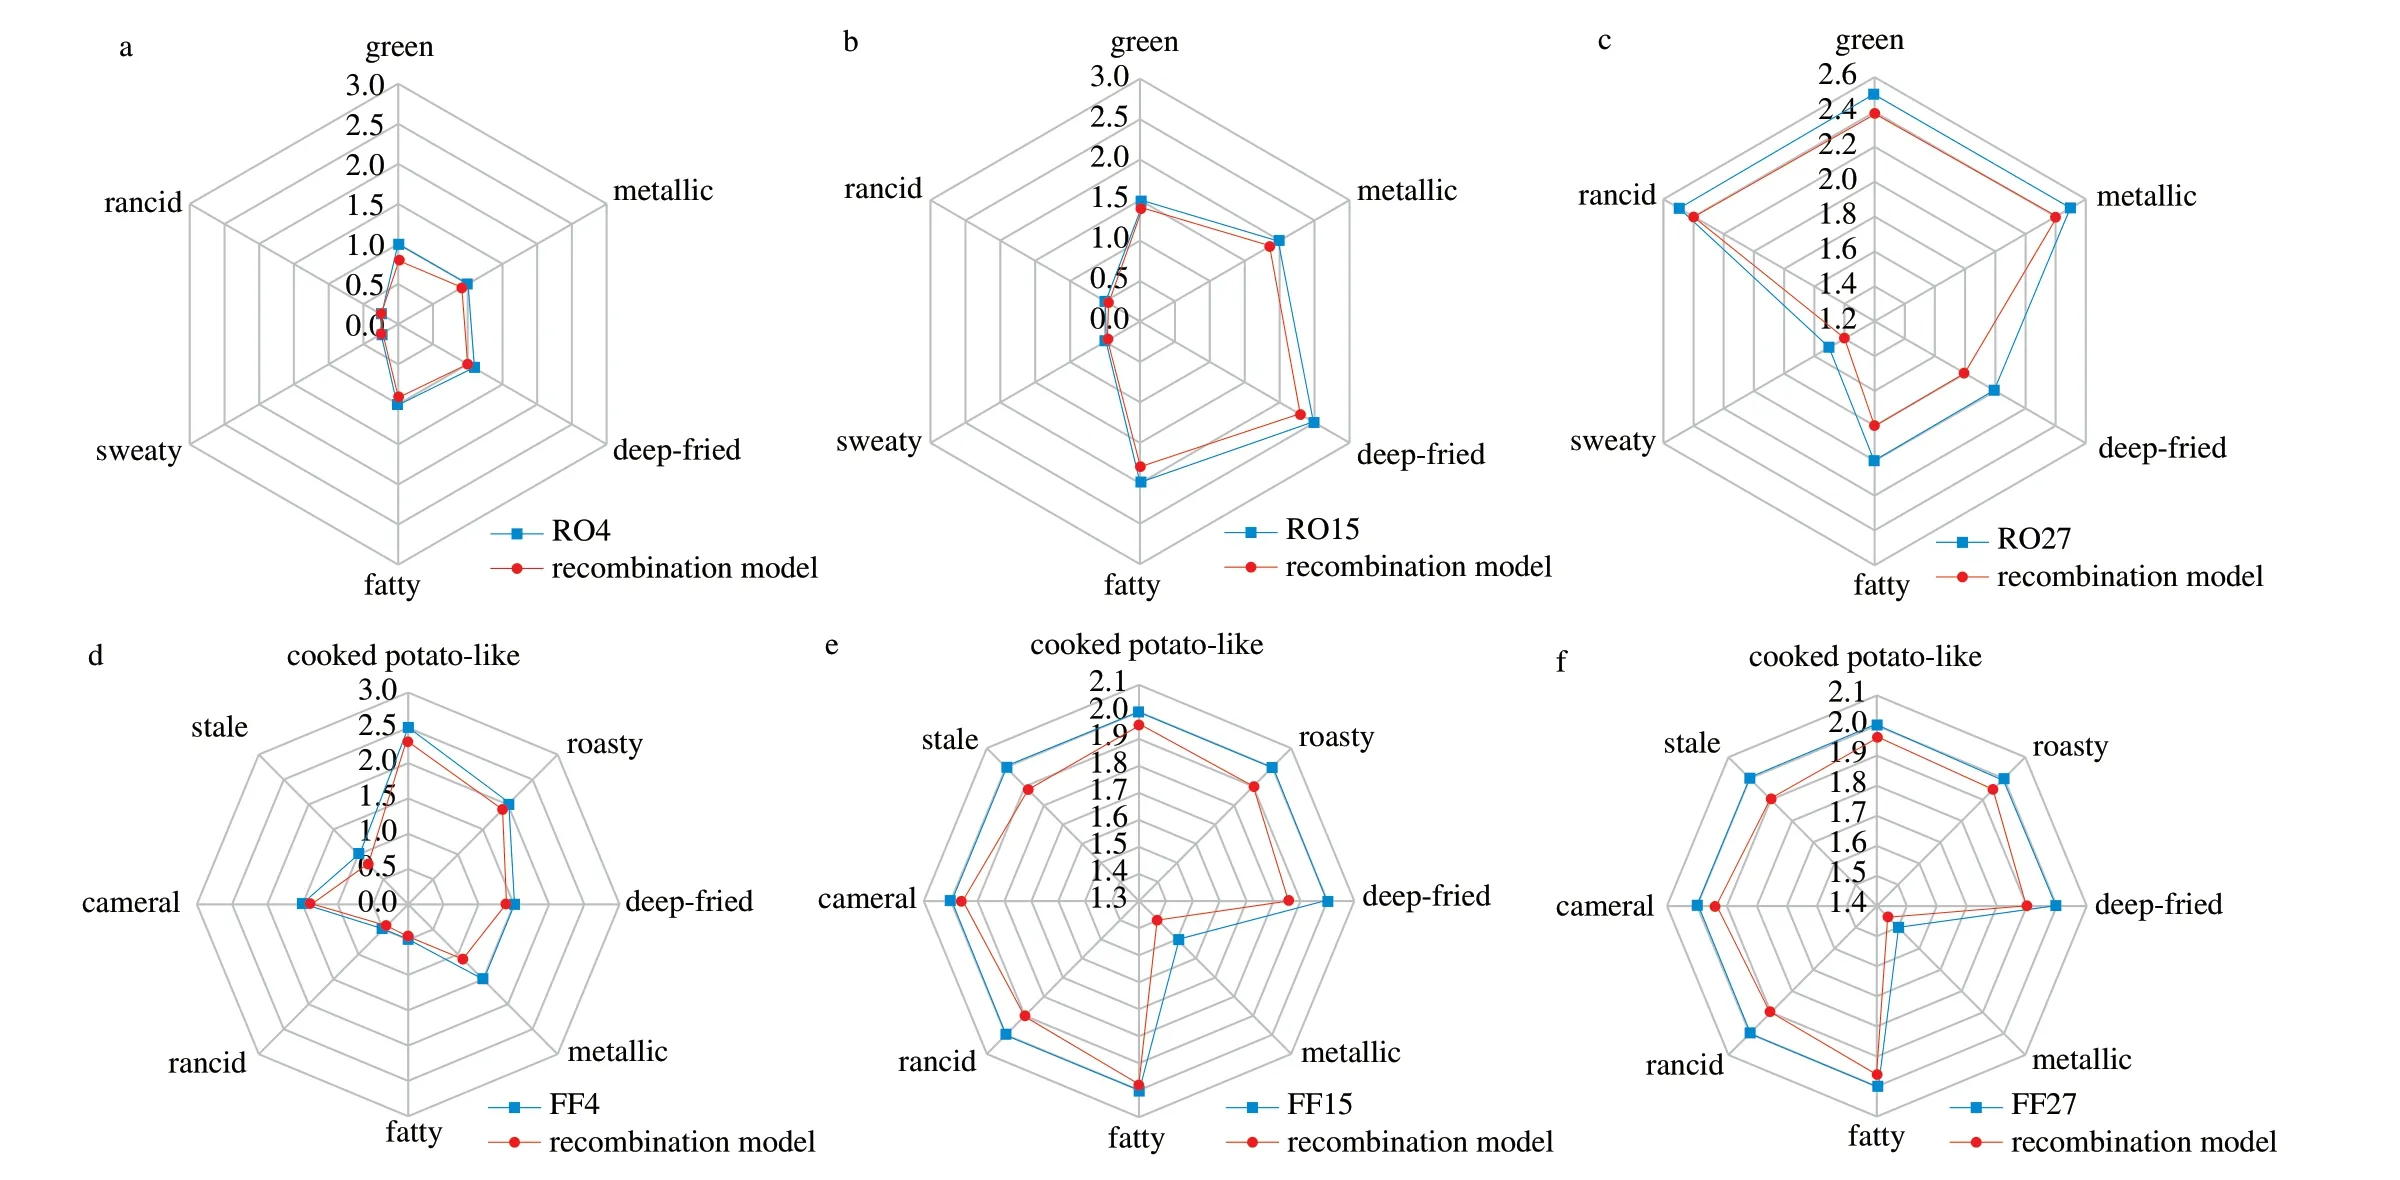
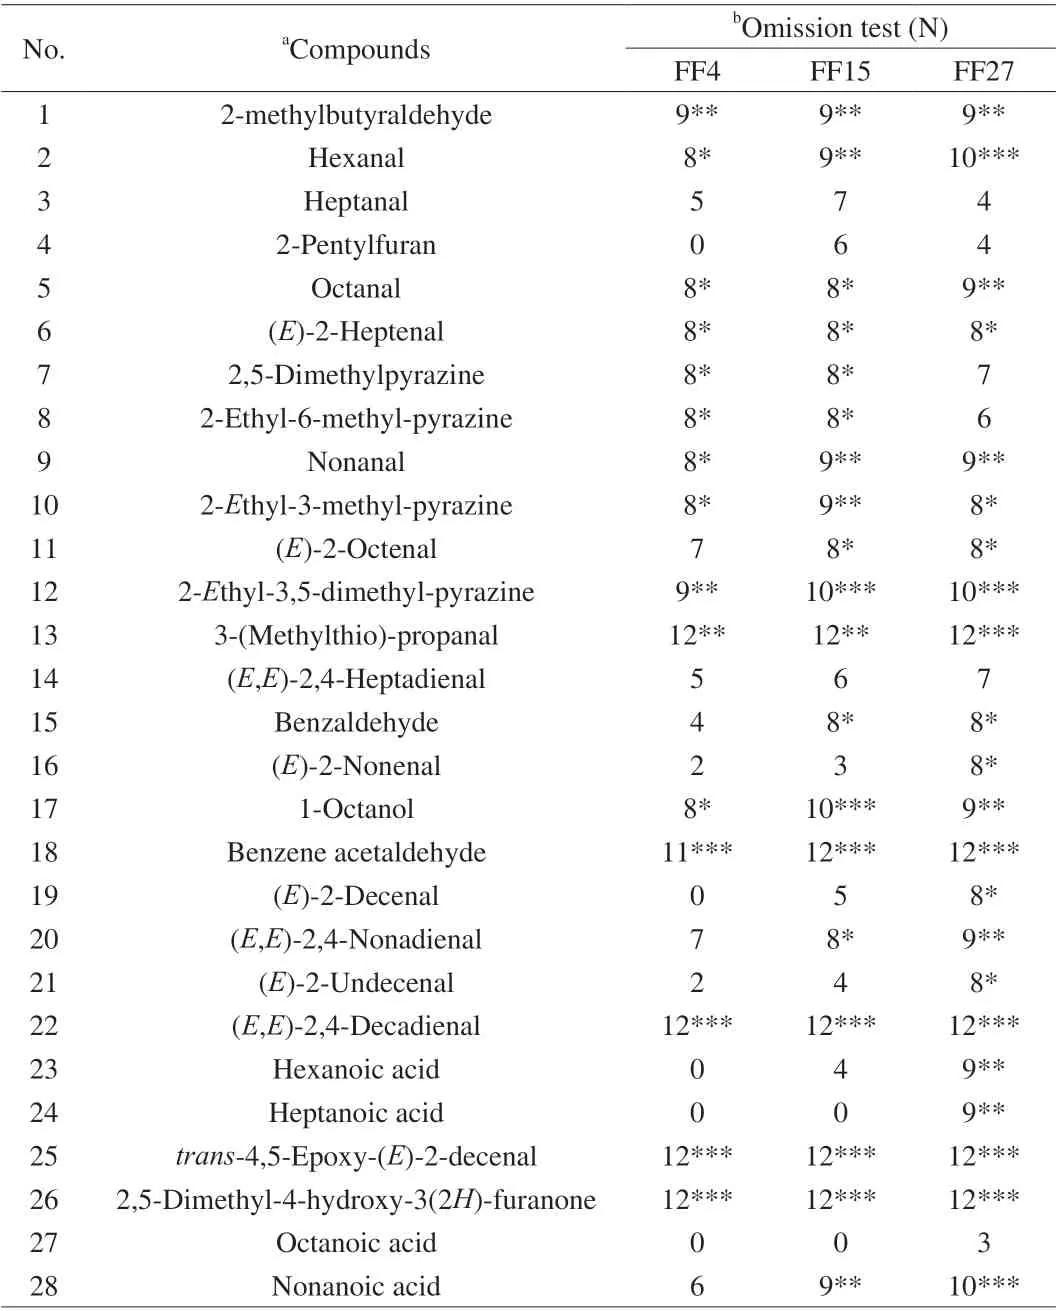
The moisture content of potatoes was significantly decreased by 31% after frying. However, the fat absorption was accompanied by moisture reduction, with the final oil contents ranging from 22.31%to 37.39% (Table 3). Nevertheless, these results were varied with the frying time. The previous study confirmed that the formation ofsurfactants during frying affected the rate of heat and mass transfer [25].Changes involved in these surfactants may lead to the fluctuation of oil contents during the frying of potatoes. Regardless of the frying time, coordinatea* was generally higher (5.7 Table 2 The change of AV, PV, p-AnV, TOTOX and TPC value of high-oleic rapeseed frying oils in different frying time. Generally, the changes in oil quality can directly affect the flavor of the food, the TPC is an important index responding the oxidation degree of frying oil, thus, the concentration of TPC in oil is related to the flavor quality of fried food. Fig. 1 indicated the flavor scoreof FFs vs. TPC concentration of oil in which they were fried. The flavor score of FFs in the first batch and those fried in the oil at 1 h were lower than fried at 2–3 h. The flavor of FFs was not optimum at the start of the frying process. The flavor of commercial frying oils is usually bland, and some time is needed to develop the desirable typical fried flavor for the consumers. In this study, heating at 170 °C for 1 to 2 h was sufficient as an induction period, and during this period the TPC content was ranged from 3.5% to 7.5%. Further frying (2–12 h), the flavor score of FFs was higher than that prepared in the induction period, and the TPC concentration increased from 7.5% to 22.18%. During this period, the FFs had optimum frying and flavor development. These results were consistent with a previous study, in which the doughnuts were fried using the hydrogenated vegetable oil [28]. As the TPC content increased above 22.18% after 12 h, the flavor score of the FFs was decreased to 5.0. Thus, the frying oil should be controlled when TPC was above 22% to prolong the optimum stage. Nonetheless, the flavor development of FFs showed three obvious stages, i.e. break-in, optimum, and degrading stages.The flavor was improved during the fresh stage of frying, afterward, it remained with a higher flavor score which was nearly constant in the optimum stage, and gradually became less acceptable in the degrading stage. In order to obtain the key aroma compounds in each stage, the FFs samples prepared in RO with TPC of 3.5% at 0.05 h, 14.5% at 6 h and 26.96% at 16 h and their relevant frying oils were selected for further analysis. Table 3 Changes in moisture and oil content during the production of FFs. Fig. 1 Relationship between flavor scores of FFs and total polar compounds of frying oil during 16 h deep-frying. The overall perception of RO with TPC of 3.5% (RO4), 14.5%(RO15), 26.96% (RO27), and FFs prepared in the relevant frying oils(FF4, FF15, FF27) were evaluated as shown in Fig. 1a and 1b. The deep-fried and fatty aromas were well perceived in the RO4, RO15,and RO27 samples, and RO15 had higher deep-fried odor compared with RO4 and RO27. The RO27 sample represented higher sweaty and rancid odor compared with RO4 and RO15, which resulted in the off-flavor in this oil sample. The cooked potato-like, roasty, caramel,and deep-fried odors were well perceived in FF4, FF15, and FF27 samples, and the FF15 had higher deep-fried scores. However, the FF27 sample contained a more intense fatty, stale, and rancid smell,which significantly affected the off-flavor in the FF samples. The sensory evaluation suggested that the deep oxidation of oils generated the off-flavors in the RO and the FFs, not only by enhancing fatty,sweaty, and rancid odors, but also by reducing the deep-fried and roasty odors. In total, 26 and 33 kinds of aroma active compounds were identified in RO and FFs, respectively (Table 4). The classification of FFs was almost similar to that of a previous study which detected 43 volatile compounds in the FFs prepared in palm oil [29]. However,the contributions of these flavor compounds were different, as the aldehydes showed higher FD values in our study. Some saturated aldehydes (hexanal, heptanal, octanal), alkenals ((E)-2-octenal, (E)-2-nonenal, (E)-2-decenal, (E)-2-undecenal) and alkadienals ((E,E)-2,4-heptadienal, (E,E)-2,4-nonadienal, (E,Z)-2,4-decadienal, (E,E)-2,4-decadienal,trans-4,5-epoxy-(E)-2-decenal) contributed to the main green, fatty, deep-fried and metallic flavor of RO. These relatively had higher FD values in RO15 and RO27 compared with RO4. Some aroma-active compounds especially the acids, i.e. hexanoic acid,heptanoic acid and octanoic acid were only detected in the RO27 sample. While, the nonanoic acid had higher FD value (64) in RO27 than RO4 and RO15. Therefore, these newly generated acid probably led to the sweaty and rancid off-flavor, and resulted in a lower sensory score in RO27. As for the FFs, the above-mentioned alkadienals generated from oil oxidation were more important flavor contributor on the FFs samples than the saturated aldehydes and alkenals.Besides, 2,5-dimethylpyrazine (roasty flavor), 3-(methylthio)-propanal (cooked potato-like flavor), and 2,5-dimethyl-4-hydroxy-3(2H)-furanone (caramel flavor) had high FD value (≥ 64) in the FFs.Moreover, few acids including hexanoic acid, heptanoic acid, octanoic acid and nonanoic acid had higher FD value in FF27 compared with FF4 and FF15, which resulted in a rancid off-flavor. In addition, the increment of FD value in benzene acetaldehyde with stale/beeswaxlike odor, and the decrease of FD value in 2,5-dimethylpyrazine and 2-ethyl-6-methyl-pyrazine with roasty odor probably induced the low sensory score. From the perspective of the influence of the matrix, the important aroma-active compounds identified by GC-O-MS in RO and FFs were quantified using the external standard method to calculate the respective OAVs. The contents of (E,E)-2,4-decadienal andtrans-4,5-epoxy-(E)-2-decenal and their OAVs were higher in all three ROs compared with the other compounds (Table 5), which were consistent with the results obtained by AEDA. However, the highest content of(E,E)-2,4-decadienal with the deep-fried odor was in RO15. Also, its content was decreased with the prolonged frying period, leading to a decline in deep-fried flavor. As reported in a previous study [30],the 2,4-decadienal can be degraded to 2-octenal and hexanal by retro-aldol condensation reactions. Moreover, it can also participate in the Mallard reaction, which may lead to a decline in 2,4-decadienal.The (E)-2-decenal, (E,E)-2,4-heptadienal and (E)-2-undecenal are important compounds of RO, as they show high relative peak areas [31]. Although the results of AEDA showed high FD value,higher OAV was not obtained in these aldehydes due to their relatively higher odor threshold in oil. The saturated fatty aldehydes,i.e. hexanal, octanal, and nonanal are typical lipid oxidation products,and they showed an increasing trend in RO with the frying time,therefore, the RO27 had the highest contents and OAVs. These saturated aldehydes are known to cause a rancid off-flavor in high contents [32]. As mentioned earlier, the saturated aldehydes especially hexanal can be degraded from the 2,4-alkadienals, thus induces an increase of these aldehydes [30]. The concentrations and OAVs of the four kinds of aroma-active acids compounds, i.e. hexanoic acid,heptanoic acid, octanoic acid and nonanoic acid in RO27 were higher than those of the other two samples, among which nonanoic acid had the highest OAV (101). Therefore, the four acids can be considered as the aroma compounds responsible for the sweaty and rancid off-flavor in RO due to the apparent difference in their concentrations among the three samples. Table 4 Odor contribution of volatile compounds of FFs and frying oil. As shown in Table 6, some aroma-active compounds, e.g.3-(methylthio)-propanal,2-ethyl-3,5-dimethyl-pyrazine,2,5-dimethyl-4-hydroxy-3(2H)-furanone, benzene acetaldehyde, and 2-methylbutyraldehyde were generated from Maillard reaction and were existed with high concentration and OAVs in the three FF samples. The high contents of these compounds were consistent with the results shown in previous studies [30,33]. Among them,the benzene acetaldehyde showed the highest concentration(66 353 μg/kg) and highest OAV (3 016) in FF27 compared with the FF15 (35 015 μg/kg, OAV = 1591) and FF4 (9 286 μg/kg,OAV = 422). The benzene acetaldehyde added a green/plant-like note at low concentrations but created a stale/cardboardy character at higher concentrations [34], which induced the high stale odor in FF27. The study carried out by Zamora et al. [35] reported that the lipid oxidation of unsaturated aldehydes (2,4-alkadienals, 4,5-epoxy-2-alkenals) could degrade phenylalanine to their corresponding Strecker aldehydes, i.e. benzene acetaldehyde. Therefore, we can speculate that these unsaturated aldehydes may induce more contents of benzene acetaldehyde with further frying. Besides, the contents and OAVs of 2,5-dimethylpyrazine and 2-ethyl-6-methyl-pyrazine were lower in FF27 compared with FF4 and FF15, which might be the reason for the decline of roasty flavor. Further, for the lipid oxidation of aldehydes, the (E,E)-2,4-decadienal with desirable deepfried odor were highest in FF15 leading to a higher desirable sensory score. The concentrations and OAVs of saturated aldehydes (hexanal,octanal, and nonanal) increased as frying time and FF27 had higher concentrations and OAVs of these saturated aldehydes compared with FF4 and FF15. Their high concentration probably led to the fatty and rancid off-flavor in FF27. In addition, the trans-4,5-epoxy-(E)-2-decenal showed the high OAV (343) in FF27 compared with FF4 (104)and FF15 (240), inducing the more metallic odor in FF27. Moreover,the hexanoic acid and heptanoic acid (both with sweaty and rancid odor) were only detected in the FF27. Whereas, the nonanoic acid in FF27 showed the highest OAV (OAV = 99), which was in accordance with the result of AEDA. Therefore, the rise of these acids caused a rancid off-flavor in FF27. However, the AEDA and OAVs results of (E,E)-2,4-nonadienal, (E)-2-undecenal, and 2,5-dimethylpyrazine were inconsistent, they showed high FD factor values (64) but low OAVs. Besides, the 2-Ethyl-3,5-dimethyl-pyrazine, hexanal, and nonanoic acid had low FD value (≤ 16), and high OAVs in FFs.Therefore, further validation of key aroma-active compounds by aroma recombination and omission experiment was essential. Table 5 Concentrations and OAVs of aroma-active compounds in frying oil samples. Table 6 Concentrations and OAVs of aroma-active compounds in FFs. The aroma recombination experiments were performed for validating the key aroma-active compounds in RO and FFs. As shown in Fig. 2, all odorants showed OAVs ≥ 1 in RO4, RO15, and RO27 were added to refined odorless rapeseed oil. Whereas, OAVs ≥ 1 in FF4, FF15, FF27 were added to odorless FFs to recombine the original samples. Twelve trained sensory panelists were recruited to evaluate the similarity of each recombination model of FFs and RO by using the triangle test of sensory evaluation. The results showed that 14, 16,and 19 aroma compounds were exhibited significant influence on the aroma profile of the recombination model of RO4, RO15, and RO27,respectively. Notably, octanal, 1-octanol, (E)-2-heptenal, nonanal,2-pentylfuran, (E)-2-octenal, (E)-2-nonenal, (E,E)-2,4-decadienal, andtrans-4,5-epoxy-(E)-2-decenal significantly affected all the RO aroma(P< 0.01). The hexanal, heptanal, (E,E)-2,4-heptadienal, and (E)-2-decenal also significantly affected all the RO aroma (P< 0.05). It is needed to point out that the (E,E)-2,4-nonadienal, (E)-2-undecenal,hexanoic acid, heptanoic acid, and nonanoic acid did not exhibit any effects on the RO4 flavor (P> 0.05). However, they both showed a significant effect on the RO27 (P< 0.05) (Table 7), which led to a higher rancid score in RO27. As presented in Figs. 3a–c, the aroma profile of the recombination model 3 revealed high similarity with RO4, RO15, and RO27 in terms of odor properties, such as green/grassy, metallic, deep-fried, fatty, sweaty, rancid flavors. Notably, as shown in the aroma profile that RO27 had a strong stale, metallic, and rancid flavor. Regarding overall resemblance, the recombined aroma model was rated with 2.5, 2.6, and 2.4 out of 3 points, relative to the original RO4, RO15 and RO27, respectively. Table 7 Omission experiment of high-oleic rapeseed frying oil. Fig. 2 The result of sensory evaluation among frying oils of RO4, RO15, RO27 (a) and FFs of FF4, FF15, FF27 (b). Fig. 3 Comparative aroma profile analysis of the RO4, RO15, RO27 and the respective aroma-recombination model 3 (a–c) as well as of the FF4, FF15, FF27 and the respective aroma-recombination model 3 (d–f). Table 8 Omission experiment of FFs. As shown in Table 8, there were 13, 18, and 22 aroma compounds that showed significant influence on the aroma profile for the recombination model of FF4, FF15, and FF27, respectively.The 2-methylbutyraldehyde, 2-ethyl-3,5-dimethyl- pyrazine,3-(methylthio)-propanal, benzene acetaldehyde, (E,E)-2,4-decadienal,trans-4,5-epoxy-(E)-2-decenal, and 2,5-dimethyl-4-hydroxy-3(2H)-furanone showed significant effect on all the FFs aroma(P< 0.01). In addition, the hexanal, octanal, nonanal (E)-2-heptenal,2-ethyl-3-methyl-pyrazine, and 1-octanol also significantly affected all the FFs aroma (P< 0.05). The (E)-2-octenal, benzaldehyde,(E)-2-nonenal, (E,E)-2,4-nonadienal, (E)-2-undecenal, hexanoic acid,heptanoic acid nonanoic acid did not show any effect on the FF4 flavor (P> 0.05). However, they both had a significant effect on the FF27 (P< 0.05) (Table 8). Besides, the 2-ethyl-6-methyl-pyrazine had no significant effect on FF27 (P> 0.05) compared with FF4 and FF15. This probably induced the lower roasty flavor in FF27. After the omission test, the results of sensory evaluation of each aroma recombination model 3 samples and the corresponding original FFs sample are shown in Figs. 3d–f. As shown in these plots, green and metallic attributes were not imitated successfully in FF4 (Fig. 3d).Whereas, FF15 and FF27 recombined aroma model showed overall similarities of 2.5 and 2.6, with their original samples, respectively.Therefore, the intensities of the odor attributes were very close(Figs. 3e–f). Nonetheless, our results confirmed that all the key odorants were successfully identified and quantified. During continuous use of RO, the flavor development of FFs showed three apparent stages (break-in, optimum, degrading). The flavor of FFs was improved during the first stage of frying (3.5%–7.5%of TPC). Further, it showed a higher flavor score in the next stage(7.5%–22.18% of TPC), and gradually became less acceptable in the last stage with a TPC content above 22.18%. Additionally, a systematic sensory-direct analysis showed that the unpleasant rancid flavor in RO27 and FF27 were mainly due to the newly generated acids, i.e. hexanoic, heptanoic, and nonanoic acid. Furthermore,the increase of a few saturated aldehydes (fatty odor) and benzene acetaldehyde (stale odor) might result in a lower sensory score.Therefore, in order to optimize a frying operation, it is essential to maintain the oil in this optimum stage for the longer duration possible and limiting the generation of this off-flavor. Conflicts of interest The authors declare that they have no known competing financial interests or personal relationships that could have appeared to influence the work reported in this paper. Acknowledgement This work was financially supported by the National First-Class Discipline Program of Food Science and Technology(JUFSTR20180202); Postgraduate Research & Practice Innovation Program of Jiangsu Province (KYCX20_1852); National Natural Science Foundation of China (31901728); Jiangsu Planned Projects for Postdoctoral Research Funds (2020Z297).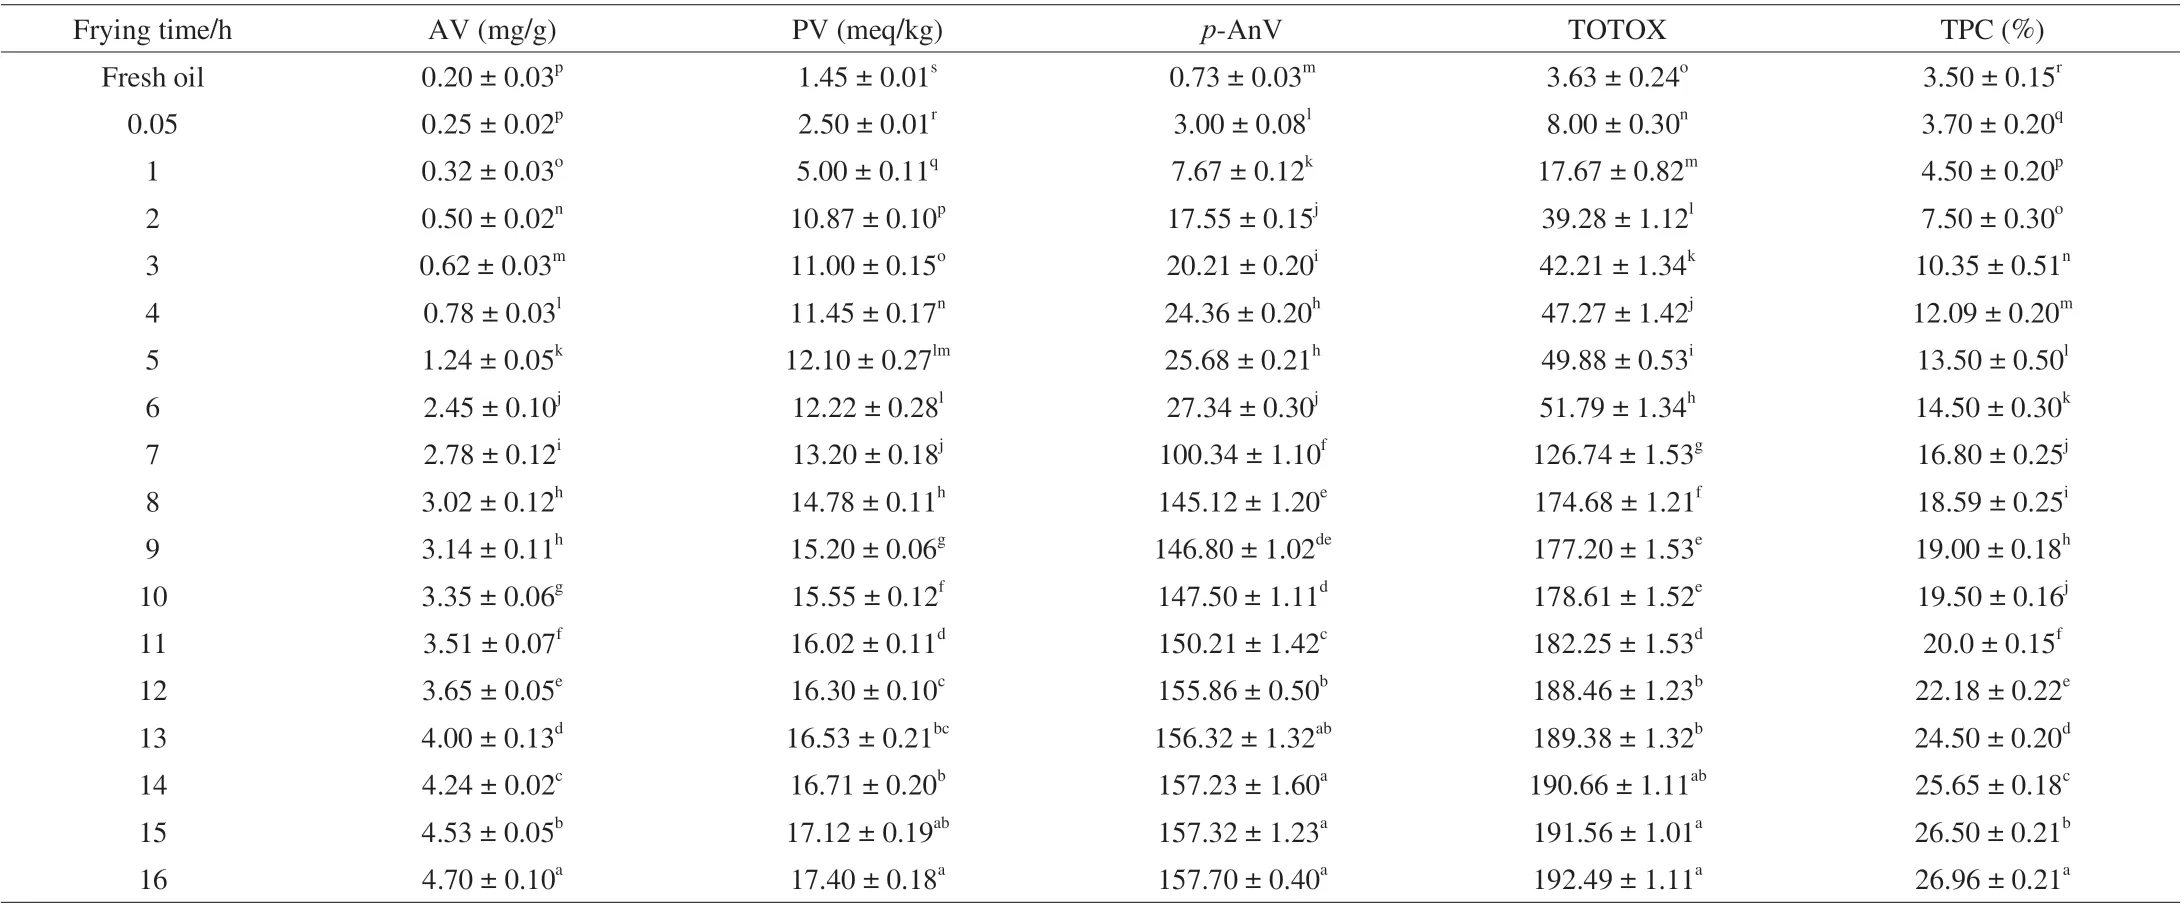
3.2 Influence of prolonged frying in RO on FFs sensory evaluation

3.3 Overall aroma evaluation
3.4 Identification of aroma-active compounds in RO4, RO15,RO27, FF4, FF15 and FF27 samples
3.5 Quantitation of the aroma-active compounds and calculation of OAVs
3.6 Aroma recombination and omission experiment
4. Conclusions
杂志排行
食品科学与人类健康(英文)的其它文章
- Evaluation and selection of yeasts as potential aroma enhancers for the production of dry-cured ham
- Preserved egg white alleviates DSS-induced colitis in mice through the reduction of oxidative stress, modulation of inf lammatory cytokines,NF-κB, MAPK and gut microbiota composition
- Energy status regulated umami compound metabolism in harvested shiitake mushrooms (Lentinus edodes) with spores triggered to release
- Edible mushrooms as a potent therapeutics of subclinical thyroid dysfunction among adults, especially in obese individuals: a prospective cohort study
- Screening hepatoprotective effective components of Lonicerae japonica Flos based on the spectrum-effect relationship and its mechanism exploring
- Effects of the degree of oral processing on the properties of saliva-participating emulsions: using stewed pork with brown sauce as the model
