Research on trend prediction of component stock in fuzzy time series based on deep forest
2022-12-31PengLiHengwenGuLiliYinBenlingLi
Peng Li|Hengwen Gu|Lili Yin|Benling Li
1School of Computer and Science and Technology,Harbin University of Science and Technology,Harbin,China
2Department of Military Industry Development,China Shipbuilding Industry Corporation 703 Research Institute,Harbin,China
Abstract With the continuous development of machine learning and the increasing complexity of financial data analysis,it is more popular to use models in the field of machine learning to solve the hot and difficult problems in the financial industry.To improve the effectiveness of stock trend prediction and solve the problems in time series data processing,this paper combines the fuzzy affiliation function with stock‐related technical indicators to obtain nominal data that can widely reflect the constituent stocks in the case of time series changes by analysing the S&P 500 index.Meanwhile,in order to optimise the current machine learning algorithm in which the setting and adjustment of hyperparameters rely too much on empirical knowledge,this paper combines the deep forest model to train the stock data separately.The experimental results show that(1)the accuracy of the extreme random forest and the accuracy of the multi‐grain cascade forest are both higher than that of the gated recurrent unit(GRU)model when the un‐fuzzy index‐adjusted dataset is used as features for input,(2)the accuracy of the extreme random forest and the accuracy of the multigranular cascade forest are improved by using the fuzzy index‐adjusted dataset as features for input,(3)the accuracy of the fuzzy index‐adjusted dataset as features for inputting the extreme random forest is improved by 18.89% compared to that of the un‐fuzzy index‐adjusted dataset as features for inputting the extreme random forest and(4)the average accuracy of the fuzzy index‐adjusted dataset as features for inputting multi‐grain cascade forest increased by 5.67%.
KEYWORDS deep forest,fuzzy membership function,price pattern,time series,trend forecast
1|INTRODUCTION
From the perspective of long‐term benefits,stock investments that are handled properly can generate better returns than other conservative investment methods,but successfully selecting dominant stocks from thousands of stocks is an extremely difficult task.Many financial companies have made great efforts to develop information technology,hoping that the analysis and mining of historical data can obtain hidden patterns to assist market forecasts and financial investment portfolio.At the same time,the prediction of stock market trend is also considered as a challenging direction in the study of financial time series[1–5].
The prediction of the stock market starts from the noisy,complex and chaotic data,so it is a challenging task to guide the researchers to find the predictable factors from the financial time series.The efficient market hypothesis points out that the distribution function of financial series is a kind of Brownian motion which conforms to the characteristics of random,independent and Gaussian distribution[6–9],while the inefficient market provides the basis for stock forecasting.In recent years,with the development of computer software and hardware,the generation,collection and storage of data are more and more convenient.On the one hand,the scale of data is gradually increasing;on the other hand,the complexity of data is also increasing.The superposition of the two aspects makes the difficulty of data analysis increase by leaps and bounds if only relying on the traditional methods.Therefore,the development and use of machine learning model is very important.Mining useful information from financial data has become an inevitable problem in finance and computer science.The traditional statistical methods are based on strict assumptions and lack the ability to deal with the actual financial time series problems.In particular,they may not be able to consider the dependence and combination significance between time series data.So,the paper uses general technical indicators as features.A feature of analysing stock index price patterns based on fuzzy logic and sliding window is introduced(this feature also represents the relationship between the index and the constituent stocks).
The above,as the first part of this article,introduces the challenges faced by the forecasting problems in the financial sector.The rest of this article is arranged as follows:The second part is a literature review,which analyses and summarises the work of related researchers;the third part is the introduction of models,including deep forest and random forest.The fourth part is the index of stock market,which introduces the common technical index used in stock market analysis;the fifth part is the analysis of typical reversal price patterns;the sixth part is the fuzzy set,including the generation of fuzzy membership function and fuzzy set;the seventh part is the description of TF‐IDF algorithm;the eighth part is the experimental process,including data acquisition and processing,feature extraction and model training;in the ninth part,the experimental results are analysed;the 10th part is the conclusion.
2|LITERATURE REVIEW
The literature in Ref.[10]uses 33 different technical indicators to predict the stock price.The use of this kind of technical index can connect the stock market experience knowledge with machine learning method,making the stock forecast more scientific and efficient.The literature in Ref.[11]points out that statistical methods obey the law of linear change in a certain period,generally do not support the automatic process,and need constant adjustment to make the target data tend to be consistent and stable.In Ref.[12],candlestick pattern detection and k‐NN regression are used to generate signals on candlestick chart to predict the accurate stock trend.Financial practitioners can predict the future market through different candlestick characteristics.The literature in Ref.[13]establishes a clear reference for different candlestick combinations,which is friendly for reuse and expansion.Wang LX[14]uses the fuzzy system theory to convert the technical trading rules commonly used by stock practitioners into an excess demand function,so as to follow the dynamic change of price.
The support vector machine model does not consider the time correlation knowledge between different data points in the time series,which affects the learning efficiency of the support vector machine in practical applications.In order to overcome this limitation,Zhang G et al.[15]proposed a Taylor expansion prediction model as an alternative to support vector machine and combined autoregressive integral moving average and Taylor expansion prediction to propose a new hybrid forecast method.In practice,indicators are mostly displayed graphically,and their direct impact on the quality of stock price forecasts has not been evaluated.Therefore,the work of Oriani et al.[16]evaluated the impact of different technical indicators on the stock closing price forecast.Hiransha uses four types of deep learning structures:Multilayer Perceptron(MLP),Recurrent Neural Network(RNN),Long Short‐Term Memory(LSTM),and Convolutional Neural Network(CNN)to predict the company's stock price[17];the results obtained are compared with the ARIMA model,and it is found that the performance of the neural network is better than the existing linear model(ARIMA).The literature in Ref.[18]takes the daily data of Shanghai composite index and Dow Jones Industrial Average as the research object and uses RNN and LSTM to build models,respectively.The standard for the pros and cons of the model is the error between the predicted value and the actual value.Finally,it is found that LSTM can be well applied to stock price prediction.Using neural network‐related algorithms,there are more parameters that need to be adjusted,and this process is easy to fall into the local optimum and it is difficult to reach the global optimum.Basak[19]uses XGBoost and Random Forest methods for classification to predict the rise or fall of stock prices based on previous values.The results show that this method has improved the prediction ability of several stocks.
The ensemble classifier is widely used in various fields[20]and produced many categories.The hyperparameter processing required by the above methods is too complicated or cannot effectively solve the time series problem,and deep forest algorithm is more suitable for the processing of such problems,that is,the multi‐granularity cascade forest can effectively mine the feature information under the time series and effectively reduce the destruction of the hidden information in the time series in the process of model construction.
3|MODEL INTRODUCTION
Multi‐Grained Cascade Forest(gcForest),also known as deep forest,is proposed by Zhihua Zhou and other researchers in machine learning field.It is not only a deep learning model but also an ensemble learning method.The concept of deep forest is based on the research of deep neural network model layer by layer processing,feature transformation and complex structure.The gcForest model combines the above characteristics of the deep neural network model[21]to generate a complex structure of the forest.And it is also an ensemble learning method based on the basic classifier of decision tree.It reduces the complexity caused by parameter adjustment,enhances the generalisation ability,and can get good results under the default setting environment.On the one hand,the original features of neural network are used to process the feature layer to strengthen the representation learning;on the other hand,the diversity of basic classifiers is expanded.
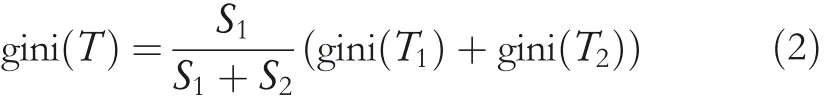
Decision tree is mainly based on continuous logical judgement to reach the final conclusion,in which the Gini coefficient and information entropy can quantify the disorder of a system.The calculation method of Gini coefficient is shown in Equation(1).

Trepresents the total sample,andpiis the proportion of samples belonging to categoryiinT.
Assuming thats1ands2are the respective sample sizes after being divided into two categories,Gini coefficient is shown in Equation(2).
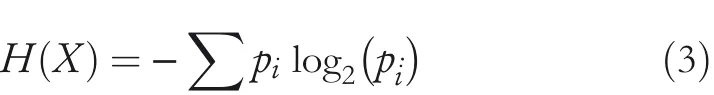
The calculation formulation of information entropy is shown in Equation(3),whereXis a random variable,the value of random variable isXiandiis a positive integer,which represents the number of classifications of the problem;pirepresents the probability that the random variableXtakes the valueXi.
When the condition for classification isv,the formula for calculating information entropy after dividing according to this condition is shown in Equation(4),whereW1andW2are the respective sample sizes of the two categories after division,andH X1()andH X2()are two types respective information entropy.

The reduced value of the information entropy of the classified system compared with that of the original system is called the information gain,and the calculation is shown in Equation(5).

The calculation process of Gini coefficient includes square operation,and the calculation process of information gain includes logarithmic operation,so it is faster to use Gini coefficient in decision tree.
Random forest is a bagging model with decision tree as weak learner.It randomly samples from the original dataset to formndifferent sample datasets and buildndifferent decision trees.Finally,it obtains the result according to the voting situation of these decision trees.
In deep forest model,the multi‐grained scanning stage is used to enhance the difference of input features,and cascade forest is used to enhance the classification ability of input features.
In the first stage of multi‐grained cascade forest model,multi‐grained scanning is the process of sample feature extraction,which can discover and process the sequence relationship of sequence data features.Sliding window is used to scan the original input feature.Assuming that the features of dataset are n‐dimensional,the size of the sliding window is m,and the size of each sliding is 1,(n−m+1)m‐dimensional feature vectors can be obtained.For the binary classification problem,combining the complete random forest and ordinary random forest used in multi‐grained scanning,each forest outputs(n−m+1)2‐dimensional vectors,and the different 2‐dimensional vectors of different forests are connected to obtain 4(n−m+1)dimensional feature vector.By setting different sliding window sizes,the purpose of multi‐grained scanning is achieved,and higher dimensional feature vectors are obtained.
In the second stage,each level of cascade forest is composed of a pair of forests such as ordinary random forest and completely random forest by default.The data is processed layer by layer,and each layer gets the feature data processed by the previous layer.In this process,the first layer uses the features obtained by multi‐grained scanning as the direct input,and each layer outputs the processed features to the next layer,which enhances the representation learning ability of the model.In the process of forming cascade forest,if the accuracy of the current layer is not improved after cross validation,the structure of cascade forest will stop.
In the multi‐grained cascade forest,a pair of ordinary random forest and complete random forest is used by default.However,the forest type can be set by itself.Some parameters can be self‐adaptive without customisation.Among them,in the completely random forest,each node randomly selects a feature as the dividing condition to generate child nodes,until each leaf node contains only instances of the same type.
4|STOCK MARKET INDEX
The candlestick chart expanded from rice market to stock market due to its special depiction.The market conditions of each day or a certain period are saved and displayed.And the performance of stock price in a certain period forms a unique pattern in the candlestick chart[22].The description of candlestick chart depends on the four original prices,namely,opening price,high price,low price,and closing price within a period.Opening price is the transaction price of the first transaction of a security in each trading cycle in the stock exchange.
Candlestick can be divided into white candle,black candle and no change.White candle means that opening price is lower than closing price.Black candle means that closing price is lower than opening price.
Candlestick has two components:entity and shadow.The opening price and closing price of the current cycle form an entity.The length of entity represents the difference between the opening price and closing price;shadow is divided into upper shadow and lower shadow according to different positions.Upper shadow refers to the difference between high price and closing price in white candle and the difference between high price and opening price in black candle;l ower shadow refers to the difference between low price and opening price in white candle and the difference between low price and closing price in black candle.
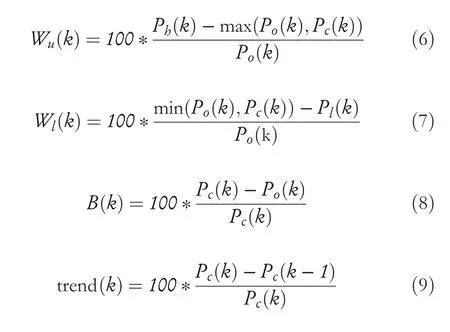
The opening price,closing price,high price and low price of day k are recorded asPo(k),Pc(k),Ph(k),andPl(k).The relative lengths of entity,upper shadow,and lower shadow in candlestick chart are recorded asB(k),Wu(k),andWl(k).Trend(k)represents the trend of 2 days.Their calculation is shown in Equations(6),(7),(8)and(9).
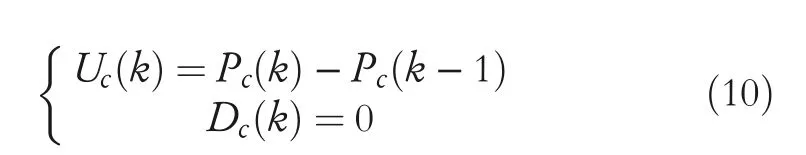
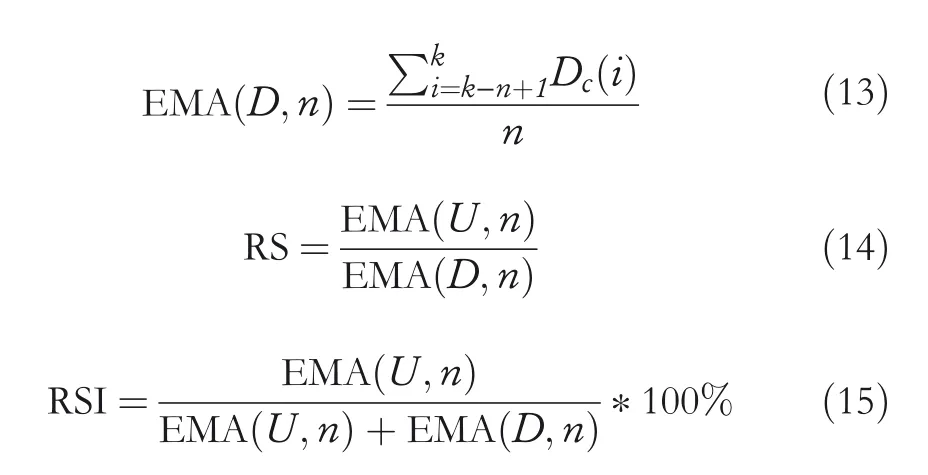
Since closing price is more representative of market trends than opening price,high price,and low price,stock price here is mainly represented by closing price.Relative strength index predicts the price trend through the change of stock in a specific period,mainly compares the average closing price rise and the average closing price fall,and indicates the market strength according to the increase range and fall range of stock price.In the calculation of relative strength index,Uc(k)represents the range of increase price in the rising day andDc(k)represents the range of decrease price on the day of decline.
If the closing price rises,that isPc(k)>Pc(k−1),there is Equation(10).
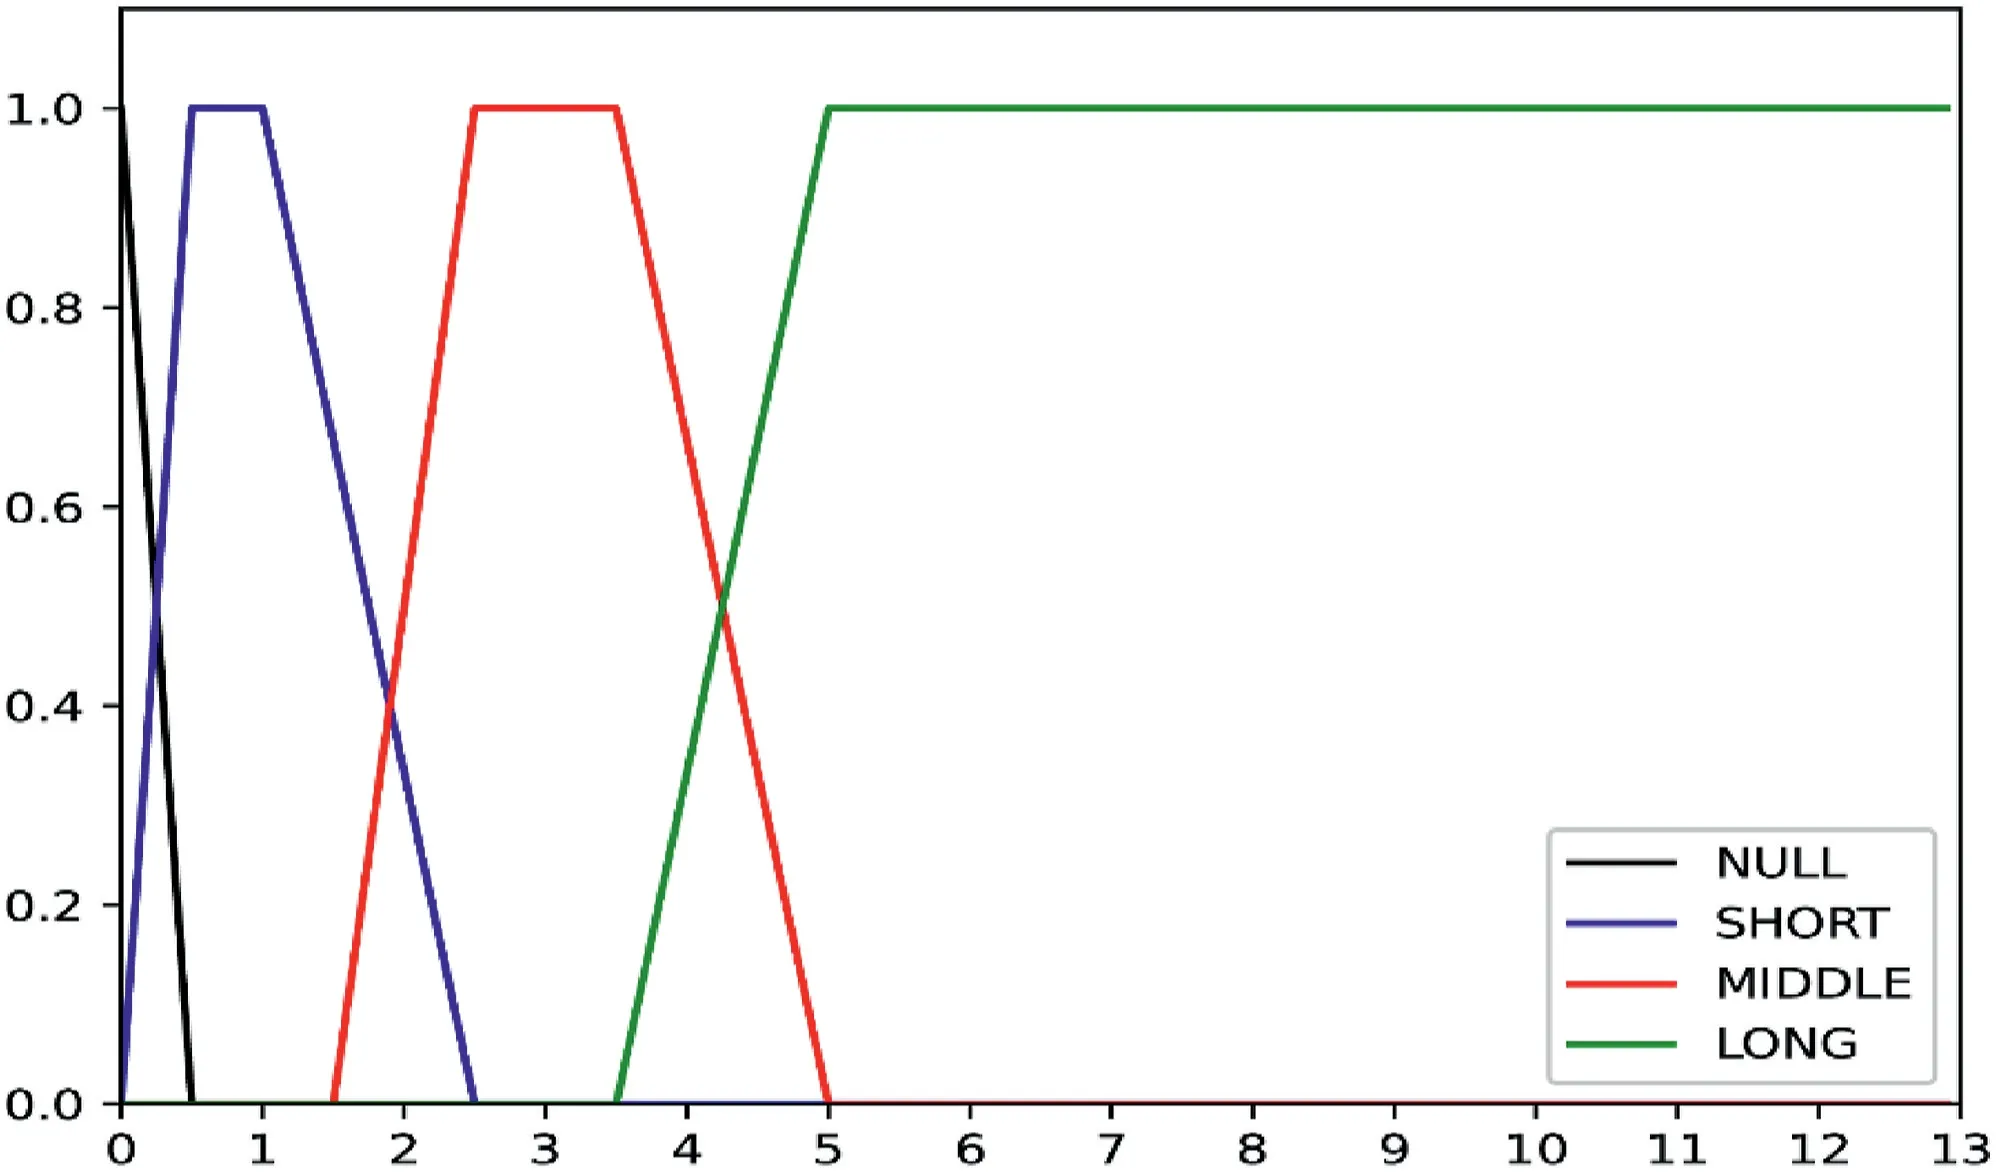
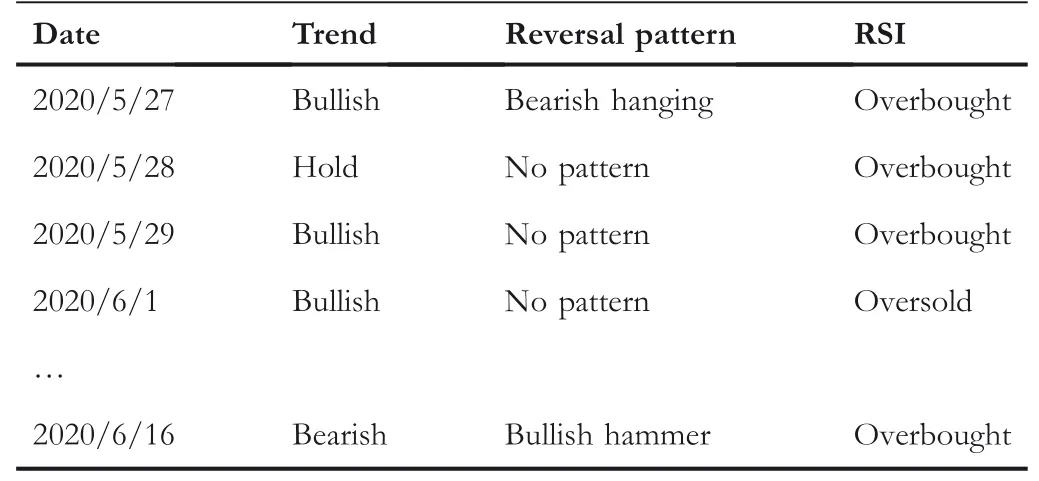
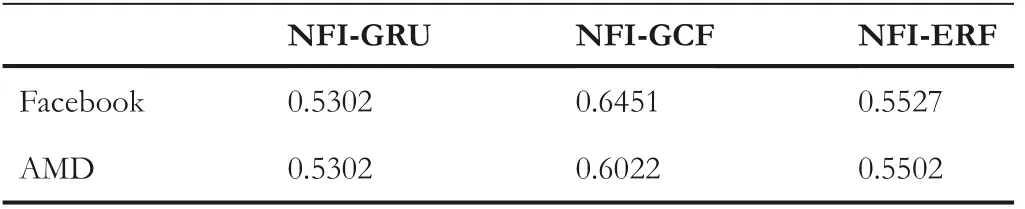
If the closing price falls,that isPc(k) The calculation process of relative strength(RS)and relative strength index(RSI)is shown in Equations(12),(13),(14),(15). Under the influence of the market,RSI changes in the range of 0–100,with 50 as the dividing line.Above 50,the market upward trend is greater than the downward trend;below 50,the market upward trend is less than the downward trend.According to the normal,RSI is mostly distributed in the range of 30–70.If RSI falls below 30,the oversold phenomenon is formed;if RSI rises above 70,it means overbought. From the rise and fall of RSI and the trend of real price,the divergence phenomenon which could predict the occurrence of market trend change can be found.In a bearish market,although the stock price once again reaches a new round of low prices,the RSI is in oversold area and no longer produces a new low or rises to a relatively high low,and the stock price is compatible with the RSI,which indicates that the market power has changed,bear market has turned to bullish market,and there is a buying opportunity.In the bullish market,although the stock price reaches a new high,the RSI is in overbought zone,and after reaching a new high,it does not rise and falls back to a relatively low high or near the last low indicating that there is a selling opportunity. In the bearish market,RSI first drops to oversold area,then rises and leaves,finally declines and no longer returns to below 30.In this time,RSI reaches a new recent high,which shows an upward trend.In the case of bullish market,RSI rises to overbought area,then falls off,finally rises and no longer reaches above 70.In this time,RSI reaches a new lowest point,which indicates a downward trend. The price pattern is the unique trend of stock price.Researching the graph formed by price changes can obtain information about market trends,forming a specific pattern with predictive significance and then assisting traders in analysis and judgement. In general market changes,from rising to falling or from falling to rising,the price pattern will have a critical area or typical pattern,which can also be called reversal pattern.The significance of appearance of the reversal pattern varies greatly with the length of time required and the range of fluctuations. The trend of the previous cycle is completely between the prices of the next cycle,which is called engulfing pattern.From the graphic point of view,the graphic colour of the two cycles is opposite,and the entity of the previous cycle is smaller than that of the next cycle,that is,the price of the previous cycle is between the opening and closing prices of the next cycle.This pattern is more suitable for periods when the trend of changes is obvious. Engulfing bearish:the market is in a rising state,with a white candle first and a black candle later,and the closing price of white candle is higher than the opening price of black candle,while the opening price of white candle is lower than the closing price of black candle.And the black candle is in a state of low opening and lowing closing,which means that the current black candle can completely contain the white candle of the previous cycle. The formation initial rule:B(4)>0.5 andB(5)<−0.5 andPh(4)≤Po(5)andPl(4)≥Pc(5) The market is in a falling rate,with a black candle first and a white candle later,and the current white candle can completely contain the black candle of the previous cycle. The formation initial rule:B(4)<−0.5 andB(5)>0.5 andPh(4)≤Pc(5)andPl(4)≥Po(5) In a continuously falling market,a long black candle or middle black candle is formed the previous day,and then a long white candle or middle white candle.The entity of the white candle is above the middle of the previous black candle's entity.From the technical analysis,including the downtrend has reached a bottom,there is a greater probability of bottoming out.If it is a bottom trend,the white candle's entity cannot reach half of the black candle's entity,and it often shows a down ward relay pattern. The formation initial rule:B(4)<−0.5 andB(5)>0.5 andPo(5) It is composed of two periods of graph lines.The first graph entity is longer,the second entity is shorter,and the second entity is between the beginning and end of the first entity.In this form,the shadow has less effect.And it can be divided into several types according to white candle and black candle.This kind of pattern has a better grasp of the short‐term market. Bearish harami:the market is in the rising;first a longer white candle appears,then a shorter black candle can be completely engulfed. The formation initial rule:B(4)<−0.5 andB(5)>0.5 andPo(4)≥Ph(5)andPc(4)≤Pl(5) When the market is in the rising stage,the high price per unit cycle is the opening price and the closing price is lower than and close to the opening price.In graphic representation,the entity is short,while the upper shadow is short or none,and the lower shadow is long(the length of the lower shadow is more than twice that of the entity).This pattern is in a bearish phase. The formation initial rule:Ph(5)>Pc(4)and{Ph(5)−max(Po(5),Pc(5))} In this pattern,the closing price is close to the high price,and the upper shadow is shorter or absent on the graph.At the same time,the entity is shorter and the lower shadow is longer(the length of the lower shadow is more than twice that of the entity).Before the appearance of this pattern,the trend was in a downward state,and its appearance marked the emergence of an upward trend. The formation initial rule:Pl(5) Fuzzy set theory was founded in 1965.The fuzzy set proposed by L.A.Zadeh is defined by membership function.Fuzzy membership function can be determined by empirical knowledge,binary comparison sorting,and statistical experiment.The empirical knowledge method,that is,the determination of membership function is based on reliable empirical knowledge,and the fuzzy set defined by this method is more effective for uncertain problems. The establishment of fuzzy logic is to deal with the problem that some parts are not in either‐or form but need to make judgements based on fuzzy and partly known data.The idea is to convert values into categories and then perform modelling.Fuzzy logic itself is not a machine learning method,but it can exist as a method of data preprocessing before machine learning model training.In some cases,some accurate features lose meaning,and meaningful features lose accuracy.Through the characteristics of fuzzy logic itself,inadequate reasoning judgement can get the results with more practical significance. The basic definition of fuzzy set:for the set S,F is a fuzzy set about S,andxis any element of S,μF(x)in the closed interval 0–1 can be determined.μF(x)is the membership degree of the elementxin S to the fuzzy set F. This research is based on fuzzy logic to predict time series data.Information is extracted from stock price data and candlestick chart,and fuzzy time series data is obtained by fuzzy processing of time series‐related attributes[23–30],which is converted into a rule base file that can be saved for query,to carry out trend prediction.For the result prediction problem,input the index data of the sample and output the prediction result.The whole process can be divided into three steps.The first step is to confirm the function of a single index,that is,to clarify the membership function;the second step is to synthesise a single index to form an overall index function and complete the fuzzy classification;the third step is to apply the whole index function to predict the samples based on the principle of maximum membership. In order to facilitate quantification and analysis,the fuzzification process can be regarded as a comprehensive evaluation process.The attributes of the forecast sample set for the stock market prospects are upper shadow,lower shadow,and entity.Entity is blurred into LONG‐BLACK,MIDDLE‐BLACK,SHORT‐BLACK,EQUAL,SHORT‐WHITE,MIDDLE‐WHITE,and LONG‐WHITE.Shadow is blurred into NULL,SHORT,MIDDLE,and LONG. The salient features of price pattern are extracted into corresponding entity and shadow line features.With reference to the fuse mechanism of the US stock market,this article's constraints on changes to shadow and entity are embodied in fuzzy membership functions.The horizontal axis in Figure 1 is the amplitude of shadow changes,and the horizontal axis in Figure 2 is the amplitude of entity changes. FIGURE 1 Shadow fuzzy membership function FIGURE 2 Entity fuzzy membership function After the initial rule of bullish piercing line,the fuzzy entity is LONG‐BLACK or MIDDLE‐BLACK on fourth day.After the initial rule of bearish hanging,the fuzzy lower shadow is NULL on the fifth day.After the initial rule of bullish hammer,the fuzzy lower shadow is NULL on the fifth day.In this paper,the time series data are transformed into fuzzy time series data by the sliding window of 5 days,and classified into three types of data representing rising,falling and holding. TF(Term Frequency)refers to the number of times a target appears in a document.In view of the different importance of targets,the more important targets are given greater weight,which is called inverse document frequency(IDF).TF‐IDF is the product of TF and IDF.The more important the target is,the greater the TF‐IDF value is. In the actual experiment,TF can be standardised differently.Here,the term frequency is the ratio of the number of the target in the document to the total number of words in the document.The method for calculating IDF is shown in Equation(16),whereNis the total number of texts in the document set,andnis the number of occurrences of the target. Get U.S.stock data through the Yahoo Finance interface,including high,low,opening,closing and trading volume of Facebook,AMD and S&P 500 Index from 3 January 2017 to 6 June 2020.The sample data of S&P 500 index(from spy)used in this study are shown in Table 1. The dataset was traversed according to fuzzy rules,and the time series data was converted into fuzzy language time series data,as shown in Table 2. The processed data is retrieved in the fuzzy language time series collection,and TF‐IDF is used for matching,and finallya one‐dimensional vector representing the state of the stock index will be obtained,that is,a collection that indicates an upward trend or a downward trend. TABLE 1 Sample data of S&P 500 Index Perform exponential smoothing on the obtained component stock data,and perform feature extraction on the data to obtain a dataset containing technical indicators. Combine the dataset predicted by fuzzy rules,that is,the discrete set characterised by stock index trends and the processed individual stock technical indicator dataset to obtain a new feature data set.The finally obtained feature set is shown Table 3,where FI is the stock index feature extracted by fuzzy rules. Setting parameters in Extreme Random Forest:random_state=3,n_jobs=4,n_estimators=130,max_depth=40,bootstrap=1,min_samples_split=10,and min_samples_leaf=30.Setting parameters in Multi‐Grained Cascade Forest:shape_1X=13,window=5,and tolerance=0.0.The deep forest architecture for stock price prediction proposed in this paper is shown in Figure 3. To examine the superiority of the proposed model in this paper,we selected the gated recurrent unit(GRU)model,which is more popular for processing time series,as acomparison.We take the dataset without fuzzy indices as input features,and the ROC curves of Facebook stock after training with the GRU model,multi‐granularity cascade forest and extreme random forest are shown in Figure 4. TABLE 2 Sample data of fuzzy language time series We take the dataset without fuzzy indices as input features,and the ROC curves of AMD stocks after training with GRU model,multi‐granularity cascade forest and extreme random forest are shown in Figure 5. FIGURE 3 Stock price forecasting framework TABLE 3 Selected indicator set FIGURE 4 Gated recurrent units(GRU),extreme random forests,and multi‐granularity cascade forests to train ROC curves for the Facebook dataset without FI.(a)ROC curves for gated recursive units(GRU).(b)ROC curves for extreme random forests.(c)ROC curves for multi‐grain size cascade forests FIGURE 5 Gated recursive unit(GRU),extreme random forest,and multi‐grain size cascade forest train ROC curves for the AMD dataset without FI.(a)ROC curves of gated recursive unit(GRU).(b)ROC curve of extreme random forest.(c)ROC curve of multi‐grain size cascade forest TABLE 4 Accuracy of the three models on the Facebook and AMD datasets without FI We take GRU model,multilevel cascade forest and extreme random forest to train the dataset without FI,and the three models are denoted as NFI‐GRU,NFI‐GCF and NFI‐ERF,respectively.The prediction accuracy of the three models for Facebook and AMD stocks is shown in Table 4. In the dataset without FI,we can see by Table 4 that both the extreme random forest and the multi‐granularity cascade forest have a higher prediction accuracy than the gated recurrent cell.Since ordinary random forest and complete random forest are used by default in multi‐grained cascade forest,extreme random forest is used for comparison. FIGURE 6 ROC curves of extreme random forest and multi‐grain cascade forest trained on the Facebook dataset containing FI.(a)ROC curve of extreme random forest.(b)ROC curve of multi‐grain cascade forest We use the dataset of fused fuzzy indices as input features,and the ROC curves of Facebook stock after training with multi‐grain cascade forest and extreme random forest are shown in Figure 6. After adding fuzzy indices to the Facebook dataset,the prediction accuracy of the multi‐granular cascade forest for stocks improved from 0.6451 to 0.6607.The prediction accuracy of the extreme random correlation forest for stocks improved from 0.5527 to 0.6231. We use the dataset of fused fuzzy indices as input features,and the ROC curves of AMD stocks after training with multi‐grain cascade forest and extreme random forest are shown in Figure 7. After adding fuzzy indices to the AMD dataset,the prediction accuracy of the multi‐granularity cascade forest for stocks improves from 0.6022 to 0.6920.The prediction accuracy of the extreme random forest for stocks improves from 0.5520 to 0.6563. FIGURE 7 ROC curves of extreme random forest and multi‐texture cascade forest trained on the AMD dataset containing FI.(a)ROC curves of extreme random forest.(b)ROC curve of multi‐grain cascade forest This paper combines fuzzy logic and multi‐grained cascade forest model to obtain the stock index trend after fuzzy prediction.According to the experimental results,the characteristics obtained from the fuzzy processing of stock index are beneficial to the prediction of the constituent stocks of the model.This is in the multi‐granularity cascade forest and extreme forest models have been validated.The results of the experiment also show that the S&P 500 index is positive in predicting the trend of its constituent stocks. This paper takes S&P 500 Index and several stocks of American stock market as research object,and applies the multi‐granularity cascade forest,an ensemble learning model,which deals with the hot issue about stock.The study summarises the method of using price pattern combined with fuzzy membership function to predict the characteristics of stock index trends.This method fully considers the characteristics of financial time series and structurally handles time dependence through a sliding window. Future research can continue to improve the method of price pattern analysis,use more typical reversal patterns,or further refine the fuzzy membership function to obtain a smaller granular evaluation interval.In addition,this article starts from the relationship between the index and the constituent stocks and combines the features extracted from the stock index with the constituent stocks.Therefore,the analysis and fuzzy evaluation of the price pattern of individual stocks alone should also be a direction worth studying. ACKNOWLEDGEMENT This paper is supported by the Fundamental Research Foundation for Universities of Heilongjiang Province(LGYC2 018JQ003). CONFLICT OF INTEREST The author declares that they have no conflict of interest. DATA AVAILABILITY STATEMENT The data that support the findings of this study are available from the corresponding author upon reasonable request. ORCID Peng Lihttps://orcid.org/0000-0003-2289-305X Lili Yinhttps://orcid.org/0000-0002-4884-0231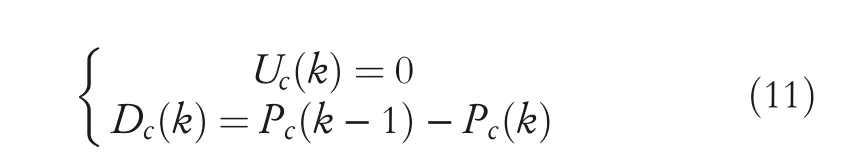

5|REVERSAL PATTERN
5.1|Engulfing bearish
5.2|Engulfing bearish
5.3|Bullish piercing line
5.4|Bearish harami
5.5|Engulfing hanging
5.6|Bullish hammer
6|FUZZY SET

7|TF‐IDF
8|EXPERIMENT

9|ANALYSIS OF EXPERIMENTAL RESULTS


10|CONCLUSION
杂志排行

CAAI Transactions on Intelligence Technology的其它文章
- Modelling of a shape memory alloy actuator for feedforward hysteresis compensator considering load fluctuation
- Apple grading method based on neural network with ordered partitions and evidential ensemble learning
- An improved bearing fault detection strategy based on artificial bee colony algorithm
- Parameter optimization of control system design for uncertain wireless power transfer systems using modified genetic algorithm
- Passive robust control for uncertain Hamiltonian systems by using operator theory
- Humanoid control of lower limb exoskeleton robot based on human gait data with sliding mode neural network