Meta-analysis on the epidemiology of gastroesophageal reflux disease in China
2022-12-09TaiLiangLuShaoRongLiJiaMinZhangChaoWuChen
Tai-Liang Lu, Shao-Rong Li,Jia-Min Zhang, Chao-Wu Chen
Abstract
Key Words: China; Meta-analysis; Gastroesophageal reflux disease; Prevalence; Epidemiology;Spatiotemporal trends
INTRODUCTION
Gastroesophageal reflux disease (GERD) refers to the symptoms or complications caused by the reflux of gastric contents into the oesophagus or further into the oral cavity (including larynx) or lung field[1].The main symptoms of GERD are heartburn, reflux, bulbar sensation, dysphagia, chest pain, hiccups,etc.[2]. It may also present extraesophageal symptoms, including chronic cough, laryngitis, asthma, and tooth erosion[3]. GERD is a common disease with a global prevalence of approximately 13%[4,5].According to reports, the prevalence of GERD was highest in North America, ranging from 18.1% to 27.8%, followed by 8.8% to 25.9% in Europe, and the lowest from 2.5% to 7.8% in Asia[6,7]. As a chronic disease with a high prevalence rate, GERD has brought substantial economic and health burdens to patients and society[8,9] and may lead to tumours[10]. In addition to laboratory methods[11], several standard scales are used to evaluate GERD, including the gastroesophageal reflux disease questionnaire(GerdQ)[12] and the reflux disease questionnaire (RDQ)[13].
The prevalence of GERD in China is lower than the worldwide rates[4,5]. However, no ethnicity-wide large-scale epidemiological survey or meta-analysis on the majority of GERD in China has been conducted to date. Due to the differences in regions, periods, populations, sampling methods, and diagnostic criteria, there are significant differences in the survey results of existing studies. China has a vast area and many races, which will lead to significant differences in the prevalence of GERD.Therefore, we conducted this meta-analysis to explore the prevalence of GERD in the natural Chinese population, to analyze its spatial, temporal, and population distributions, and to explore its geographical connection with upper gastrointestinal cancer.
MATERIALS AND METHODS
Subject design
We searched the literature on GERD in adults in mainland China, conducted a meta-analysis to explore the prevalence of GERD, and assessed the disease’s spatial, temporal, and population distributions through subgroup analysis. Then, using the pooled prevalence of different provinces as the dependent variable, we analyzed the spatial trend and spatial aggregation of GERD. Using the pooled prevalence in other cities, we analyzed the correlation between GERD and upper gastrointestinal tumours.
Literature search
The PubMed, EMBASE, WanFang, VIP, and CNKI databases were systematically and independently searched for studies reporting the prevalence of GERD in Chinese adults from database inception to January 1, 2022. The search terms used in this study were as follows: ('China' or 'Chinese') and('Gastroesophageal reflux' or 'GERD') and ('prevalence' or 'epidemiology survey'). All included literature has been officially published. There were no language restrictions or publication date restrictions on this search. We also manually searched the references of the selected papers to avoid omission. In addition, the incidence rate of upper gastrointestinal tumours came from the "China Cancer Registration Annual Report 2019", which reported the tumour monitoring data of more than 200 cities.We supplement and improve the highlights of the latest cutting-edge research results using the Reference Citation Analysis (https://www.referencecitationanalysis.com/) in the process of revising the manuscript.
Study selection
Original studies that fulfilled the following criteria were included in the meta-analysis: the subjects were adults in mainland China, the study type was a cross-sectional epidemiological survey, the sample size and the number of patients could be obtained, and the sample size was more than 200. Articles were excluded if they met the following criteria: The same data were reported in multiple articles, the articles were case reports or reviews, and the articles included surveys for particular groups, such as hospital patients, students, soldiers, and miners.
Quality evaluation
Following the methods of a previous study[14], we developed a quality rating scale with eight items.For each item, 1 point was awarded for meeting the standard requirements, and 0 points were awarded for not mentioning or not conforming to the standard. The score of each article was between 0 and 8.Literature ≤ 3 points was considered “low quality” and was excluded.
Data extraction
LTL and ZJM independently searched for literature, evaluated the literature quality, and extracted the data. In case of disagreement, CCW participated in the discussion and helped to form an agreement.The extracted information included the survey period, the survey location (province and city), sampling method, diagnostic tools and standards, sample size, number of patients, and demographic data(including ethnicity, sex, gender, body mass index (BMI), residence, marital status, education, income,occupation, smoking, alcohol consumption, tea drinking, physical exercise,Helicobacter pylori, and life stress). In addition, the incidence rates of tumours in the oral cavity, nasopharynx, throat, oesophagus,and stomach of the cities involved were collected from the "2019 annual report on cancer registration in China".
Statistical analyses
The statistical methods of this study have been published previously[15]. We used R software (version 4.0.1) for meta-analysis and subgroup analysis according to study design, survey period, survey area,and other information. TheI2statistic test was used to evaluate the heterogeneity in the included literature.I2> 50% was considered heterogeneity, and a random effect model was adopted; IfI2≤ 50%,then a fixed effect model was used. We used Begg’s test to assess publication bias and we used sensitivity analysis to assess the stability of the results. Meta-regression analysis was used to control the influence of interference factors.
We used ArcGIS software (version 10.6) to make a statistical map of the pooled prevalence rate in each province. ArcGIS was also used to create a trend analysis chart to evaluate the spatial changes in diseases[16]. The X-axis, Y-axis, and Z-axis of the chart represent longitude, latitude, and prevalence,respectively. Geoda software (version 1.12) was used for spatial autocorrelation analysis of diseases.Global Moran's I index was used to evaluate global spatial autocorrelation. The Lisa cluster map and Lisa significance map were used to describe local spatial autocorrelation[17,18]. Spearman correlation analysis was performed with R software to explore the effect of GERD on the incidence rate of upper gastrointestinal tumours. In addition, we used R software to draw a violin diagram, line charts and correlation heat diagram. A 2-sidedP< 0.05 indicated a significant difference.
RESULTS
Literature screening results and the pooled prevalence
The literature screening process is shown in Figure 1. A total of 70 articles were included in our study,including 52 published in Chinese and 18 published in English. Limited by the article's length, the essential characteristics of the included literature are shown in Supplementary Table 1. A total of 276014 people from 24 provinces of mainland China were enrolled in the study, and 27386 people were diagnosed with GERD. The quality assessment ranged from 4 to 8, with an average of 6.01. In the 70 articles, the GERD prevalence ranged from 1.65% to 28.07%, and the pooled prevalence was 8.7%(95%CI: 7.5%-9.9%). TheI2was 99.4%, so the random effect model was adopted. Begg’s test indicated no publication bias in this study (Z= 1.11,P= 0.269). The results of the sensitivity analysis showed that the pooled prevalence remained stable. To exclude the influence of research design, we conducted subgroup analyses according to the questionnaire used, random sampling, quality score, and sample size. We found that the prevalence rates estimated by different questionnaires were inconsistent (Q=15.88,P= 0.001). The GerdQ estimated the highest GERD prevalence rate, and the RDQ estimated the lowest. The other three indicators had no effect on the results (P> 0.05).
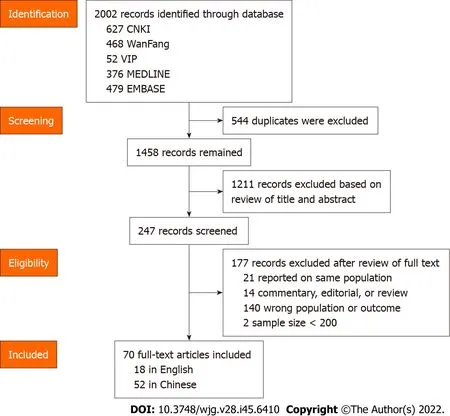
Figure 1 Flowchart of the selection of studies.
Spatial, temporal, and population distributions
Figure 2A is a violin chart of the actual prevalence, and Figure 2B is a line chart of the pooled prevalence in different periods. In the past 20 years, the prevalence of GERD in China showed an upwards trend (Q= 11.81,P= 0.019). After controlling for the influence of regions and questionnaires by meta-regression analysis, this trend still existed (t= 2.37,P= 0.020). Figure 3 shows the regional distribution of the prevalence of GERD. From the map, the prevalence of GERD was different in different provinces, with the highest prevalence in Xinjiang at 19.1% (95%CI: 13.5%-24.7%) and the lowest prevalence in Guangdong at 3.3% (95%CI: 2.2%-4.3%). Overall, the prevalence rate was high in the eastern and western regions and low in the central region (Q= 9.18,P= 0.010). Supplementary Figure 1 shows the geographical division. The difference was still significant after excluding the influence of times and questionnaires (t= 2.01,P= 0.049). Figure 4 shows a forest plot of GERD prevalence for subgroup analysis by demographic characteristics. We selected 15 indicators for demographic subgroup analysis.The results showed that age (Q= 48.86,P< 0.001), ethnicity (Q= 14.15,P= 0.027), and BMI (Q= 5.50,P= 0.049) were statistically significant.
Spatial trend distribution and correlation analysis
The prevalence in the east-west distribution (X-axis) showed the change characteristics of falling and rising, and all fitted trend lines (green curve) showed a U-shape. In the north-south distribution (Y-axis),the fitting trend line (blue curve) was opposite, with low prevalence at both ends and high prevalence in the middle (see Figure 5A). In Figure 5B, the Moran’s I value was 0.145, and the Monte Carlo simulationPvalue was 0.103, indicating no global spatial autocorrelation. However, as shown in Figures 5C and D,the results of local spatial autocorrelation analysis showed that the Qinghai-Tibet Plateau was a high-tohigh aggregation area of GERD, and Hunan and Fujian were low-to-low aggregation areas. A total of 36 cities were involved in the meta-analysis, of which 24 cities were able to obtain tumour incidence rates and were included in the correlational analysis. The results showed that GERD was correlated with gastric (r= 0.511,P= 0.011) and oesophageal tumours (r= 0.421,P= 0.041) (see Figure 6).

Figure 2 Prevalence of gastroesophageal reflux disease in different periods. A: Violin diagram of the original prevalence; B: Line chart of the pooled prevalence.
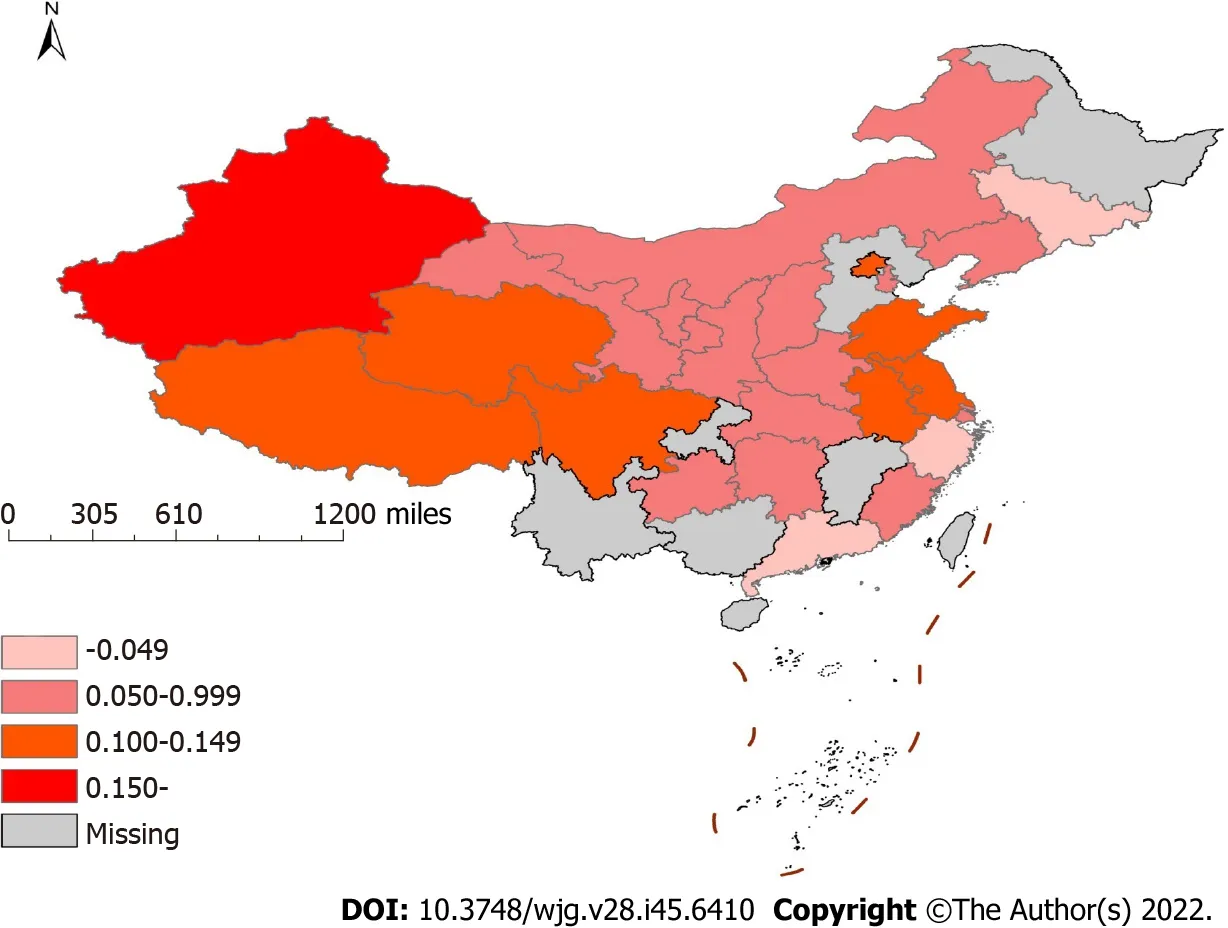
Figure 3 Prevalence of gastroesophageal reflux disease in different provinces of China.
DISCUSSION
This is the first meta-analysis on the prevalence of GERD in the Chinese natural population. The majority of GERD cases in China were 8.7% (95%CI: 7.5%-9.9%), which was lower than that in European and American countries but higher than the estimated 2.5%-5.0% GERD prevalence in previous global reviews[4-7]. This meta-analysis included 70 studies, and the distribution of effect values showed nonnormality (P< 0.001). Therefore, we used the nonparametric Begg test to test publication bias and found that there was no bias in this study[19]. Sensitivity analysis showed that our results were stable.
To control the influencing factors, we also conducted a subgroup analysis according to the type of study design. Our results were not related to random sampling, literature quality or sample size but were influenced by the survey instrument used. In the meta-analysis stratified by prevalence survey, the prevalence was inconsistent among different survey tools, which has been previously reported[4,14].This study applied the RDQ, GerdQ and other survey tools. Previous studies have shown that these questionnaires exhibit good psychometric characteristics and are suitable for application in primary health care[11-13]. The GerdQ and RDQ were considered to have the same screening effect[12].However, in our study, the GerdQ estimate of the prevalence of GERD was higher than the estimate of RDQ. When we excluded the influence of survey time and area through meta-regression, there was no difference in the prevalence between survey tools.
Our study revealed that the prevalence of GERD in China is rising. From 6.0% at the beginning of the 21stcentury to 10.6% at present, there was a significant difference in the prevalence among different periods (P= 0.019). After controlling for the survey tools and regions, differences still existed. Chenet al[20] reported that during the period 2000-2007, the indications for referral endoscopy secondary to GERD increased over time. A study found that in Hong Kong, the prevalence of weekly GERD rose by 1.3% between 2002 and 2011, which represents at least a 50% relative increase[21]. Additionally, two other studies[7,22] provided evidence that the global GERD prevalence has increased over the past two decades. The increase in bulk may be due to changes in people's lifestyles caused by economic development[23].
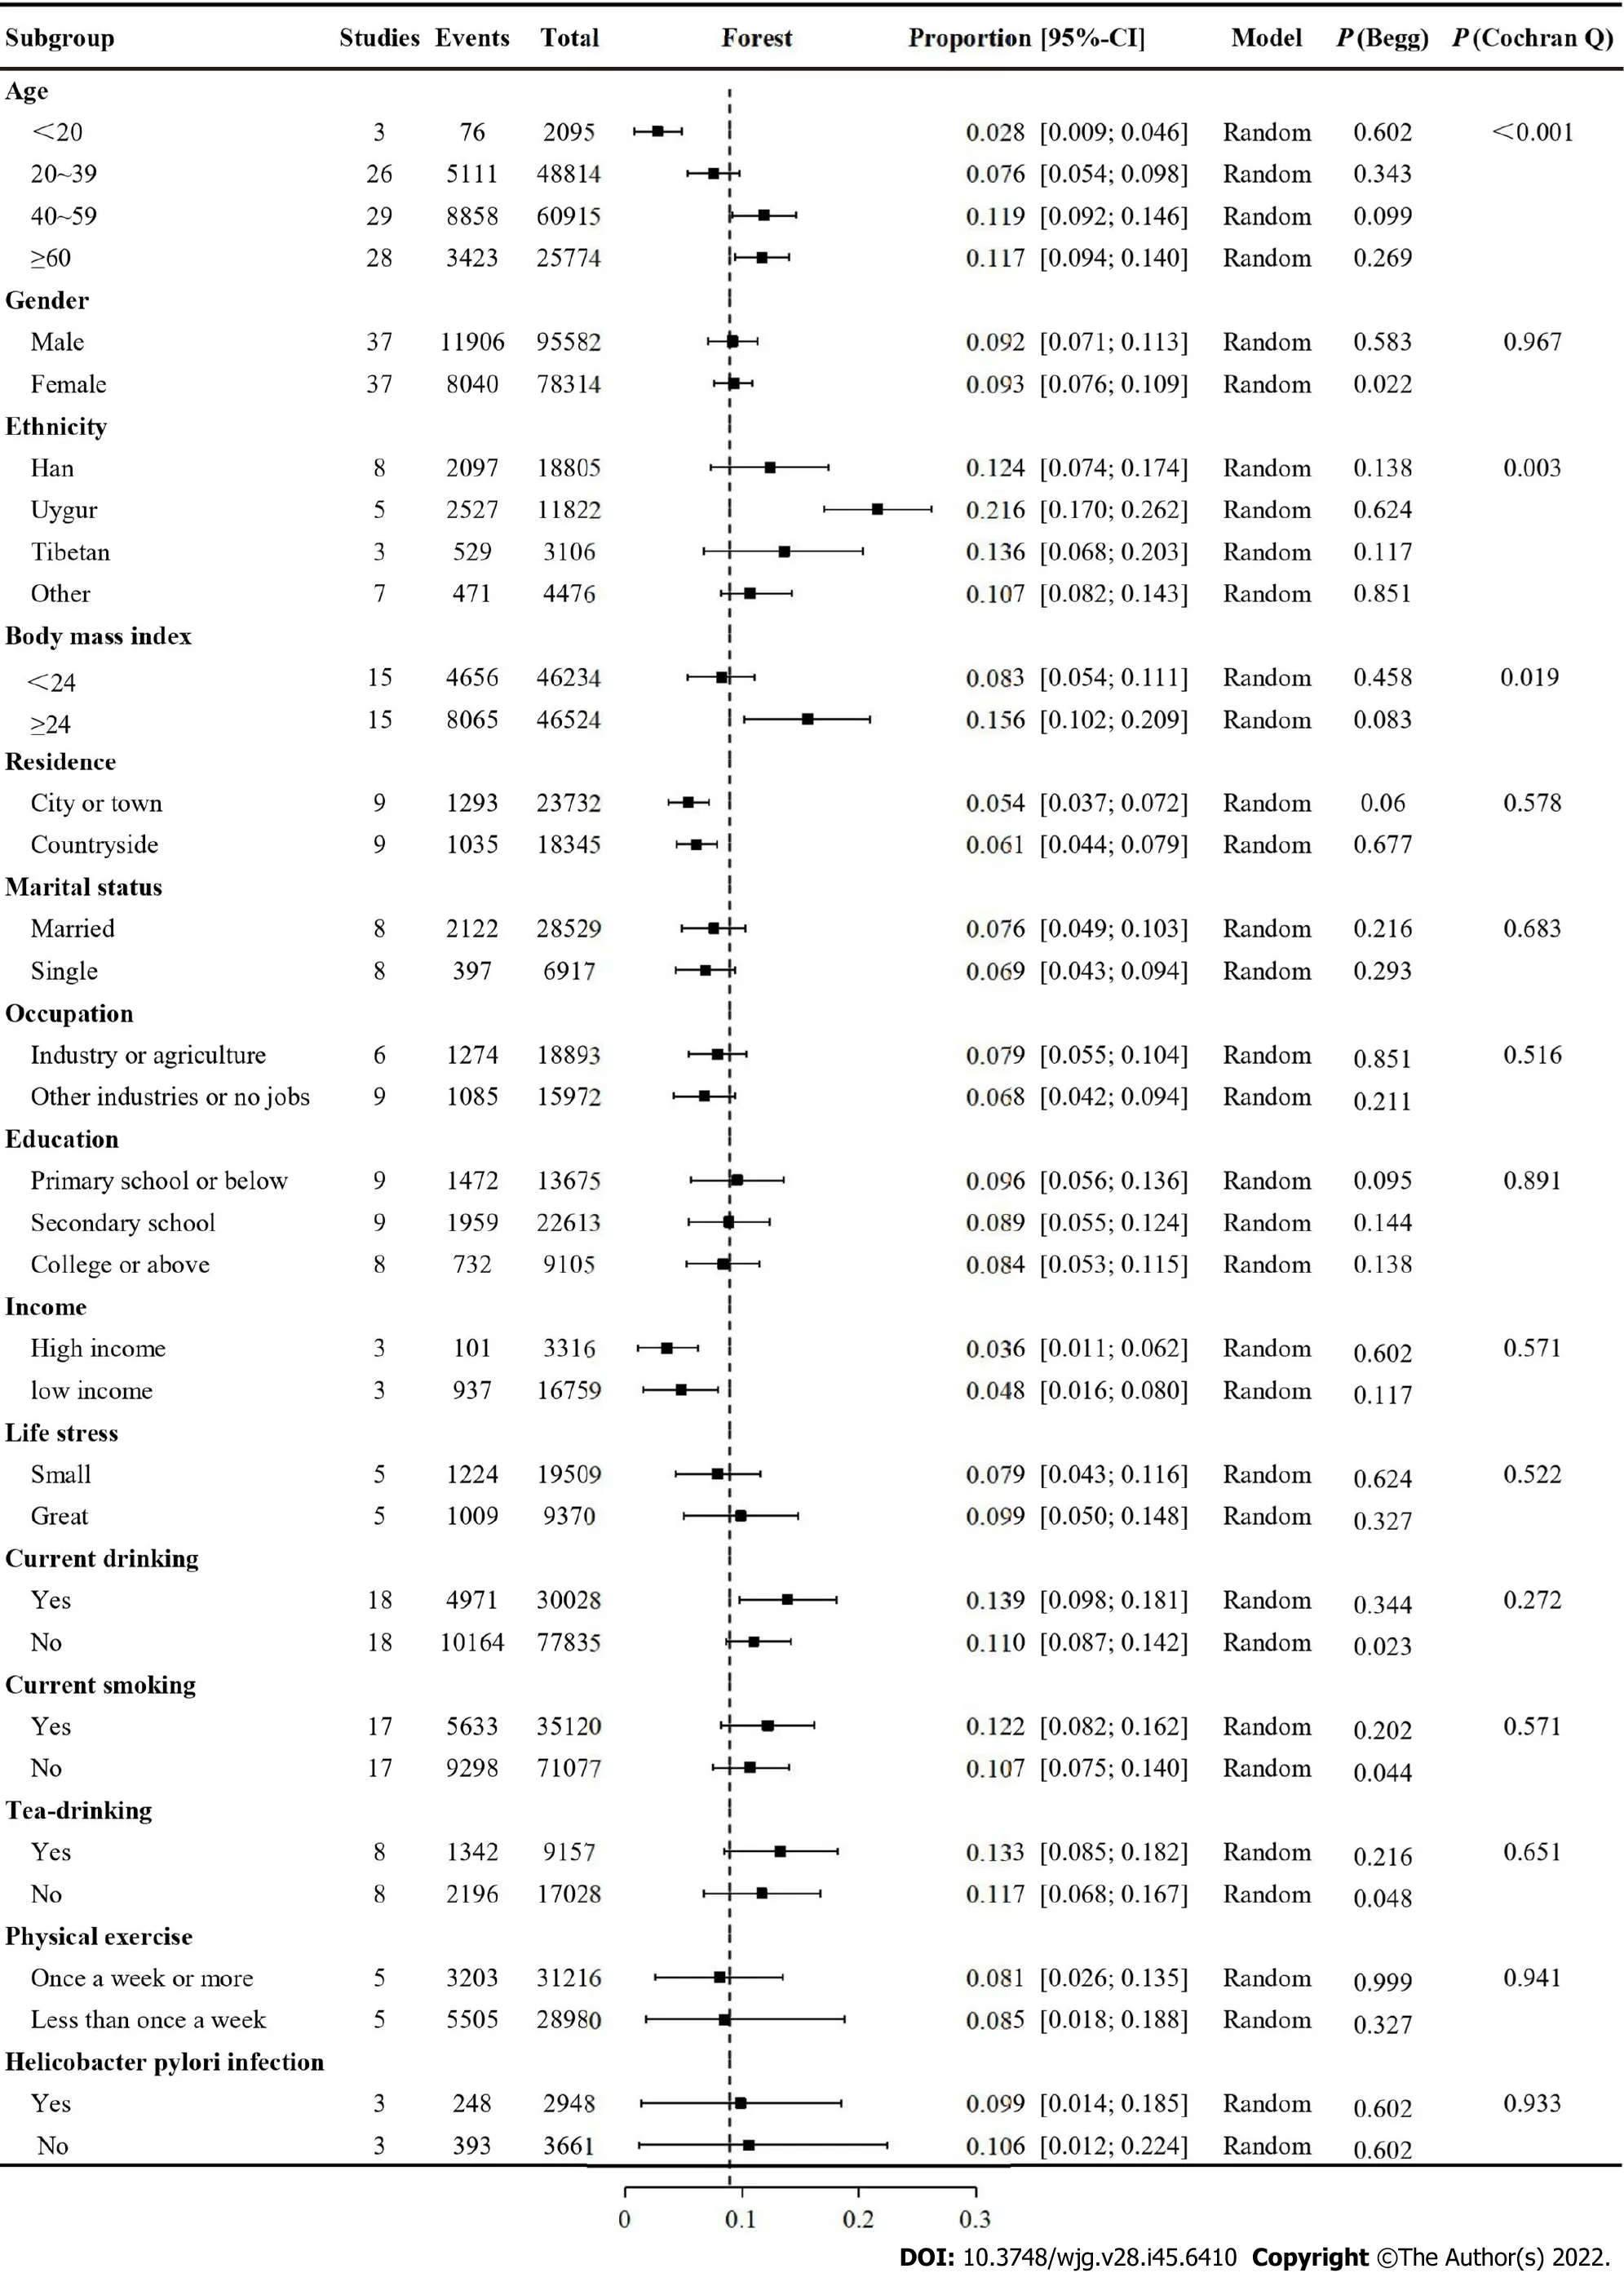
Figure 4 Forest plot for subgroup analysis by demographic data.
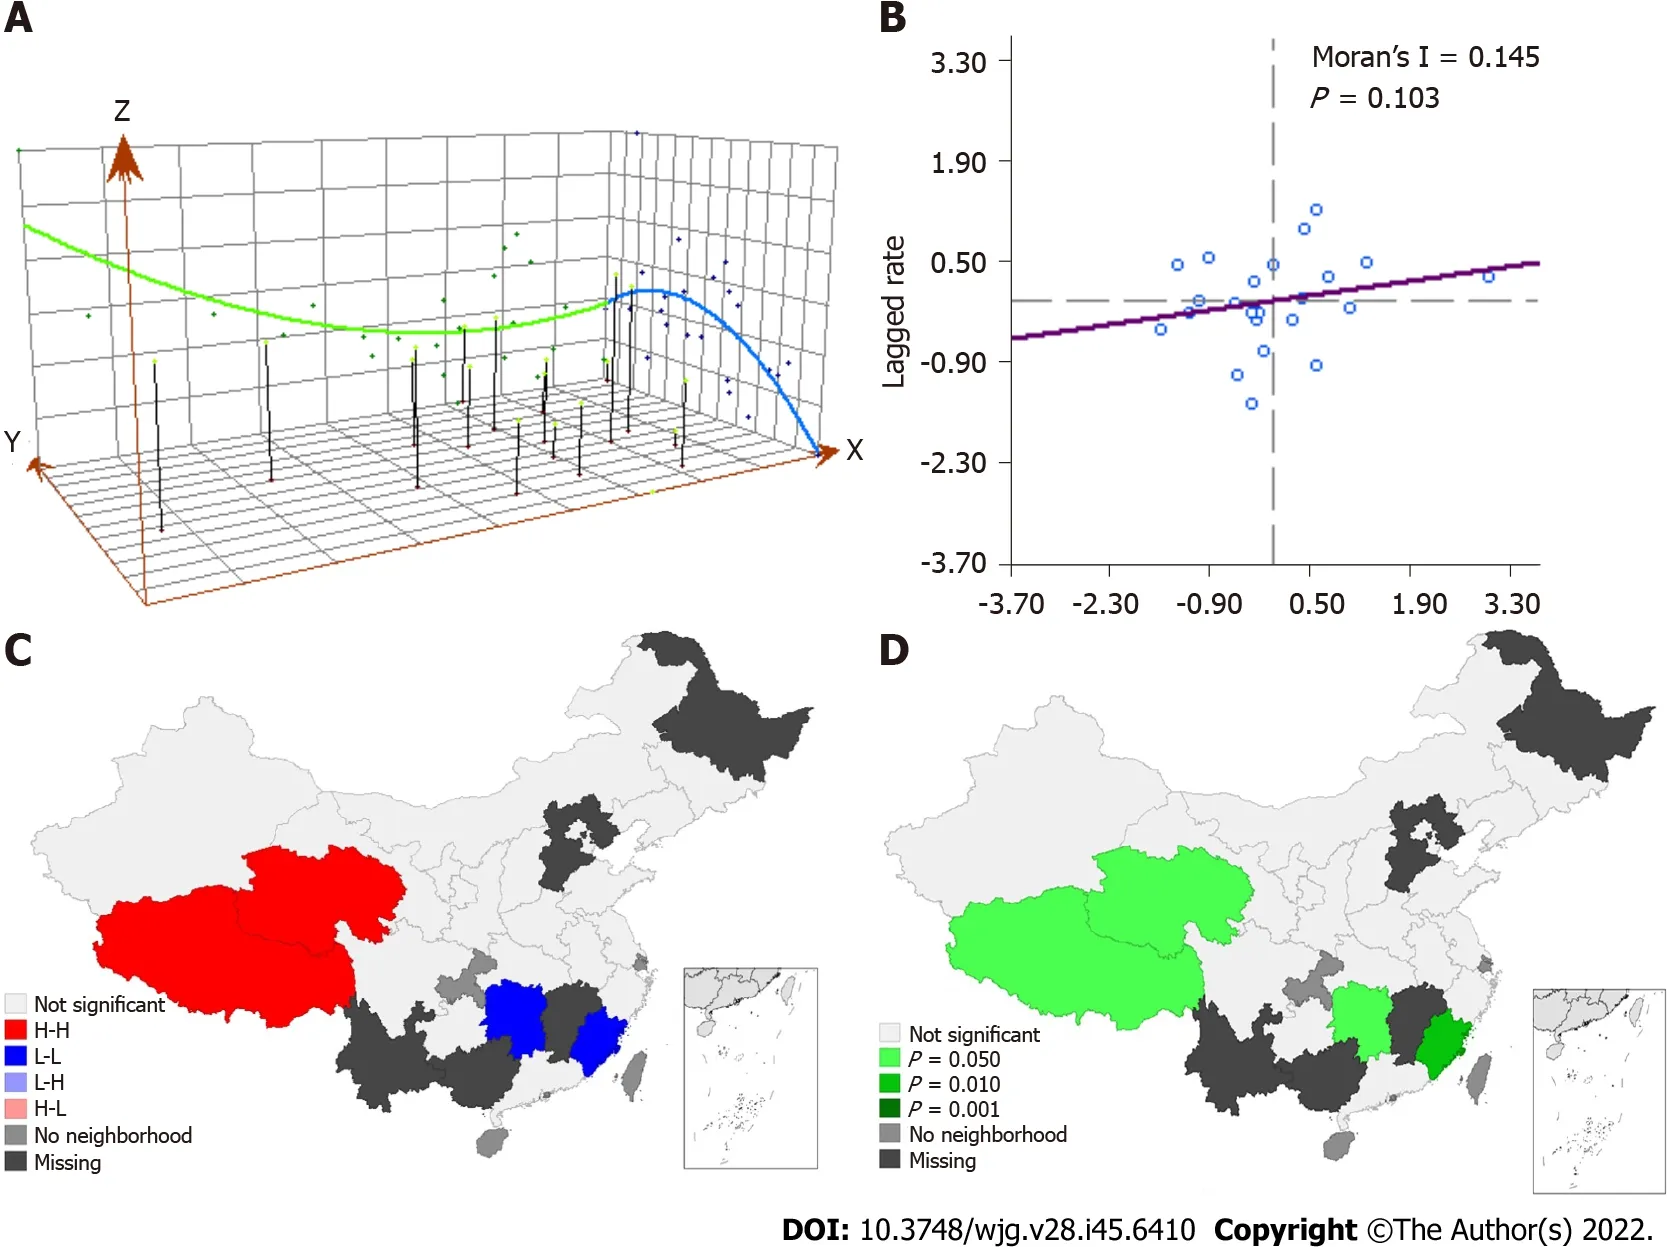
Figure 5 Spatial trend distribution of gastroesophageal reflux disease. A: Trend Analysis; B: Moran-scatterplot; C: Lisa concentration map; D: Lisa significance map.
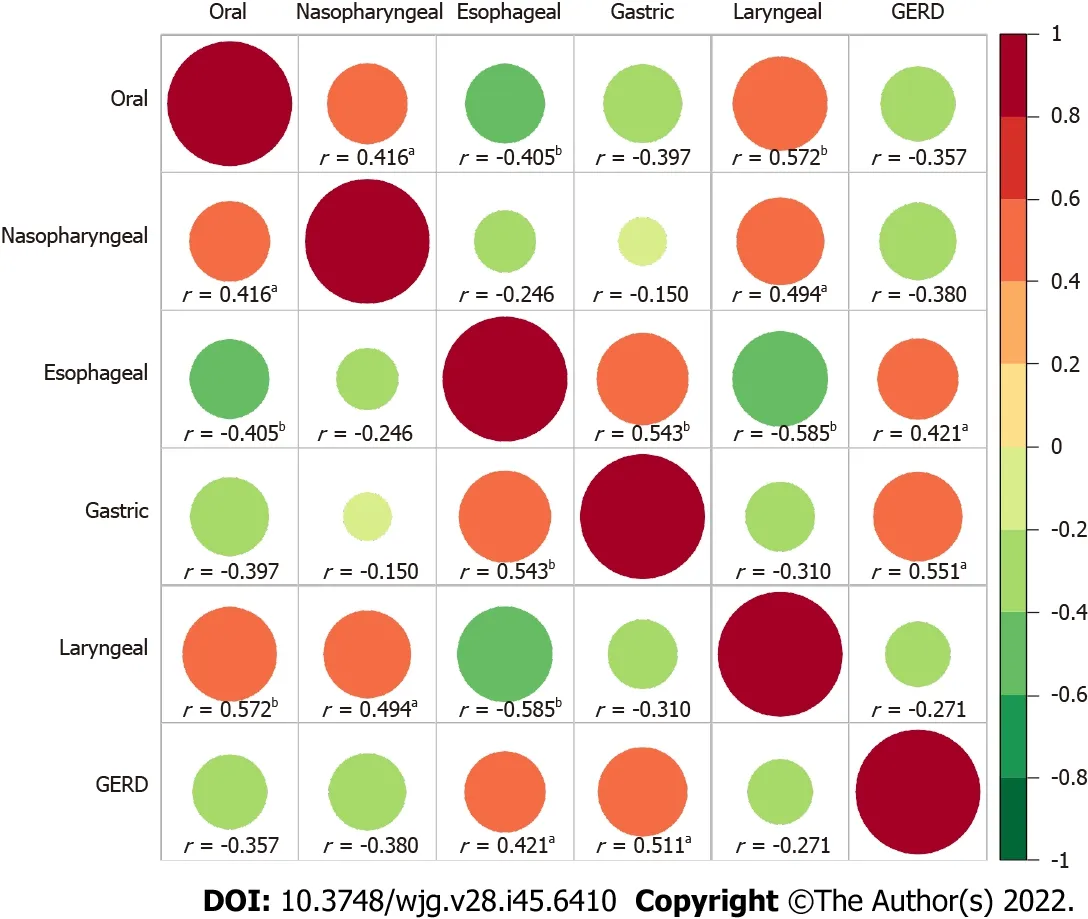
Figure 6 Correlation heat map of the relationship between gastroesophageal reflux disease and upper gastrointestinal tumors. aP < 0.05,bP < 0.01.
A trend analysis showed that the prevalence of GERD in China was high in the eastern and western regions and low in the central areas. After controlling for the survey tools and period, the prevalence rates in different regions were still disparate. It has been reported that the prevalence of GERD in Central Asia is high[4]. Interestingly, this study found that the highest prevalence rate in China was in Xinjiang, which is adjacent to Central Asia, and has an environment and diet that are similar to Central Asia. Dietary structure is an influencing factor of GERD[24,25]. For example, vegetarian diets were negatively related to GERD, while meat and fat consumption were positively related to GERD. Different dietary patterns, diet styles, and eating habits in other regions may be the reasons for regional differences in prevalence.
We divided the papers into 15 subgroups to investigate the prevalence of GERD in different populations, and significant differences among other ethnic groups, ages, and BMIs were found. The majority of GERD was the highest in populations over 40 years old, followed by those 20-39 years old;the lowest prevalence was in those under 20 years old, which is consistent with another meta-analysis[6]observing Asian populations. Leonardo found through meta-analysis that, compared with those aged <50 years, the OR for GERD in those aged ≥ 50 years was 1.32 (95%CI: 1.12-1.54)[5]. A new global metaanalysis revealed that the prevalence rate was the highest in those aged 35-60 years old and decreased slightly in those over 60 years old[4]. The current consensus is that the prevalence of GERD is different among different ethnic groups[26]. Our study suggested that the prevalence of GERD in the Uygur population is significantly higher than that in other ethnic groups. This was also consistent with our regional distribution, as the Uygur people mainly live in Xinjiang Province, which is in western China.The prevalence, frequency and severity of GERD were reported to increase with BMI, which was consistent with our findings[26]. The results of a large-scale prospective study also suggested that a decrease in BMI can improve GERD-related symptoms, while an increase in BMI may aggravate GERD symptoms[27]. In addition, some researchers proposed that the decline inHelicobacter pyloriinfection will lead to a healthier stomach and decreased gastric acid secretion, leading to a reduction in reflux disease[28]. Our research did not support this statement. The other 11 factors evaluated had no effects on the prevalence of GERD, and their impact on GERD remains controversial.
We found that GERD did not have global spatial autocorrelation but had local spatial autocorrelation.In addition, the local spatial autocorrelation analysis results demonstrated that the area with the highest incidence of GERD was different from the highest spatial autocorrelation area of GERD. Tibet and Qinghai were high-to-high aggregation areas, and Hunan and Fujian were low-to-low aggregation areas. This unstable result may be related to the fact that we have many missing values. There were 7 provinces without data. More studies may be needed to explore the spatial autocorrelation of GERD in China. Our study found that GERD was positively correlated with oesophageal cancer and gastric cancer in spatial distribution. The association of GERD and oesophageal cancer has been reported[29],and we confirmed this conclusion from the perspective of the spatial distribution of the disease. The correlation between GERD and gastric cancer may be due to the increase in gastric acid secretion in some gastric cancers, which leads to the occurrence of GERD. A meta-analysis suggested that GERD may be a significant risk factor for laryngeal cancer[30]. However, future prospective controlled studies are needed. There was no correlation between GERD and oral cancer and oesophageal cancer, and no similar literature report has been found.
In our study, all respondents were healthy people (not patients or a specific group of people), and the study covered most provinces in China, both of which suggest that the research sample was satisfactory and representative. We conducted a number of subgroup analyses to explore the prevalence of different populations. In addition, we evaluated the temporal and spatial distributions of GERD in mainland China for the first time and analysed the spatial correlation between GERD and upper respiratory tract tumours. However, this meta-analysis has several limitations. First, there was considerable heterogeneity in the calculation of crude prevalence and subgroup analysis. Second, although we included many studies, the literature of some regions and subgroups was still insufficient. Finally, the lack of data in seven provinces may affect our spatial correlation analysis results.
CONCLUSION
In conclusion, this systematic review demonstrated that the summary estimate of the prevalence of GERD in Chinese people was 8.7%, indicating a trend of higher prevalence in the west and east than in the centre and an increasing prevalence over time. The prevalence rate of GERD was higher in people who were over 40 years old, obese and of the Uygur population. The prevalence of GERD was positively correlated with that of oesophageal cancer in terms of spatial distribution. Considering the vast and diverse population of China, further studies are needed to identify effective strategies to reduce the incidence of GERD in China.
ARTICLE HIGHLIGHTS

systematic review on GERD prevalence in China. China has the world's largest population, dozens of ethnic groups, vast land area and a complex geographical environment. Those factors have caused great challenges for the prevention and control of GERD in China.
Research motivation
It is important to understand the prevalence and spatial distribution of GERD in China because it will provide a reference for disease prevention and control.
Research objectives
The purpose of this meta-analysis was to understand the spatial, temporal and population distributions of GERD prevalence in China and to explore the correlation between the disease and upper gastrointestinal tumours in the spatial distribution.
Research methods
This article pooled the prevalence of GERD overall and in subgroups by using a random effect model. A statistical map of the spatial distribution of GERD prevalence was drawn. Spatial trends and spatial autocorrelations were analyzed. The interrelation between GERD and the prevalence of upper gastrointestinal tumours in different regions was also discussed.
Research results
The overall prevalence of GERD in mainland China was 8.7% (95%CI: 7.5%-9.9%). In the past 20 years,the prevalence of GERD in China has increased from 6.0% to 10.6%. GERD was more common in people aged 40-60, with BMI ≥ 24, and of Uygur ethnicity. The prevalence rate in the western region is the highest, followed by the eastern region, and the central region is the lowest. There may be a local spatial autocorrelation between the Qinghai-Tibet Plateau and the southeast. GERD was correlated with gastric tumours (r= 0.421,P= 0.041) and oesophageal tumours (r= 0.511,P= 0.011) in spatial distribution.
Research conclusions
The prevalence of GERD is on the rise in China. Prevalence varies in different regions and populations.
Research perspectives
In China, GERD should receive more attention. More efforts should be made to prevent and control GERD in key areas and populations.
ACKNOWLEDGEMENTS
The author thanks Mr. Ri-Hui Liu for his great support and help in the statistical analysis and writing of this paper.
FOOTNOTES
Author contributions:Lu TL and Chen CW contributed to the study design and drafting of the manuscript; Lu TL,Zhang JM, Li SR and Chen CW contributed to the data collection; Lu TL and Li SR contributed to the analysis and interpretation of data; Zhang JM and Li SR contributed to the critical revision of the manuscript; All the authors did approval of the final version for publication.
Conflict-of-interest statement:The authors declare no conflict of interest.
PRISMA 2009 Checklist statement:The authors have read the PRISMA 2009 Checklist, and the manuscript was prepared and revised according to the PRISMA 2009 Checklist.
Open-Access:This article is an open-access article that was selected by an in-house editor and fully peer-reviewed by external reviewers. It is distributed in accordance with the Creative Commons Attribution NonCommercial (CC BYNC 4.0) license, which permits others to distribute, remix, adapt, build upon this work non-commercially, and license their derivative works on different terms, provided the original work is properly cited and the use is noncommercial. See: https://creativecommons.org/Licenses/by-nc/4.0/
Country/Territory of origin:China
ORCID number:Chao-Wu Chen 0000-0003-0653-4102.
S-Editor:Zhang H
L-Editor:A
P-Editor:Zhang H
杂志排行
World Journal of Gastroenterology的其它文章
- COVID-19 drug-induced liver injury: A recent update of the literature
- Gastrointestinal microbiota: A predictor of COVID-19 severity?
- The mononuclear phagocyte system in hepatocellular carcinoma
- Deep learning based radiomics for gastrointestinal cancer diagnosis and treatment: A minireview
- Best therapy for the easiest to treat hepatitis C virus genotype 1b-infected patients
- Endoscopic mucosal resection-precutting vs conventional endoscopic mucosal resection for sessile colorectal polyps sized 10-20 mm
