Visualizing the dynamic progression of backward erosion piping in a Hele-Shaw cell
2022-11-30GangZHENGJingboTONGTianqiZHANGZiwuWANGXunLIJiqingZHANGChunyuQIHaizuoZHOUYuDIAO
Gang ZHENG ,Jing-bo TONG ,Tian-qi ZHANG✉ ,Zi-wu WANG ,Xun LI ,Ji-qing ZHANG ,Chun-yu QI,Hai-zuo ZHOU,Yu DIAO
1MOE Key Laboratory of Coast Civil Structure Safety,Tianjin University,Tianjin 300072,China
2School of Science,Tianjin University,Tianjin 300072,China
3China Railway Design Corporation,Tianjin 300308,China
4National Engineering Laboratory for Digital Construction and Evaluation Technology of Urban Rail Transit,Tianjin 300308,China
Abstract: With the utilization of underground space,backward erosion piping (BEP) has been observed in many underground structures(e.g.,shield tunnels)founded on sandy aquifers.However,due to invisibility,the geometry of the eroded pipe and its spatial evolution with time during the piping process was still not clear.In this study,we developed a Hele-Shaw cell to visualize the dynamic progression of BEP.With imaging process technology,we obtained a typical process of BEP(the erosion process can be divided into a piping progression phase and a piping stabilization phase),quantitatively characterized the formation of erosion pipes,and compared the patterns of erosion(e.g.,the erosion area A and the maximum erosion radius Rmax)that spontaneously develop under different fluxes of water.The most interesting finding is that the sand grains in a thicker Hele-Shaw model are easier to dislodge,which is possibly due to the granular system in a thicker model having more degrees of freedom,reducing the stability of the sand grains.
Key words: Backward erosion piping(BEP);Dynamic progression;Hele-Shaw cell;Visualize;Imaging processing technology
1 Introduction
For shield tunnels built in a confined aquifer of silt or silty (fine) sand,once leakage occurs,the soil particles may fluidify,suspend,and then be carried into the tunnels by underground water,leading to the rapid erosion of the soil,changing the load distribu‐tion around the tunnels,and resulting in the deforma‐tion of the segmental linings.In particular,when the leakage point arises at the bottom of the tunnel,ero‐sion cavities can be generated below the tunnel invert,giving rise to both opening and dislocation at the seg‐ment joints.Thereafter,more leakage points arise and aggravate the erosion (Fig.1).Without prompt con‐trol,progressive failure and damage or even largescale tunnel collapse may take place.As shown in Fig.1,the erosion initiates at the outlet and develops backwards toward the fluid source.This is analogous to the backward erosion piping(BEP)observed in em‐bankments and levees founded on sandy aquifers(Fig.2).Therefore,for ease of interpretation,the erosion caused by leakage in the shield tunnels men‐tioned above is also termed BEP.In other words,the term BEP,in this study,refers to a generalized con‐cept and is not limited to a problem of embankments or levees.
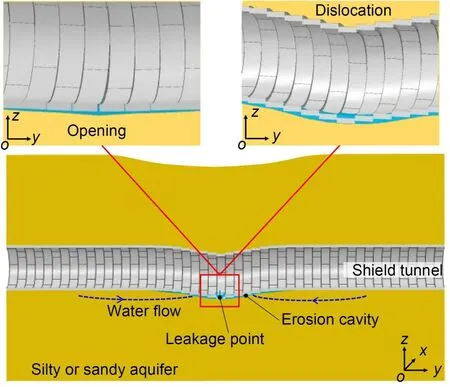
Fig.1 Erosion caused by leakage in a shield tunnel
The typical process of BEP in embankments is shown in Fig.2.The erosion generally originates downstream and develops in a direction opposite to the water flow underneath the water-retaining struc‐tures.The critical state that occurs when the erosion pipe reaches the upstream is usually a primary focus because,once the erosion pipe forms a connection be‐tween upstream and downstream,the erosion can ac‐celerate,resulting in failure or collapse of the waterretaining structure.Previous experimental studies have yielded fundamental knowledge on key aspects of BEP either by measuring the critical average hydraulic gradient (Yao et al.,2007;van Beek et al.,2011) or by analysing pipe formation (Richards and Reddy,2012;Vandenboer et al.,2019a,2019b;Akrami et al.,2021;Rosenbrand et al.,2022).These studies have greatly broadened our insight into the mechanisms by which BEP can be triggered and sustained beneath an embankment.
Apparently different from the BEP observed in embankments or levees,the erosion due to leakage in shield tunnels (Neyer,1984;Zheng et al.,2017) de‐velops in an approximately infinite space (in other words,the distance between the upstream and down‐stream is infinitely long).Therefore,no hydraulic connection between the upstream and downstream can be observed (Fig.2),and a critical state for the progression of BEP may not exist.Under these cir‐cumstances,the concept of a“critical hydraulic gradi‐ent” is meaningless.The geometry (shape and area)of erosion pipes,especially their spatial evolution with time,has become a major concern because these features are closely related to the response of the tunnel structures.For instance,if the erosion pipe is shallow,the deformation of the segmental lining may be characterised by opening,or dislocation might occur due to severe uneven settlement,as shown in Fig.1.However,due to its invisibility,the geometry of the erosion pipe underneath the tunnel is still not clear.
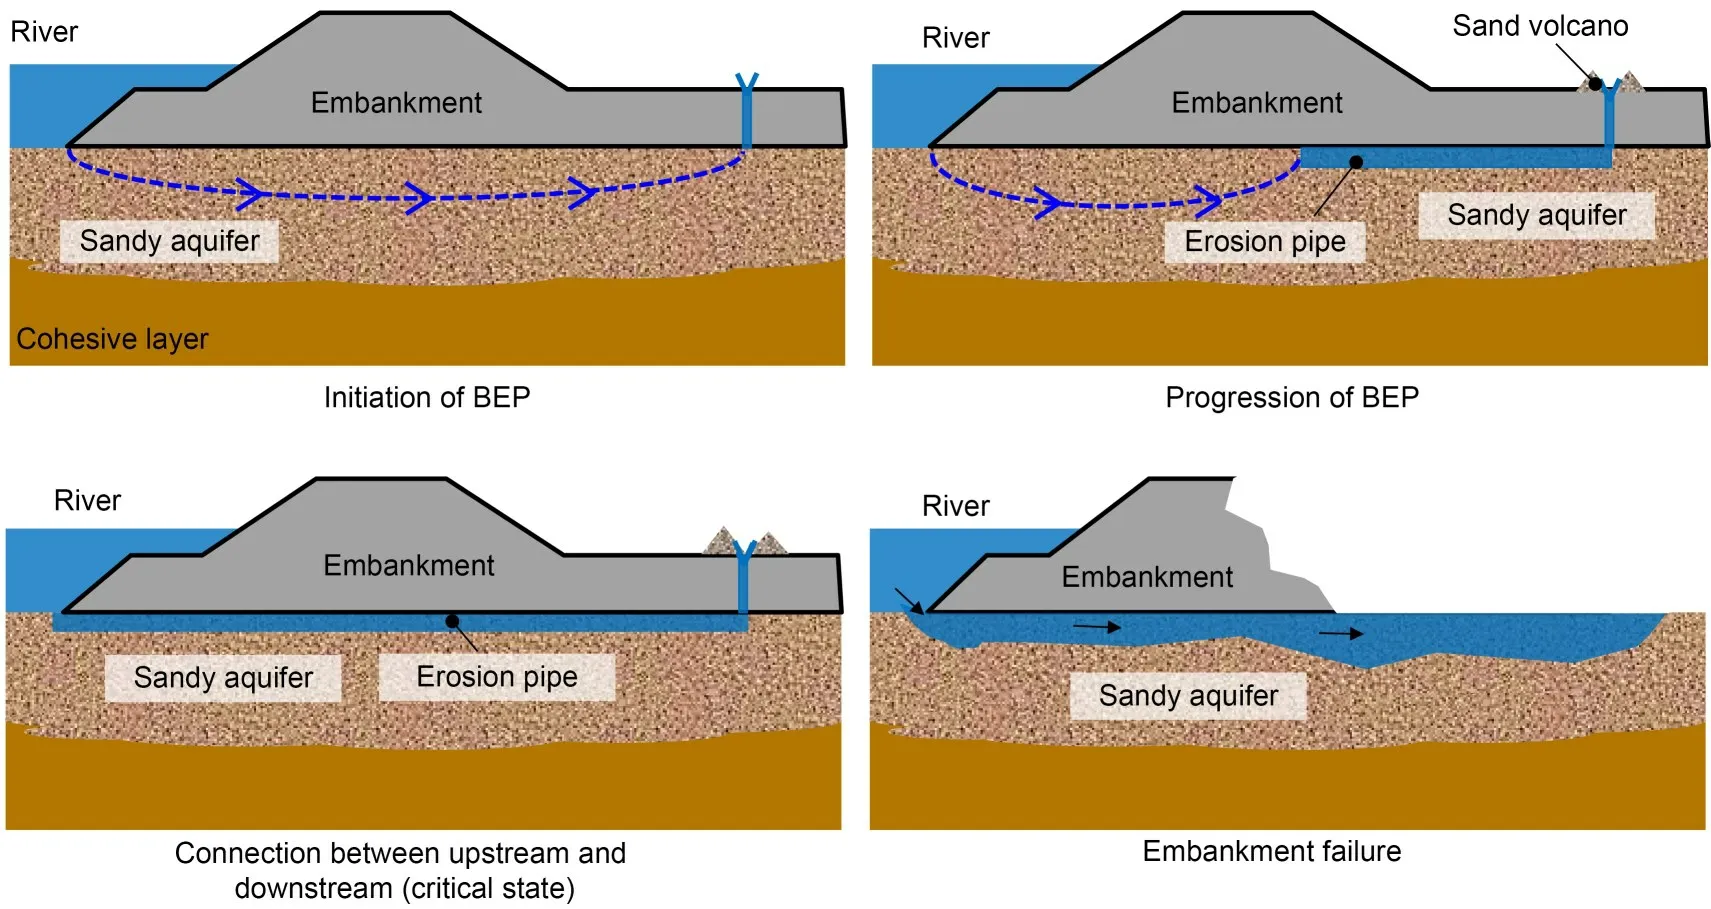
Fig.2 Process of BEP in a river embankment
Many attempts have been made to capture the geometry (length,depth,and width) of the eroded pipe beneath an embankment (van Beek et al.,2015;Vandenboer et al.,2018,2019b;Pol et al.,2021;Rice et al.,2021).In most of these studies,comprehensive and precise measurement of the pipe geometry was usually conducted at the end of the tests.It still seems a challenge to precisely capture the dynamic erosion morphology during pipe progression.Among the main factors that lead to difficulties in this measurement,the technical barrier in imaging and digital processing stands out.In conventional BEP experiments,the ac‐quisition of the erosion morphology is usually based on a top view of the sample.However,because the sample is thick while the pipe is shallow,the differ‐ence between an eroded and intact area is not obvious when viewed from the top.This makes the determina‐tion of the pipe contour difficult.
Because the depth of the shallow pipe is only several times the grain diameter (van Beek et al.,2015;Vandenboer,2019),the use of a thin sample be‐tween two transparent plates for observation is feasi‐ble;this idea coincides with the core concept of the Hele-Shaw cell,a classic device used in physics to study laminar flows (Hele-Shaw,1898) and complex fluid-fluid (Al-Housseiny et al.,2012) or fluid-grain interactions (Cheng et al.,2008;Sandnes et al.,2011;Huang et al.,2012)between two parallel plates with a narrow gap.Inspired by the above concept,in this study a Hele-Shaw cell was designed and manufac‐tured for visualizing the progression of BEP.To mimic the erosion resulting from the leakage in a shield tunnel as much as possible,a radial configuration was adopted.The outlet was set at the centre of a circu‐lar Hele-Shaw cell,whereby the speed of the water would quickly decay with increasing radius.In combi‐nation with imaging processing technology,the geom‐etry of the eroded pipe and its spatial evolution during the piping process were quantitatively characterized.The findings provided intuitive insight into the dynamic progression of BEP.
2 Experiments
2.1 Experimental apparatus
The experimental setup had three key compo‐nents:a radial Hele-Shaw cell,a standard volume con‐troller(SVC),and a high-speed camera(Phantom V7.1,AMETEK,USA;resolution: 2048×2048;frequency:60 Hz),as shown in Fig.3.The granular sample was accommodated in the Hele-Shaw cell.The fluid (pure water in this study)was supplied via the SVC.
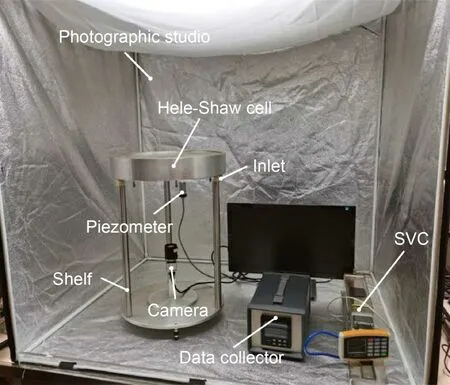
Fig.3 Experimental apparatus
The whole BEP process was recorded by the high-speed camera.To eliminate the influence of am‐bient light on the test results,the experimental appara‐tus was placed in a photographic studio.
A more detailed view of the Hele-Shaw cell is shown in Fig.4.The Hele-Shaw cell mainly consisted of two circular polymethylmethacrylate (PMMA)plates.The upper plate was 410 mm in diameter and 30 mm thick.The lower plate was 380 mm in diame‐ter and 29 mm thick.The gap between the two plates,b,was precisely controlled using standard spacers around the perimeter (in this study,bwas 0.5 mm in most experiments,but was changed to 0.25,0.70,1.00,or 1.50 mm in some tests to ascertain the effect of sample thickness).The outlet was a 6 mm-diameter hole,which was set at the centre of the upper plate.The two plates were inserted into a stainless-steel ped‐estal.The contact parts between the pedestal and the two plates were sealed using rubber O-rings.The inlet was set at the bottom of the pedestal,and the cavity that formed between the lower plates and the pedestal served as a reservoir,ensuring that the water was uni‐formly driven through the sample from around the pe‐rimeter.An annular aluminium strip embedded in the lower plate served as a ledge to separate the samples and the reservoir.
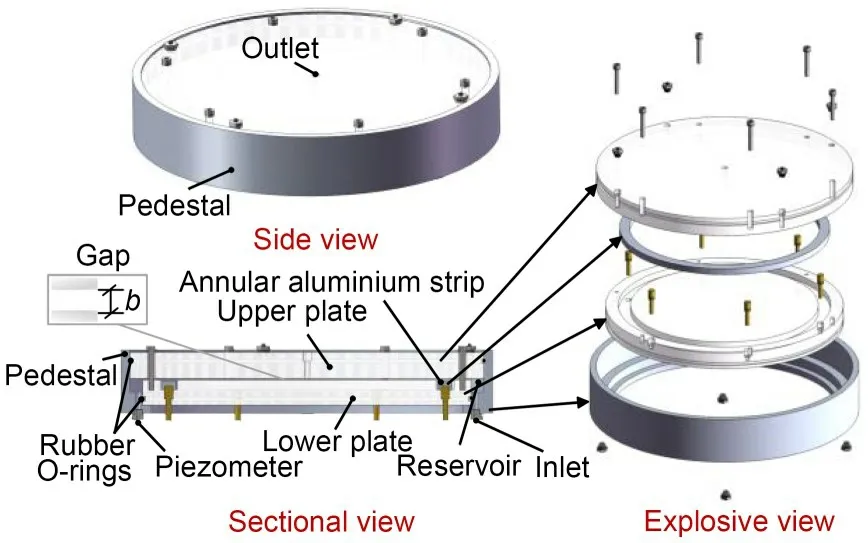
Fig.4 Detailed view of the Hele-Shaw cell
2.2 Materials
The fluid used in this study was pure water with a density of 1000 kg/m3and a viscosity of 0.8737×10⁻³Pa·s.The granular material adopted in this study was Toyoura sand with a specific gravity of 2.65.The grading curve of Toyoura sand can be seen in Fig.5a.Because a good uniformity is essential to trigger BEP(van Beek et al.,2014),the Toyoura sand was sieved,and sand grains in a narrow range of size from 0.15 mm to 0.20 mm were selected for the samples(the scanning electron microscopy (SEM) image in Fig.5b).
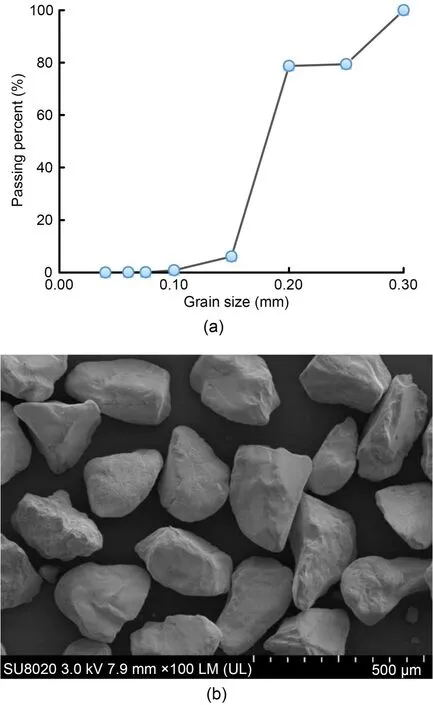
Fig.5 Grain size distribution of the Toyoura sand: (a)grading curve;(b)SEM image
2.3 Test programme
Before the test began,the sample was first transferred into the Hele-Shaw.More details on the preparation of the sample can be seen in the electronic supplementary materials(ESM).
In this study,nine tests(excluding repeated tests)in total were conducted.They can be divided into two groups.In the first group,the gapbwas maintained at 0.5 mm,and the instant fluxJwas set to 140,210,280,350,and 420 mm3/s.In the second group,the ratio of the flux of water to the gapJ/bwas kept the same(280 mm2/s),whereas the gapbwas set to 0.25,0.50,0.70,1.00,and 1.50 mm.
3 Test results
3.1 A typical process of BEP
Once the test began,pure water was injected into the Hele-Shaw cell via the SVC.To mimic the ero‐sion of a porous medium under a sudden flow of water as observed in many shield tunnels,a flux of waterJwas instantly imposed at the start and kept constant throughout the test.
Fig.6 shows the process of BEP observed in an experiment,in which the flux of waterJwas 420 mm3/s and the gapbwas 0.5 mm.In general,the process of erosion can be divided into two phases: piping pro‐gression and piping stabilization.During the piping progression phase (I in Fig.6),the hydraulic pressurePover the sample(the hydraulic pressurePwas mea‐sured using the piezometer as shown in Fig.3) was shown to increase at first and then to decrease to a smaller value (Psta) after reaching a peak (Pmax).The spatial evolution of the erosion pipe was basically completed in phase I.Then,the BEP entered the piping stabilization phase (II in Fig.6).In phase II,the hydraulic pressure was maintained atPsta.Although the erosion area ceased to expand,transport of sand grains within the formed erosion pipe was still observed.
From Fig.6,phase I lasted for 16 s in total(from 164 to 180 s).Fig.7 shows the morphology of the ero‐sion after each second.It is clear that under a sudden flow of water,the erosion pipe simultaneously pro‐gressed in multiple directions and exhibited bifurca‐tions as it grew in length(radius)at the start.With the progression of BEP,the incipiently formed pipes drew fluid and eroded faster at the expense of the neigh‐bouring regions.This led to competition among the erosion pipes whereby only one or two pipes eventually dominated (the development of pipe B1 and B2 after 171 s).
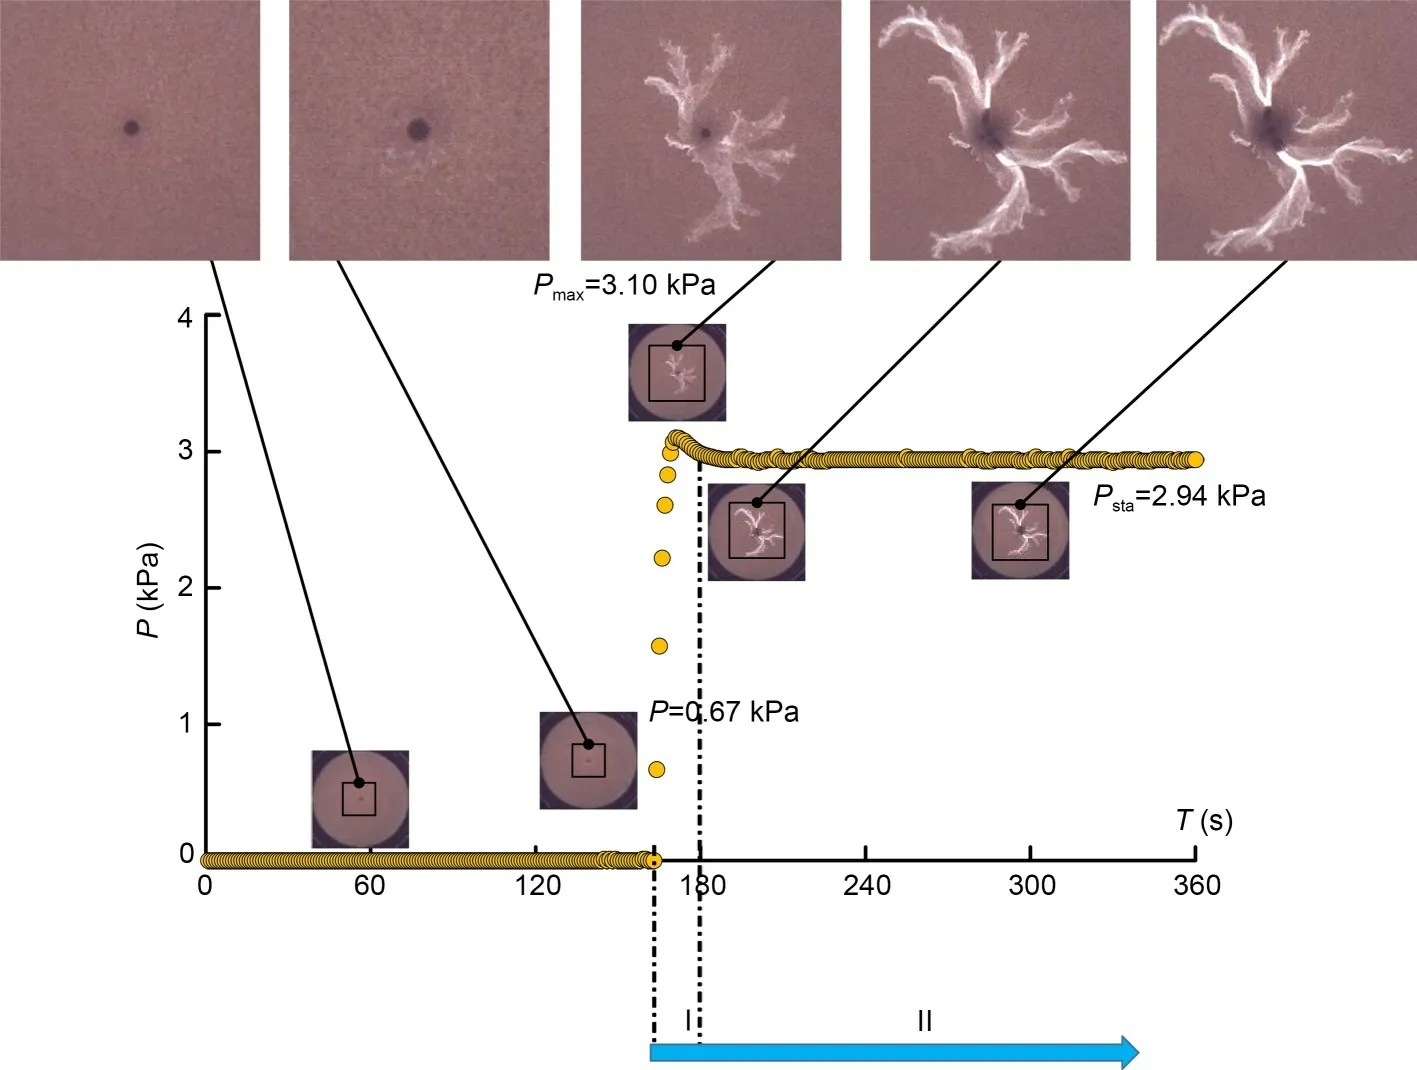
Fig.6 Evolution of the erosion morphology corresponding to variations in the hydraulic pressure drop P measured over the sample during the progression of BEP
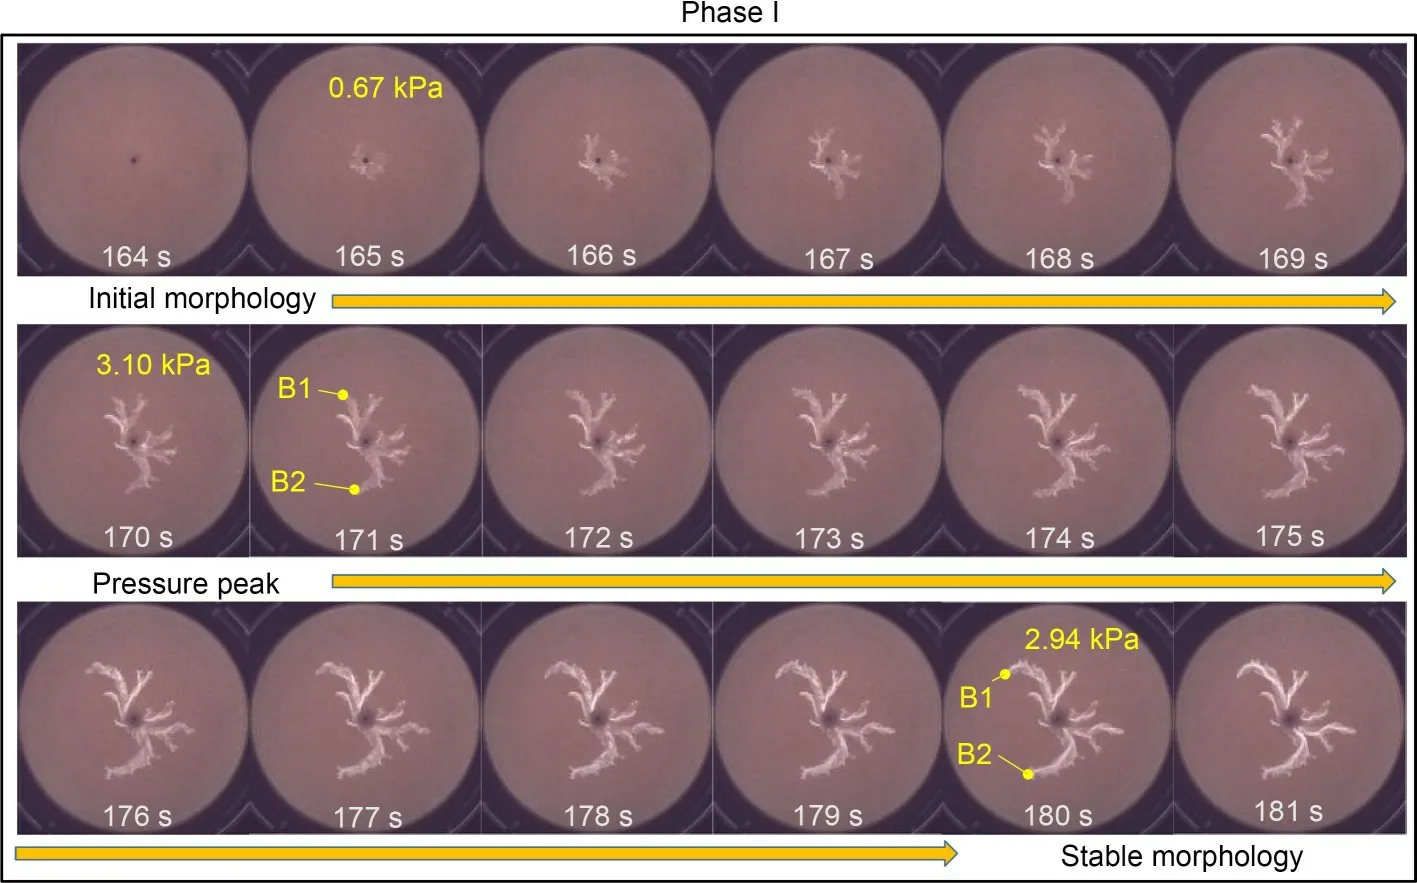
Fig.7 Morphology of the erosion at each second in phase I
Fig.8 shows the variations in both the erosion areaAand the maximum erosion radiusRmax(the max‐imum distance from the centre of the Hele-Shaw cell to the boundary of the erosion area)with time in phases I and II(the erosion areaAand the maximum erosion radiusRmaxwere obtained based on imaging process‐ing technology;more details can be found in the ESM).As can be seen,the erosion areaAlinearly increases with timeT,while the variations in the maxi‐mum erosion radiusRmaxwith timeTfit well to a para‐bolic curve.
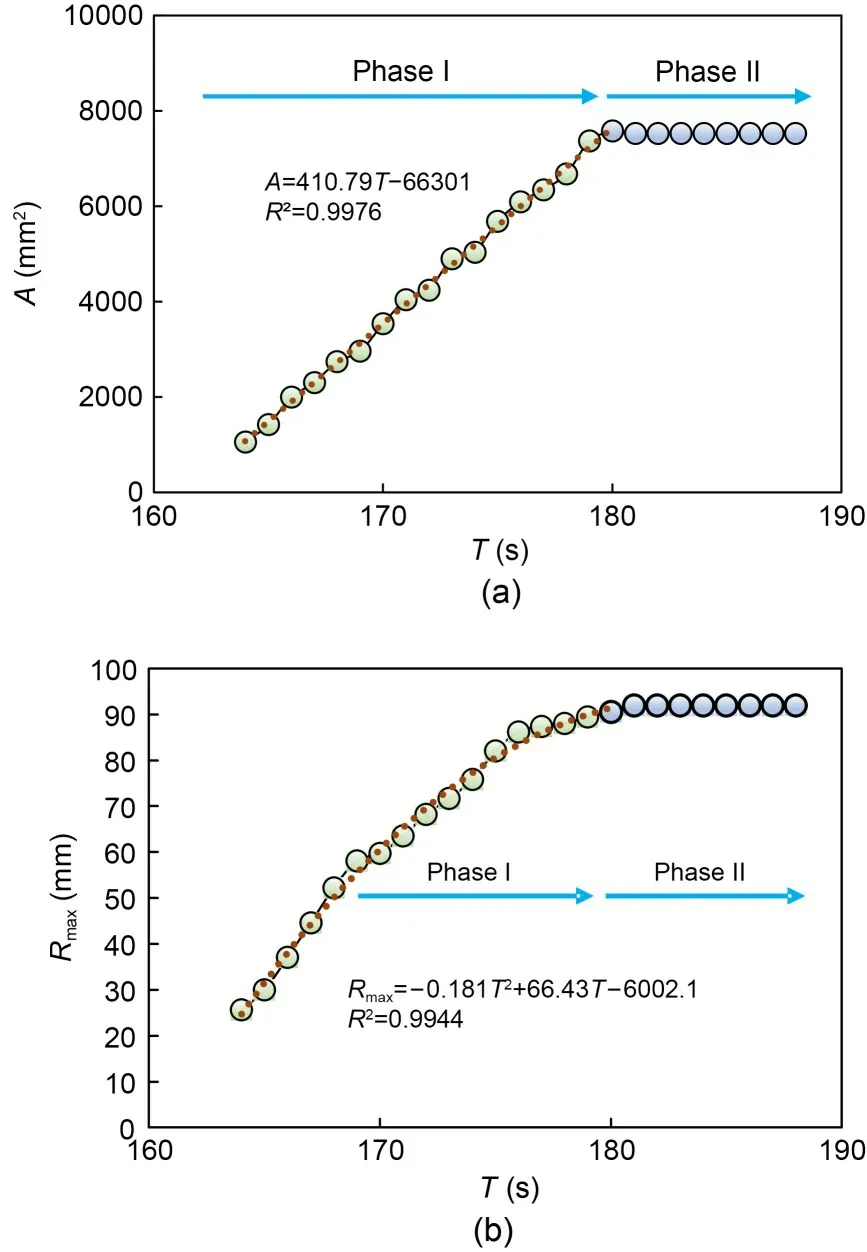
Fig.8 Variations in the erosion area A(a)and the maximum erosion radius Rmax(b)with time
3.2 Progression of BEP under different fluxes of water
In section 3.1,a typical BEP process due to a sudden flow of water is presented.To gain further in‐sight into the morphology of erosion under different fluxes of water,four additional tests were performed,in which the fluxes of water were set to 140,210,280,and 350 mm3/s.A comparison of the stable erosion morphology under different fluxes of water can be seen in Fig.9.In an intuitive sense,a greater flux of water may produce more branched patterns.For instance,whenJ=140 and 210 mm3/s,three main branches were observed,while forJ=350 and 420 mm3/s,four and five main branches were observed,respectively.This occurs because when the initial flux of water is set higher and well above the threshold required to trigger a BEP,more than one site of sand grains can be activated to move,and the erosion pipe may simul‐taneously progress in multiple directions,so the mor‐phology of the erosion exhibits bifurcations and a more branched pattern.

Fig.9 Comparison of the stable erosion morphology under different fluxes of water
Figs.10a and 10b further compare the erosion areaAand the maximum erosion radiusRmaxunder dif‐ferent fluxes of water.As expected,both the erosion areaAand the maximum erosion radiusRmaxwere larger when a higher flux of waterJwas employed.However,the increases inAandRmaxwithJwere not linear.It is apparent that whenJwas greater than 350 mm3/s,the increase almost stopped.In contrast,the peak hydrau‐lic pressurePmaxand the stable hydraulic pressurePstaincreased almost linearly with the flux of waterJ,as shown in Figs.10c and 10d.
4 Effect of sample thickness
In the above-mentioned experiments,the gap be‐tween the upper and lower plates was maintained at 0.5 mm.This meant that 2 or 3 layers of sand grains were arranged along the vertical direction in these experi‐ments.From Figs.6,7,and 9,it is clear that within the formed erosion area,the intensity of light was not uniform.There were some bright and thin channels from which sand grains were thoroughly removed and some dark areas in which one or two layers of sand grains were still left.This indicated that the BEP ob‐served in the Hele-Shaw cell was not simply a planestrain problem,which is the case in experiments to investigate Saffman-Taylor instability (Cheng et al.,2008;Huang et al.,2012) or the capillary fracturing of a fluid-grain system in a Hele-Shaw cell (Sandnes et al.,2011;Holtzman et al.,2012).As a consequence,the thickness of the sample might have an impact on the response of the erosive medium in the Hele-Shaw cell.To address this effect,four additional tests were performed in which gapbwas set to 0.25(monolayer),0.70(3 or 4 layers),1.00(5 or 6 layers),and 1.50 mm(7–10 layers).In particular,to ensure that the sand grains were eroded under similar water drag,the ratio of the flux of water to the gapJ/bwas kept the same(280 mm2/s) in these experiments (thus,the flux of waterJwas set to 70,140,196,280,and 420 mm3/s when the gaps wereb=0.25,0.50,0.70,1.00,and 1.50 mm,respectively).
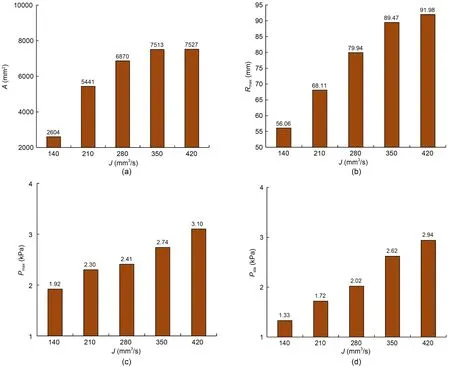
Fig.10 Comparison of A(a),Rmax(b),Pmax(c),and Psta(d)under different fluxes of water
Fig.11 shows a comparison of the stable ero‐sion morphology obtained with different gaps in the Hele-Shaw cell.Apparently,the thickness of the sam‐ple can have a significant influence on the geometry of the erosion pipe.Basically,a thinner sample can show a greater resistance to erosion.For instance,in the case ofb=0.25 mm,BEP was not triggered.In ad‐dition,the erosion pattern looked more uniform when a larger gapbwas used in the Hele-Shaw cell.For in‐stance,in the case ofb=1.00 and 1.50 mm,the shape of the erosion boundary was well rounded,and minimal branching occurred.

Fig.11 Comparison of the stable erosion morphologies obtained with different gaps in the Hele-Shaw cell
Figs.12a and 12b further show a comparison of the erosion areaAand maximum erosion radiusRmaxobtained with different gaps in the Hele-Shaw cell.Both the erosion areaAand maximum erosion radiusRmaxwere greater with a larger gapbin the Hele-Shaw cell.In contrast,both the peak hydraulic pressurePmaxand the stable hydraulic pressurePstameasured over the sample were lower when a larger gapbwas em‐ployed,as shown in Figs.12c and 12d.All these re‐sults suggested that the sand grains in a thicker Hele-Shaw model were easier to dislodge.
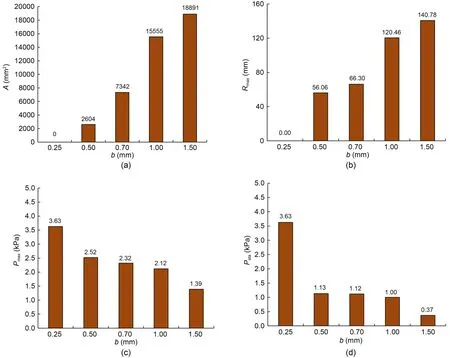
Fig.12 Comparison of A(a),Rmax(b),Pmax(c),and Psta(d)obtained in tests with different gaps
Fig.13 illustrates the influence of the layer num‐ber on the erodibility of sand grains.For clarity,single grains on the erosion boundaries in a 2-layer sample and a 4-layer sample were selected for comparison.Apparently,the sand grain in a 4-layer sample more easily erodes because the granular system has more degrees of freedom than that of a 2-layer sample.In other words,a sand grain in a 4-layer sample ((1) in Fig.13)has more interrelated“neighbours”(the shaded grains in Fig.13)than a grain in a 2-layer sample((2)in Fig.13).Any perturbations or tiny wobbles of these interrelated “neighbours” can lead to the insta‐bility of the sand grain.
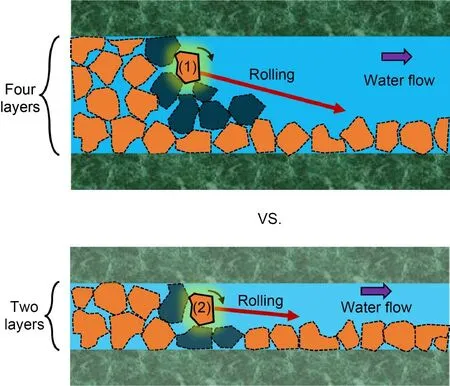
Fig.13 Influence of the layer number on the erodibility of sand grains
In addition,once a sand grain in the 4-layer sam‐ple is dislodged,it more easily maintains its motion due to the work done by gravity along a steeper slope(the arrow in Fig.13).Moreover,the pipes are more easily blocked by protruding particles when the gap becomes narrower.For these reasons,the sand grains in a thicker sample may exhibit higher mobility.
5 Conclusions
This study presented a series of experiments in which the dynamic progression of BEP was visualized by using a classic Hele-Shaw cell.The following con‐clusions may be drawn from the test observations.
1.The process of BEP observed in a uniform,po‐rous medium driven by a sudden flow of water can be divided into a piping progression phase and a piping stabilization phase.The spatial evolution of the ero‐sion pipe was essentially accomplished in the piping progression phase;nonetheless,transport of sand grains within the formed erosion pipes could still be observed in the piping stabilization phase.
2.The morphologies of erosion under different fluxes of water indicated that a higher flux of water may produce more branched patterns when the gap was not too wide (in this study,it is observed in the tests withbof 0.5 mm).As expected,both the erosion area and the maximum erosion radius were larger when a higher flux of water was employed;however,their growth with the flux of water was not linear:they increased very little when the flux was relatively large.In contrast,the hydraulic pressure measured over the sample showed an almost linear increase with the flux of water.
3.The BEP observed in the Hele-Shaw cell was not a plane-strain problem.The thickness of the sam‐ple may have a significant influence on both the initia‐tion and progression of BEP.The test results suggested that the sand grains in a thicker Hele-Shaw model were easier to dislodge.This occurs because the granu‐lar system of a thicker sample has more degrees of freedom,which increases the mobility of the sand grains.
In practical engineering,the underlying strata below a tunnel invert can be infinitely thick,while the thickness of the sample in this study was very limited.As shown in Figs.11 and 12,it is seen that the effect of the sample thickness was still significant even when gapbwas set to 1.5 mm(approximately 9 times the mean grain diameter).There should exist a critical thickness of sample,above which the erosion geome‐try may not be affected.However,further increasing the thickness of the sample in the presented Hele-Shaw cell may dim the contour of the erosion pipe,making it hard to distinguish the eroded and intact areas.Therefore,it is necessary to develop a new apparatus to determine the“critical thickness”of the sample and the mechanism by which erosion progresses along the vertical direction.Naturally,this is our future work.
Acknowledgments
This work is supported by the National Engineering Lab‐oratory for Digital Construction and Evaluation Technology of Urban Rail Transit (No.2021GY01) and the National Natural Science Foundation of China(No.41630641).
Author contributions
Gang ZHENG designed the research.Jing-bo TONG and Tian-qi ZHANG processed the corresponding data.Tian-qi ZHANG wrote the first draft of the manuscript.Zi-wu WANG,Xun LI,Ji-qing ZHANG,Chun-yu QI,and Hai-zuo ZHOU helped to organize the manuscript.Yu DIAO revised and edited the final version.
Conflict of interest
Gang ZHENG,Jing-bo TONG,Tian-qi ZHANG,Zi-wu WANG,Xun LI,Ji-qing ZHANG,Chun-yu QI,Hai-zuo ZHOU,and Yu DIAO declare that they have no conflict of interest.
杂志排行
Journal of Zhejiang University-Science A(Applied Physics & Engineering)的其它文章
- Evaluation of heavy roller compaction on a large-thickness layer of subgrade with full-scale field experiments
- Frozen sand–concrete interface direct shear behavior under constant normal load and constant normal height boundary
- Shaking table tests on a cantilever retaining wall with reinforced and unreinforced backfill
- Model test of the mechanism underpinning water-and-mud inrush disasters during tunnel excavation in sandstone and slate interbedded Presinian strata
- Soil effect on the bearing capacity of a double-lining structure under internal water pressure
- Influence of groundwater level changes on the seismic response of geosynthetic-reinforced soil retaining walls
